
The U.S. Supreme Court’s decision in Dobbs v. Jackson Women’s Health OrganizationREF has placed questions about abortion and the rights of the unborn in the forefront of public discussion. As this discussion unfolds, it is critical that the connections between abortion, marriage, and the welfare state be understood.
Abortion on demand, established by the Roe v. Wade decision,REF provided a double dose of negative outcomes. It dramatically increased both abortions and births among non-married women. By contrast, conservative welfare reform policies enacted in the 1990s, by emphasizing personal responsibility and prudent limits on benefits, had the opposite effect: They simultaneously reduced both non-marital abortions and non-marital births. Welfare reform placed work requirements and time limits on cash welfare programs supporting predominantly single parents. It emphasized self-support, employment, reliance on fathers, and marriage. Welfare reform slowed and then halted the rapid disintegration of American family structure that plagued American society from the late 1960s through the 1980s. Reform substantially reduced poverty in single-parent families while contributing to a dramatic reduction in the non-marital abortion rate. Unfortunately, however, welfare reform is currently under siege by the Left.REF
Marriage and Abortion
The rise in abortion and the collapse of marriage are intrinsically linked; 85 percent of abortions occur among non-married women. Some 35 percent of pregnancies among non-married women are ended by abortion. Among married women, the figure is 3 percent. An unborn child of an unmarried woman is thus 11 times more likely to have its life ended by abortion than is the child of a married woman.
Because abortion is far more frequent among non-married women, expanding and strengthening marriage will inevitably bring down the number of abortions. Weakening and decreasing marriage will have the opposite effect.
However, because abortion and non-marriage are intertwined, there is a common view that an increase in non-marital abortion will cause a corresponding drop in births outside marriage. Some argue, therefore, that by reducing single parenthood, abortion on demand will reduce child poverty, welfare dependence, crime, and other social problems. In fact, the exact opposite is true.
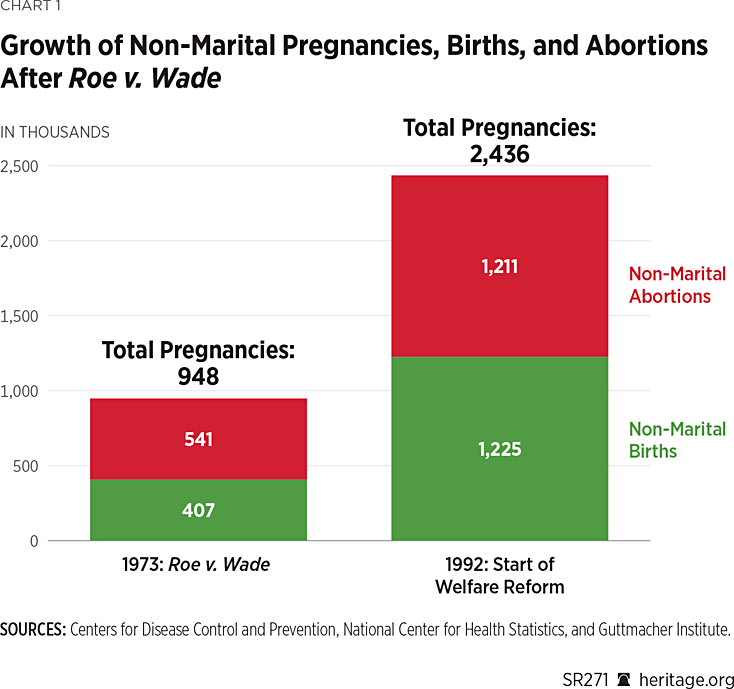
When Roe v. Wade established nationwide abortion on demand, abortion increased dramatically. But Roe v. Wade also dramatically altered social norms: Marriage declined, non-marital sexual activity increased, and non-marital pregnancies skyrocketed. Over the next two decades, annual non-marital abortions rose by 670,000, and annual non-marital pregnancies soared by nearly 1.5 million.REF For every added abortion, there were more than two added non-marital pregnancies and more than one extra non-marital birth. Roe v. Wade both increased abortion and accelerated the collapse of marriage.
The Social and Personal Benefits of Marriage
The collapse of marriage should be a paramount social concern. Marriage not only substantially reduces abortion, but also generates manifold social, psychological, and economic benefits. Marriage serves as an all-purpose antibody protecting against a broad array of social problems while positively enhancing personal and social well-being. For example, marriage dramatically reduces poverty, dramatically drops child sexual abuse, lowers suicide rates, decreases drug abuse, increases educational attainment, raises wages, improves physical and mental health, and increases longevity.REF
A healthy marriage is one of the two most important factors contributing to personal happiness.REF Marriage is also a very strong factor in promoting the upward mobility of children.REF The erosion of marriage has a marked effect on the violent crime rate in communities. Holding race, poverty, and other background variables constant, a one percentage point increase in the share of households in the community that are married is associated with a 2 percent decline in violent crime per capita.REF
Strong and widespread marriage also boosts overall growth in the economy. This important connection has been investigated by researchers W. Bradford Wilcox and Robert Lerman.REF Comparing economic growth between U.S. states, they found that states with greater declines in the number of intact families (measured by the percent of parents living in two-parent families) had slower growth across their entire economies. In other words, declining marriage impedes general economic growth.
The research by Wilcox and Lerman shows that for every 2 percent decline in the share of parents residing in two-parent families, there was a decline of approximately 1 percent in gross domestic product (GDP) per capita across the whole state population.REF Extrapolating these figures for the U.S. economy as a whole would mean that the decline in two-parent families over the past half-century would have resulted in a reduction of around 5.5 percent in annual GDP in 2021.REF This amounts to a loss of $1.3 trillion or around $3,800 per capita in 2021 alone. Over a decade, the economic loss comes to $13 trillion.
Permissive Welfare and Marital Decline
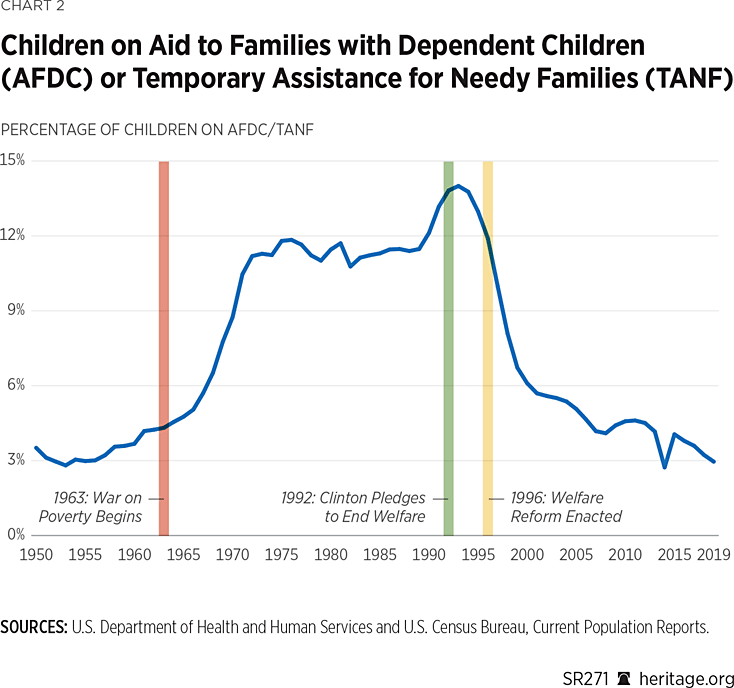
Roe v. Wade and abortion on demand were not the only factors leading to marital decline and the explosive growth in non-marital childbearing. Even more important was the expansion of the permissive welfare state. In 1964, President Lyndon Johnson announced the “War on Poverty.” This declaration was followed over the next decade by more lenient welfare policies, higher benefits, and extensive new welfare programs. By the late 1960s, eligibility and benefits in the Aid to Families with Dependent Children (AFDC) program were greatly expanded. Even nominal work requirements were made non-enforceable. New benefits were added through the food stamp and Medicaid programs.
The new welfare state promoted by the War on Poverty focused on subsidizing single parenthood.REF Added benefits reduced the importance of fathers in the home. Moreover, expanded AFDC and the new welfare programs had substantial marriage penalties. A low-income mother who married the employed father of her children would lose nearly all welfare benefits; marriage would thus cause the joint economic resources of many couples to fall. The War on Poverty had made marriage economically irrational for many parents.
In 1968, the Supreme Court added to the assault on marriage by ruling that a non-married mother had a legal right to continue to receive welfare while cohabiting with any man who was not the father of her children.REF However, if a mother married the employed father of her children, benefits almost always would be terminated. This amounted to a governmental declaration of war against stable marriage in low-income families.
High benefits plus the bizarre and explicit policy of condoning and subsidizing non-marital cohabitation while punishing healthful marriage led to the rapid collapse of marriage in low-income communities, especially among blacks. Within two decades, the percentage of black children born outside marriage rose from around 30 percent to 69 percent. In many low-income black communities, marriage all but disappeared.
Nor were blacks the only victims of the War on Poverty. In the 30 years following the declaration of the War on Poverty, the percentage of white children who were born outside marriage rose sevenfold from 3.4 percent in 1964 to 23.6 percent in 1993.REF At the beginning of the welfare reform period, the share of white children born outside marriage rivaled the black rate at the beginning of the War on Poverty.
The Arrival of Welfare Reform
The welfare reform process began in 1992 following presidential candidate Bill Clinton’s bold promise to “end welfare as we know it.”REF This pledge played a central, heavily publicized role in Clinton’s successful election campaign that year. The reform process continued through a period of heavily publicized legislative debate and state policy waivers and ended with the enactment of reform legislation in August of 1996.REF
Welfare reform had two dimensions: (1) the actual policy changes enacted in the law and (2) the very strong symbolic message of personal responsibility, time limits on aid, and work requirements that began with Clinton’s vivid promise in the 1992 election campaign.
Clinton promised to restore “a simple, dignified principle: no one who can work can stay on welfare forever.” According to Clinton, welfare should be “temporary” and never “a way of life.” His solution was a two-year time limit on welfare without work.REF Coming from a Democrat, these revolutionary proposals were the most significant statements on welfare since Johnson’s declaration of the War on Poverty almost two decades earlier.
The pledge to “end welfare as we know it” appeared widely in Clinton’s campaign ads and was heard across society including among current and prospective welfare recipients. Since welfare recipients do not study the details of legislation, the symbolic rhetoric surrounding reform had an initial impact on behavior that was at least as great as legislation itself.REF
Although President Clinton employed bold rhetoric, once he was elected, his welfare reform agenda was sidetracked by health care policy and strong opposition to welfare reform within his own party and Administration.REF The Clinton Administration, however, did approve a number of waivers for state experimentation in the AFDC program.REF
Clinton’s failure to act on his pledge to “end welfare as we know it” helped Republicans to win control of the House of Representatives in 1994. Emboldened by Clinton’s rhetoric, the Republicans featured welfare reform policies to strengthen work and marriage in their Contract with America.REF Once in control of the House, they proceeded to enact legislation embodying much of their original plan. Following two vetoes, President Clinton signed the Personal Responsibility and Work Opportunity Reconciliation Act of 1996 (PRWORA)REF into law on August 22, 1996, approximately two and a half months before the presidential election.REF By that time, many states had begun to increase their emphasis on work-related activities in AFDC in anticipation of coming reform.
The welfare reform law signed by President Clinton fundamentally changed the welfare system for families with children. The new law replaced AFDC with Temporary Assistance for Needy Families (TANF). TANF had two salient features: a work requirement imposed on up to half of the TANF caseload and a five-year time limit on benefits.REF The work requirements and time limits in the new TANF program were intended to reduce dependence and increase employment.REF Critically, however, these reforms were also aimed at strengthening two-parent families. It was hoped that these changes would stem the rise of non-marital births and stabilize family structure.
Finally, the reform law altered the new program’s federal funding structure. AFDC had been funded on an entitlement basis. Generally speaking, this meant that state governments set their own eligibility standards and per family benefit levels, and the federal government guaranteed that it would pay roughly half of whatever costs ensued. Under TANF, AFDC’s entitlement funding structure was replaced by fixed-sum funding. Each state was given a fixed annual amount of federal money that would not be not increased for inflation or caseload growth. Moreover, if a state government reduced its welfare caseloads or benefits, it was free to use any federal money saved for other state projects.REF
These new financing rules created strong financial incentives for state governments to reduce caseloads and dependence and divert limited funds to other services. Any state that chose to maintain a traditional AFDC-style welfare system with fixed benefits and growing caseloads would end up paying for the added costs with state revenue. In the long run, these added costs would be very high. Today, for example, to maintain 1996 benefit levels in constant dollars with historic AFDC caseload growth, the average state would need to quadruple its current state spending on TANF.
No state took the approach of using state revenue to sustain traditional welfare dependence. Instead, both red and blue states substantially cut their pre-reform caseloads.REF (See Chart 2.) Adjusted for inflation, combined federal and state spending on TANF has been cut approximately in half. Moreover, both red and blue states typically devote less than half of this diminished spending to cash welfare; by state choice, the majority of TANF funding goes instead to services such as day care and training.REF Although blue states still rhetorically support large permissive welfare systems, they clearly do not wish to finance such systems with their own revenue.
The Impact of Welfare Reform
Welfare reform in the 1990s produced a broad array of positive outcomes, reversing or diminishing many of the corrosive effects of the older permissive welfare system. Welfare reform sought to reduce dependence and increase employment, but most critically, it sought to halt the debilitating rise of non-marital childbearing. Work requirements and time limits in the new TANF program were implicitly aimed at reducing the economic utility of single parenthood and non-marital births and raising the comparative utility of marriage. It was hoped that these changes would stem the rise of non-marital births and stabilize family structure.
Welfare reform produced eight strong positive outcomes. Specifically, reform:
- Dramatically reduced traditional welfare dependence;
- Increased employment and produced an unprecedented drop in child poverty among single parents;
- Halted the rapid decline of two-parent families;
- Contributed strongly to the dramatic decrease in teen non-marital births;
- Halted the rapid rise in non-martial birth and pregnancy rates;
- Effectively stopped the rapid rise in the percentage of children born outside marriage;
- Produced a sharp decline in abortions among non-married teens; and
- Contributed substantially to the decreased abortion rate among non-married women in general.
Dramatically Reducing Traditional Dependence
Before reform, more than 9 million of America’s children—one child in seven—was receiving monthly AFDC cash benefits. More than 90 percent of the families on AFDC were headed by single parents. On average, these families remained on the program for 13 years.REF Only 8.9 percent worked.REF
After reform, the AFDC caseload (which had not appreciably declined even temporarily since World War II) quickly plummeted. By 2019, only 2.2 million of America’s children—3 percent—were receiving cash benefits from the AFDC’s replacement program, Temporary Assistance for Needy Families. As Chart 2 shows, welfare reform has cut the rate of dependence on traditional cash aid by nearly 80 percent.
Reducing Child Poverty Among Single-Parent Families by Two-Thirds
More than 90 percent of families in AFDC and TANF were single-parent families. Therefore, the impact of welfare reform on poverty can best be assessed by examining poverty trends for these single-parent families. Based on self-reported spending, the poverty rate among single-parent families was relatively flat before welfare reform. Immediately after reform, poverty among these families began to decline sharply, falling from 33 percent in 1996 to 11 percent today, a decline of more than 60 percent.REF
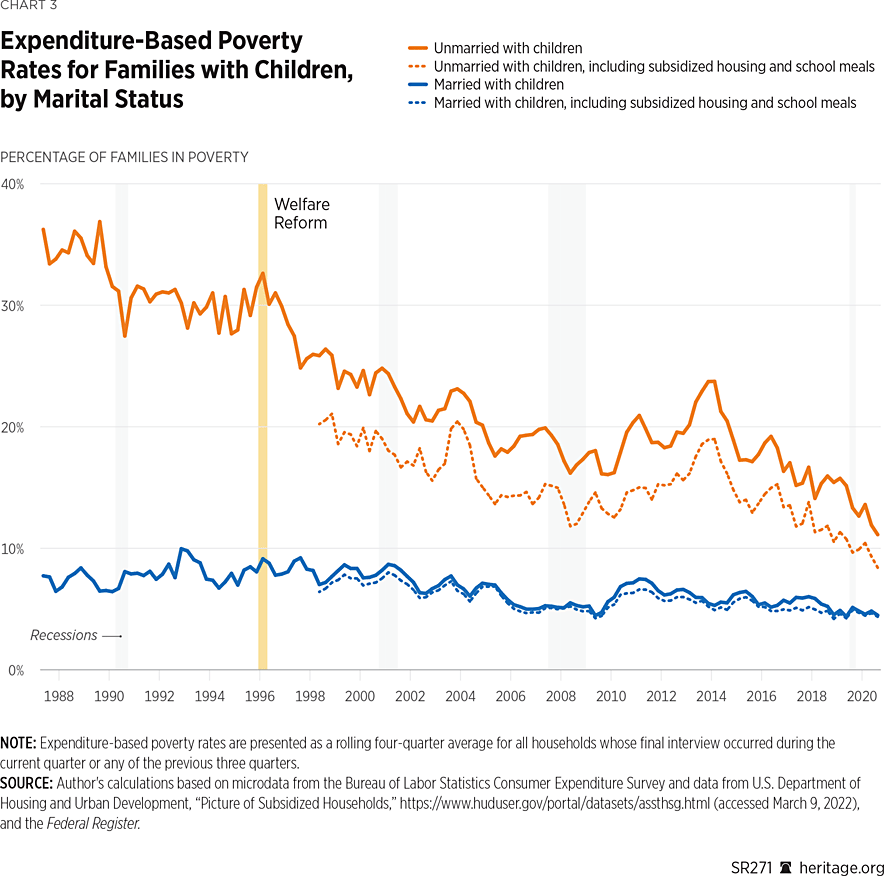
If the value of subsidized housing and school meals is counted, only around 8 percent of such families are poor today. Married-parent families (who were less affected by reform) experienced smaller reductions, starting from a lower initial poverty rate.
Halting the Steady Decline in Two-Parent Families
Today, welfare reform is viewed as primarily about employment and dependence, but that is misleading. Three of the 1996 act’s four major goals involved reducing non-marital childbearing and strengthening the two-parent family.REF
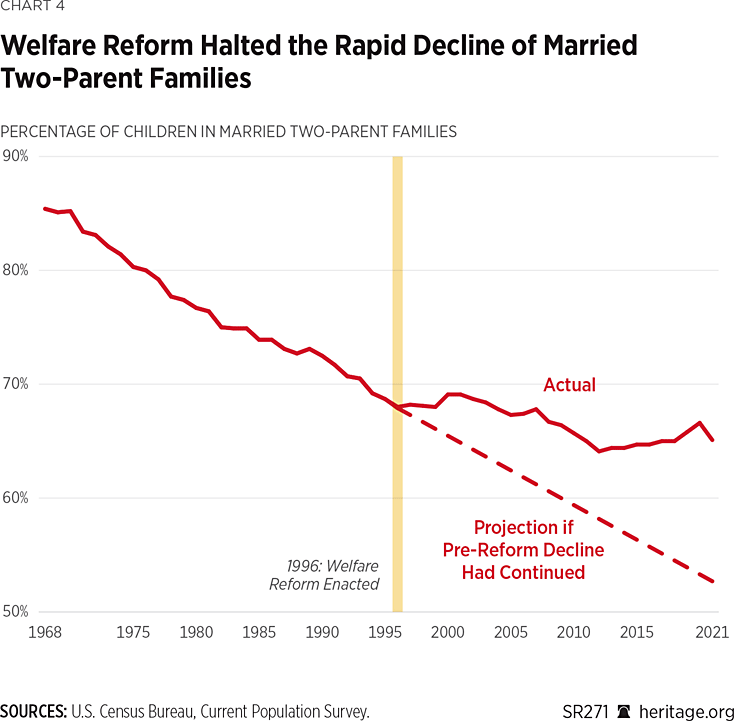
Before reform, family structure was disintegrating rapidly. This can be seen in Chart 4. The Y axis on the chart measures the percentage of children residing in married two-parent families. For more than two decades before welfare reform, this number decreased steadily. In 1970, 85 percent of children resided in married two-parent families; by 1996, the number had fallen to 68 percent.
However, as the chart shows, this relentless collapse of two-parent families came to an abrupt halt with the enactment of welfare reform in 1996.REF The long-term trend line kinked sharply, and for a quarter-century, family structure has been largely stable.REF The percent of children in married two-parent families today is only slightly lower than it was in 1996. This was, in fact, the greatest accomplishment of reform.
The dotted line on the chart shows the percentage of children who would have lived in two-parent families if the alarming trend in family deterioration before welfare reform had persisted. If family structure had continued to collapse at the pre-reform rate, only 53 percent of children would currently reside in two-parent families; an additional 9 million children would now reside in single-parent homes. Thus, if the negative trend had not sharply shifted with welfare reform, more than one-fifth of the children now living in two-parent homes would instead live in single-parent or no-parent families.
Because family structure promotes more rapid economic growth, the halt in family collapse shown in Chart 4 strengthened the economy and raised overall incomes. Based on the research by Wilcox and Lerman, the stabilization of family structure in the early 1990s raised GDP by an estimated $1.16 trillion and annual per capita income by $3,400 in 2021.REF
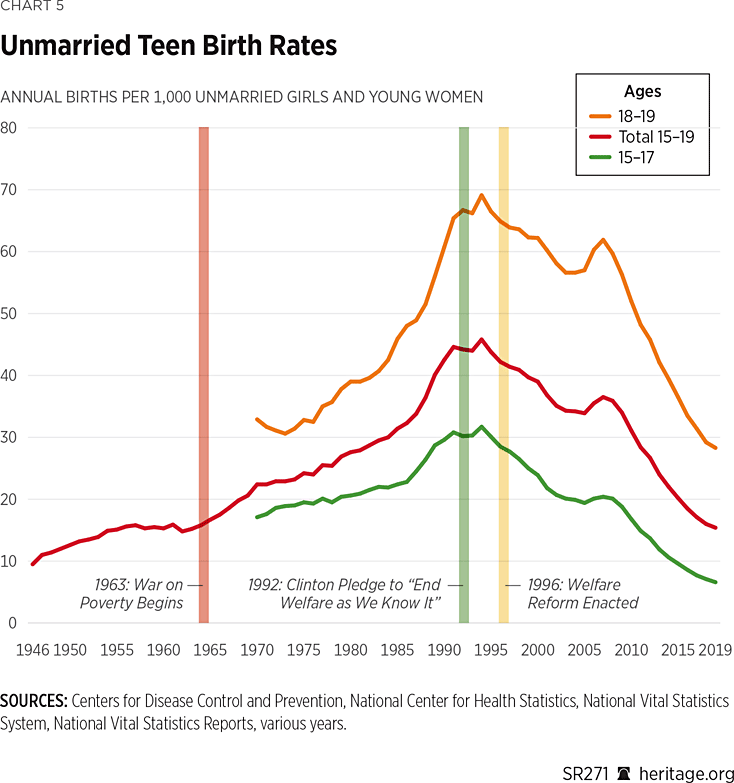
Reversing the Rapid Rise in the Teen Non-Marital Birth Rate
Welfare reform also coincided with and contributed strongly to a dramatic drop in the teen non-marital birth rate.REF (This rate measures the number of births outside marriage for each 1,000 non-married girls aged 15 to 19.) For three decades before reform, the teen non-marital birth rate skyrocketed. In 1960, as Chart 5 shows, there were 15 non-marital births for each 1,000 non-married girls and young women. By 1992, the rate had nearly tripled to 44 births per 1,000 non-married girls and young women.REF
With the onset of welfare reform, this steady increase promptly reversed, and the non-marital teen birth rate began to fall rapidly. By 2019, the non-marital teen birth rate had dropped all the way back to the 1960 level of 15 non-marital births per 1,000. Welfare reform was the key factor that effectively ended a severe and rising problem that had plagued the country for three decades.
Halting the Growth in the Non-Marital Birth Rate
Since its inception in the 1930s, the welfare system for families with children had focused both implicitly and explicitly on subsidizing single parents. With the onset of the War on Poverty, non-marital childbearing and single parenthood began to soar. With the establishment of the permissive welfare system in the late 1960s, non-marital births as a share of all births were rising by approximately 1 percent each year. This alarming trend continued relentlessly up to the election of President Clinton in the early 1990s.
Welfare reform sought to halt the deleterious rise on non-marital childbearing. Work requirements and time limits in the new TANF program were implicitly aimed at reducing the economic utility of single parenthood and non-marital births and raising the comparative utility of marriage.REF It was hoped that these changes would stem the rise of non-marital births and stabilize family structure.
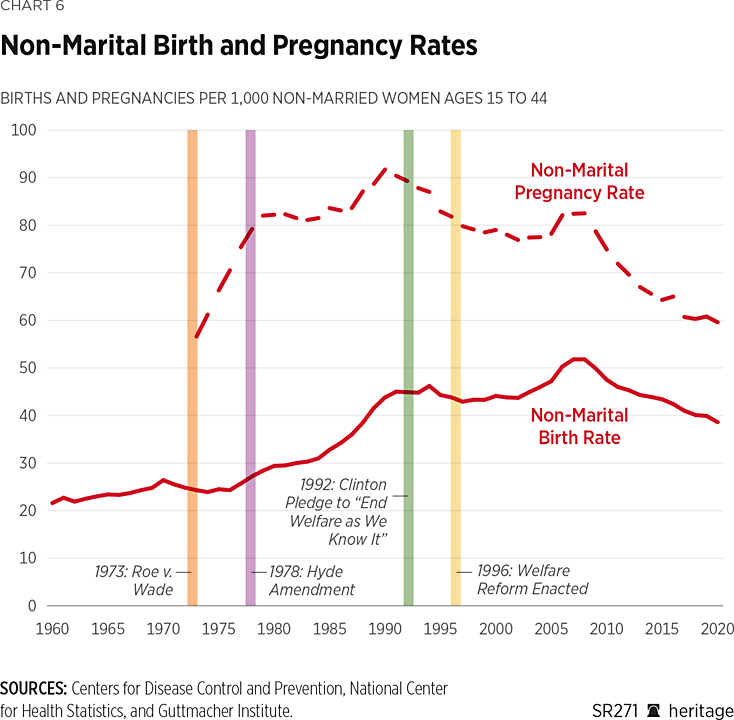
Chart 6 shows that these efforts were successful. The chart shows the historic trends in pregnancy and childbirth among non-married women before and after welfare reform. The solid line shows the non-marital birth rate, defined as the number of births per 1,000 unmarried women of childbearing age (15 to 44).REF The non-marital birth rate more than doubled in the three decades before welfare reform, rising from around 20 per 1,000 women in 1960 to 30 per 1,000 in 1980, and then exploded upward in the next decade, reaching 45 births per 1,000 in 1990.
This rise in non-marital childbearing cannot be explained by general demographic trends. During this period, the marital birth rate was on the opposite course. It fell dramatically in the 1960s and early 1970s and then remained flat in the 1980s. The welfare state, not demographic factors, was clearly the main driver of the sharp upward rise in non-marital births.
With the onset of welfare reform, the trend line abruptly shifted, and the non-marital birth rate abruptly halted its three-decade rise.REF The rate has remained relatively flat for 30 years; in 2022, it was actually slightly lower than when Clinton was elected in 1992. As the chart demonstrates, the welfare reform goal of halting the rise in the non-marital birth rate was largely achieved.
Although the long-run trend in the non-marital birth rate has remained nearly flat since the early 1990s, there have been small hills and valleys within this general pattern. During the 1990s, the rate fell slightly. This was followed by a sharp uptick in the rate between 2004 and 2008. This uptick was caused primarily by two factors: a surge in births to older non-married women who had postponed childbirth in the 1990s, and a steady rise in births to non-married cohabiting parents.
In 2008, the onset of the great recession led to sharp increases in unemployment and economic hardships. This prompted the non-marital birth rate to fall sharply. Between 2008 and 2011, the recession appears to have caused a drop of about four births per 1,000 non-married women, or approximately half of the decline in the period.REF
After 2010, the non-marital birth rate fell slowly and steadily. This decline was caused largely by an end to the surge in postponed births to older non-married women and by a halt in the rise of births to non-married cohabiting parents. Throughout the entire period, the welfare reform policies continued to operate, providing an altered incentive structure that enabled the continuing reduction of non-marital births.
The dotted line on Chart 6 represents the non-marital pregnancy rate. This is defined as the number of pregnancies per 1,000 unmarried women aged 15 to 44.REF (Pregnancy data are not available for the years before 1973 when Roe v. Wade was decided.) As noted previously, Roe v. Wade was followed by a dramatic surge in non-marital abortion and an even larger increase in non-marital pregnancy. Opening access to abortion obviously led to a dramatic increase in non-marital sexual activity with lax use of contraception.
In the early 1990s, however, a sharp inflection point in the trend of non-marital pregnancy appeared.REF Following the onset of welfare reform, the rate reversed and then fell steadily for the next 30 years. In 2022, the non-marital pregnancy rate was 59 per 1,000, one-third lower than the rate in 1992.
Systematic welfare reform was the primary cause of the continuing drop in non-marital pregnancy rates after 1992. Newly established time limits and work requirements in welfare made childbearing outside of marriage less attractive. As a consequence, casual, non-committed sexual activity became less frequent, and contraception was used more effectively.REF As non-martial pregnancy declined, the increase in non-marital births came to a halt.
Another subsidiary factor in the later decline of non-marital pregnancy rates was the increased use of Long-Acting Reversible Contraceptives (LARCs), which include primarily Intrauterine Devices (IUDs) but also hormonal implants.REF Between 2002 and 2019, LARC use increased gradually from 2 percent to 10.7 percent of all women of childbearing age.REF LARCs are nearly 100 percent effective in preventing pregnancy.REF Increased substitution of LARCs for less effective alternatives may have reduced the non-marital pregnancy rate by four to eight pregnancies per 1,000 women (married and non-married) between 2002 and 2019.REF
Overall, welfare reform generated an abrupt change in the trend in non-marital pregnancies and births in the early 1990s. After that, welfare reform policies have continued to operate to the present. The continuation of welfare reform provided the systemic incentive structure that enabled other factors to operate.
Halting the Rapid Rise in the Percentage of Children Born Outside Marriage
Another important measure of trends in family formation is the percentage of children born outside of marriage.REF Chart 7 shows that the share of children born outside of marriage has increased dramatically over time. In 1964, at the beginning of the War on Poverty, 7 percent of children were born outside of marriage. This number rose with increasing rapidity during the permissive welfare period, reaching 33 percent in 1994 in the middle of the welfare reform period.
Then, as the chart shows, the trend line kinked abruptly and remained nearly flat for a decade. The trend briefly resumed an upward course between 2004 and 2008.REF It then plateaued and remains at approximately that level today. In the long term, welfare reform coincided with a decisive shift in the trajectory of family formation. During the period between Roe v. Wade in 1973 and the onset of welfare reform, the share of children born outside of marriage was rising steadily by 0.9 percent points per year. After reform, the ratio continued to rise but at a much slower average pace of 0.4 percent points per year.
The dotted line on Chart 7 shows the share of births that would have occurred outside of marriage if the pre-welfare trends in the non-marital birth ratio had continued unabated. As the chart shows, more than 55 percent of children would now be born out of wedlock. The actual number today (shown on the red line on the chart) is 40.5 percent. The shift toward marriage and away from single parenthood that occurred with welfare reform means that an additional 15 percent of children, or 550,000 children, are born to married couples rather than single parents each year.
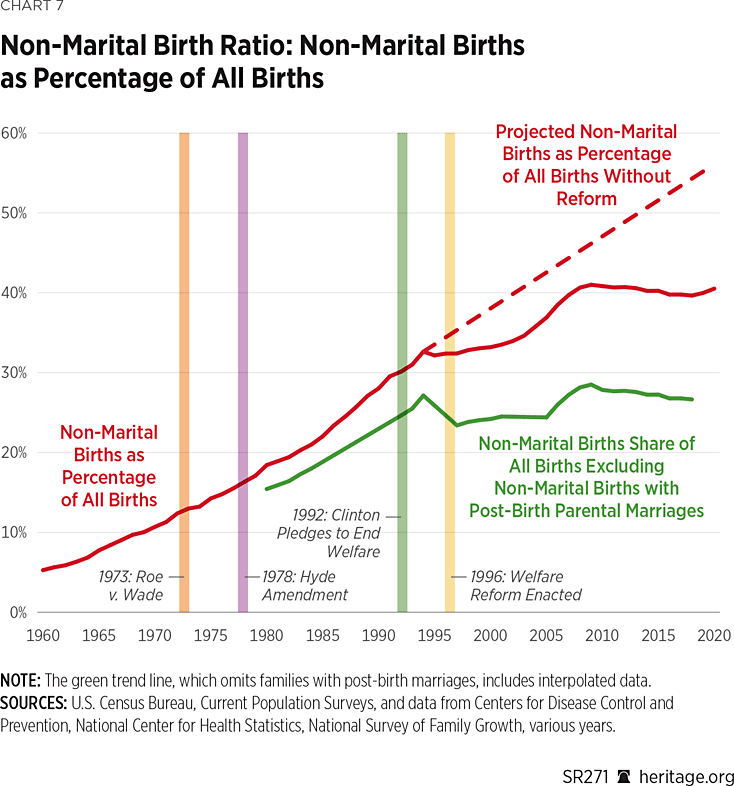
The solid red line in Chart 7 shows that 60 percent of children today are born to married couples and 40 percent to unmarried parents. However, there is a little-known social change that qualifies this basic statistic. That change is the strong increase in parental cohabitation at the time of a child’s birth followed by parental marriage after the child’s birth.
Remarkably, one-fourth (around 900,000) of America’s children each year are born to parents who are not married but who are living together when the child is born. This means that 85 percent of children are born either to parents who are married (60 percent) or cohabiting (25 percent) at birth. Only 15 percent of children are born to mothers who live alone without the child’s father.REF
Births to cohabiting parents have increased enormously since welfare reform, rising from 11 percent of all births in the early 1990s to 26 percent today. By contrast, births to isolated single mothers living alone have remained essentially flat at about 16 percent for this period. Nearly all of the growth in non-marital childbearing since the onset of welfare reform has occurred among non-married but cohabiting parents.
Of course, cohabitation by two parents is not the equivalent of marriage.REF The good news is that half of the parent couples that have children while cohabiting do marry within five years of the child’s birth.REF When these marriages occur, the subsequent relationship will be as stable as other marriages within society.REF Such marriages generate benefits for children, parents, and society.
The fact that about half of the parents who were cohabiting at the time of the child’s birth subsequently marry means that each year, some 13 percent of each birth cohort (or 470,000 children) benefit from post-birth parental marriages. Altogether, today approximately 73 percent of children are born to married couples (60 percent) or have parents who marry after the birth (around 13 percent).
Strikingly, this overall figure is very similar to the same figure at the beginning of welfare reform in 1992 when 70 percent of children were born to married couples and perhaps 5 percent had parents who married after birth. Once marriages after birth are counted, there has been little decline in marriage since the start of welfare reform. This critical fact is shown by the green line on Chart 7, which is nearly flat for the entire post-reform period.REF
The increase in parental cohabitation and post-birth marriage began before welfare reform but increased dramatically during the reform and post-reform periods. This new trend was in keeping with the premises of reform, which held that if the utility of conventional welfare was reduced, potential single mothers would come to rely more heavily on both work and fathers. However, the exact mechanism of marital increase was certainly not foreseen.
Nonetheless, the simple fact that one in four parent couples cohabit at the time of birth represents an enormous opportunity to strengthen family formation. It indicates that while marriage has eroded in lower-income communities, implicit interest and support for stable relationships between mothers and fathers remains.
Reducing Teen Pregnancy and Abortions
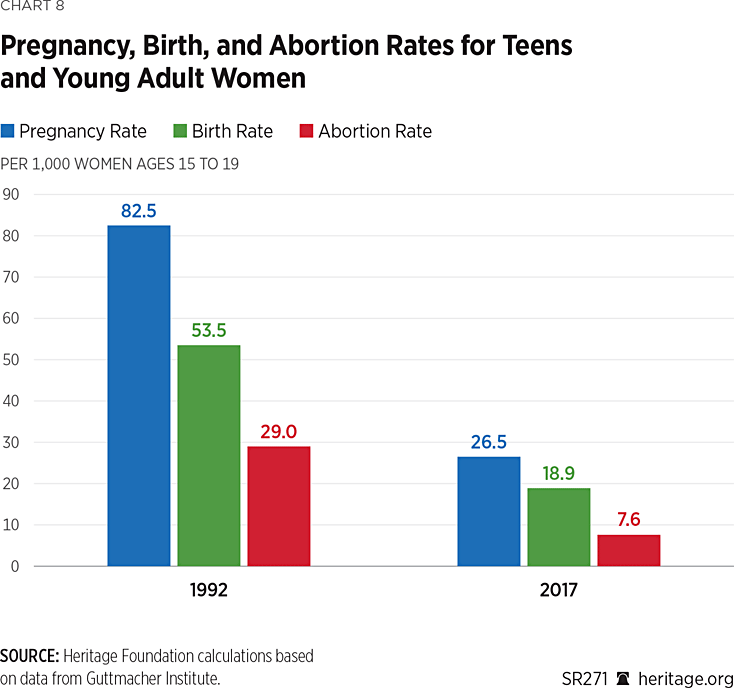
Some opposed welfare reform in 1996 because they believed it would increase abortions, particularly among teens. Chart 5, presented above, shows that welfare reform was followed by a rapid decline in teen births. Was this decline caused by an increase in abortions?
As Chart 8 demonstrates, the answer is no. In fact, the opposite occurred. Welfare reform marked the onset of a rapid and concurrent decline in pregnancies, abortions, and births among girls aged 15 to 19. All three metrics fell together in nearly equal proportions. In 1992, there were 36 abortions per 1,000 women aged 15 to 19; by 2017, the number had fallen to eight per 1,000 women aged 15 to 19.REF
Reducing the Non-Marital Abortion Rate
Chart 9 shows the non-marital pregnancy rate and non-marital abortion rate over time. The non-marital pregnancy rate (previously shown in Chart 6) measures the number of pregnancies per 1,000 un-married women aged 15 to 44. The non-marital abortion rate measures the number of abortions per 1,000 non-married women aged 15 to 44.
The non-marital pregnancy rate is represented by the dotted line on the chart.REF This rate skyrocketed after Roe v. Wade. Following implementation of the Hyde Amendment, which barred federal funding for abortion in 1978, the pregnancy rate continued to increase, although at a slower pace. (The slower rise in pregnancy suggests that the Hyde Amendment led to somewhat greater self-restraint in non-marital sexual activity and more consistent contraceptive use, but this change alone was not enough to stop the rise in the non-marital pregnancy rate.REF) By 1992, the pregnancy rate was 89 per 1,000 women. This means that about one in 10 non-married women became pregnant each year at the beginning of welfare reform.
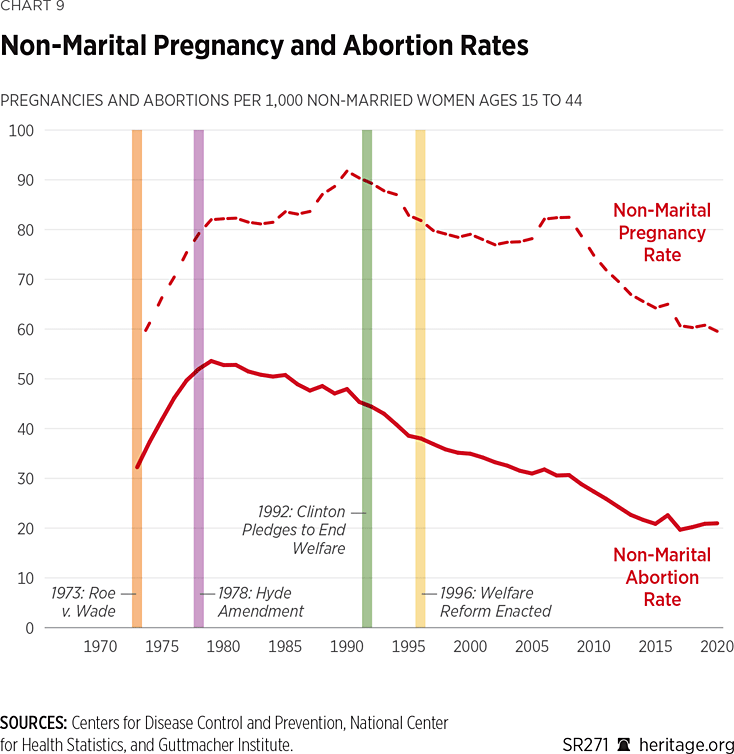
Following the onset of welfare reform, the non-marital pregnancy rate fell steadily through the post-reform period; by 2020, the rate was 59.6 per 1,000, nearly one-third lower than the peak at the beginning of reform. This led not only to a substantial decrease in the non-marital birth rate (as shown in Chart 6), but also to a substantial decline in the non-marital abortion rate. Because each pregnancy by definition ends in either a birth or an abortion,REF if the non-marital pregnancy rate declines, ceteris paribus, both non-marital births and abortions will decline. This is exactly what happened following welfare reform.
The decline in the non-marital abortion rate is shown by the solid line on Chart 8.REF The rate soars upward after Roe v. Wade, peaking at 54 per 1,000 women in 1979. Approximately one in 20 non-married women had an abortion that year.
However, the non-marital abortion rate stops rising shortly after implementation of the Hyde Amendment and remains relatively flat during the 1980s. In 1992 (the year candidate Bill Clinton proposed to “end welfare as we know it”), the abortion rate was 44 per 1,000 women. During the next three decades, the rate fell steadily, reaching 21 per 1,000 in 2020. Approximately one non-married woman in 50 had an abortion that year. Overall, the non-marital abortion rate has been cut by more than half since welfare reform.
The steady decline in the non-marital pregnancy rate was obviously a key factor in the non-marital abortion rate’s decline, but it was not alone. A second key factor was the accompanying decline in the abortion-to-pregnancy ratio. This ratio measures the odds, after a non-marital pregnancy has occurred, that the pregnancy will be terminated by an abortion. An abortion-to-pregnancy ratio of 0.5 means that half of the pregnancies will end in abortion.
Analytically, the non-marital abortion rate equals the non-marital pregnancy rate multiplied by the non-marital abortion-to-pregnancy ratio. For example, if 100 per 1,000 non-married women become pregnant in a given year and the abortion-to-pregnancy ratio is 50 percent, then the abortion rate will be 50 abortions per 1,000 women (100 per 1,000 x 0.5 = 50 per 1,000).REF
The non-marital abortion-to-pregnancy ratio rose only slightly after Roe v. Wade. Nearly all of the dramatic increase in abortions was due to the increase in non-marital pregnancy. The abortion-to-pregnancy ratio peaked at 0.66 at the time of the Hyde Amendment. After that, the ratio began to decline sharply. This indicates that the removal of government funding reduced abortion among non-married pregnant women. But while the ratio fell, the non-marital pregnancy rate continued to rise, and this rise both blunted the impact of the Hyde Amendment in reducing the overall abortion rate and led to a large increase in non-marital births.
The non-marital pregnancy rate finally began to decline only with the onset of welfare reform. Following reform, both the non-marital pregnancy rate and the abortion-to-pregnancy ratio declined steadily and together. This produced for the first time a simultaneous decline in both non-marital births and abortions.
Between 1992 and 2020, the non-marital pregnancy rate fell from 89.3 per 1,000 to 59.6 per 1,000, while the abortion-to-pregnancy ratio fell from around 0.5 to 0.35. These two factors contributed almost equally to the drop in the non-marital abortion rate, which was cut by more than half, falling (as noted) from 44 abortions per 1,000 non-married women to 21 per 1,000 non-married women over the period.
These changes have made an enormous difference in the annual number of non-marital abortions in the U.S. If both the pregnancy rate and the abortion-to-pregnancy ratio had remained fixed at their 1992 levels, the total number of non-marital abortions would have been around 1.68 million in 2020. The actual number was 795,000. Thus, there has been a total drop of 888,000 annual non-marital abortions relative to the number that would have occurred if the pregnancy rate and abortion-to-pregnancy levels had remained at their pre-reform levels.
Approximately half of this drop was due to the decline in the non-marital pregnancy rate that was initiated by welfare reform. There were at least 486,000 fewer abortions in 2020 because of the steady decline in non-marital pregnancies initiated and fostered by welfare reform.
But these estimates may well understate the impact of welfare reform in reducing abortion because they assume that the non-marital pregnancy rate would simply have remained flat without reform. In reality, the non-marital pregnancy rate was rising rapidly before welfare reform; it seems likely that this rise would have continued without substantial changes in government policy or other factors. Welfare reform halted (or at least strongly contributed to the halt of) the rapid rise in the non-marital pregnancy rate.REF It is therefore possible that welfare reform interrupted and reversed what otherwise would have been an ongoing rise in non-marital pregnancy. In that case, welfare reform, through its added effect on reducing future non-marital pregnancy, would have reduced annual non-marital abortions by more than 486,000 per year.
Cumulatively, the combined decrease in the non-marital pregnancy rate and abortion-to-pregnancy ratio since the beginning of welfare reform has resulted in 15.9 million fewer non-marital abortions.REF Some 6.8 million fewer abortions have been the result of the decline in the non-marital pregnancy rate initiated and (at least in part) sustained by welfare reform. The other 9.1 million fewer abortions are the result of the fall in the non-marital abortion-to-pregnancy ratio.
Why Did the Abortion-to-Pregnancy Ratio Fall?
The decline in the non-marital abortion-to-pregnancy ratio has thus had a strong effect on non-marital abortions. The reasons for the ongoing decline in the non-marital abortion-to-pregnancy ratio are not entirely clear. The decline began well before welfare reform and continued during the reform and post-reform periods.
This decline is likely to have been driven by several factors. For example, the Hyde Amendment clearly reduces abortion. States that adhere to the principle of limiting government funding for abortion have lower abortion rates than do states that circumvent the Hyde Amendment by providing state funds for abortion. Dr. Michael New has found that the Hyde Amendment prevents approximately 63,000 abortions each year and saved 2.41 million lives through reduced abortions between 1976 and 2020.REF
However, the scope of the Hyde Amendment has remained largely unchanged since the late 1970s and early 1980s, and the list of states that adhere to or circumvent the amendment has been largely fixed since that time. Although the Hyde Amendment has consistently reduced abortion since the early 1980s, its fixed scope makes it an unlikely explanation for why the non-marital abortion-to-pregnancy ratio has fallen dramatically since 1990. New’s statistics, for example, show that the Hyde Amendment prevented around 58,000 abortions in 1990; this number rose very slowly over the next two-and-a-half decades, reaching 63,000 in 2015. Since the impact of the Hyde Amendment appears to have been fairly constant, it cannot explain the one-third drop in the abortion-to-pregnancy ratio that has occurred since 1992.
Another policy that has contributed to the reduction of abortion rates and the abortion-to-pregnancy ratio is state-established informed consent laws. These laws have become more prevalent since the Supreme Court’s 1992 ruling in Planned Parenthood v. Casey. Before 1992, almost no states had these laws; by 2021, 28 states had them.
More than 20 states have enacted “Casey-style” informed consent policies requiring that “women seeking an abortion must be given the opportunity to view state-produced materials that include color photos of fetal development.”REF These laws may also require waiting periods before abortion; 24 states have some form of waiting period, and 12 states require two trips to the abortion facility before the abortion can be performed.REF
Both “Casey-style” informed consent policies and waiting period policies that require at least two trips to the abortion facility before an abortion can be performed cause statistically significant and meaningful reductions in abortion rates in the states that have enacted them, saving hundreds of thousands of lives. However, the impact of these policies does not appear to be sufficient to account for a substantial portion of the national decline in the abortion-to- pregnancy ratio since 1992, in part because of the limited number of states with those policies.REF
Another factor in the decline would be the extensive public education efforts by the pro-life community to demonstrate the humanity of the unborn child. For decades, the right-to-life community has conducted public education campaigns to present the human development status of unborn children facing abortion. They have sought to change the perception that abortion is “merely” another form of birth control. These efforts have likely affected public and personal views on the acceptability of abortion. For example, President Clinton declared that abortion should be “safe, legal and rare,” indicating that abortion was largely undesirable and not to be used except as a last-ditch option. In 2008, candidate Hillary Clinton repeated this formula.REF Changes in perceptions are very likely to have reduced abortions and non-marital pregnancies.
Finally, welfare reform played a role in the decline of the abortion-to-pregnancy ratio. Before reform, 40 percent of non-marital births occurred to parents who were not married but were cohabiting at the time of birth. After reform, this rose to 60 percent.REF Welfare reform contributed to the increase in cohabitation by making it far less likely that non-married mothers would live alone on AFDC and far more likely that they would depend on the child’s father either through cohabitation or marriage.
The rise in cohabitation played an indirect role in the decline of non-marital abortion and the non-marital abortion-to-pregnancy ratio. Involvement of the mother with the child’s father reduces the probability of abortion; thus, increased couple cohabitation at the time of and after conception reduces non-marital abortion.REF Cohabiting couples are half as likely to terminate a pregnancy through abortion when compared to isolated non-married women.REF Over the past three decades, the number of non-marital pregnancies among cohabiting couples has risen from around 30 percent to more than half of all non-marital pregnancies. This rise in cohabiting couples as a share of non-marital pregnancies has led to at least a third of the drop in the non-marital abortion-to-pregnancy ratio in the post-reform period.REF
Permissive Welfare Does Not Reduce Abortions
In the post-Dobbs environment, some contend that the key to reducing abortion is to increase subsidies to single parenthood. As one advocate states, “Reducing abortions logically implies more single moms having babies.”REF In this view, a return to permissive welfare will reduce abortion by encouraging non-married pregnant women to give birth rather than abort the child.
This argument turns historical reality upside down. During the regime of permissive welfare, abortion rates were obviously much higher, not lower. Welfare reform clearly contributed to a substantial drop in non-marital pregnancies that in turn led to far fewer, not more, abortions.
History following both Roe v. Wade and welfare reform shows that the key determinant of both the non-marital birth and abortion rates is the non-marital pregnancy rate. An increase in the non-marital pregnancy rate leads to both higher non-marital and birth rates. Conversely, a decrease in the pregnancy rate leads to fewer non-marital births and abortions. But the critical non-marital pregnancy rate never decreased until welfare reform.
Finally, if permissive welfare actually led pregnant single women to choose birth rather than abortion, then the non-marital abortion-to-pregnancy ratio should have risen after welfare reform curtailed permissive welfare. In fact, the opposite happened: The abortion-to-pregnancy ratio fell substantially after reform. This meant that the smaller number of non-married women who became pregnant were more likely to give birth rather than abort their pregnancies.
True, the downward trend in the abortion-to-pregnancy ratio began before welfare reform; it affected both married and unmarried women and has continued steadily since reform. In other words, welfare reform was not the primary cause of this downward trend, but it clearly did not impede it.
Restoring permissive welfare will not reduce abortions. It will, in fact, reactivate the steady disintegration of married families that dominated the pre-reform period. Policies that seek to reduce abortion by strengthening marriage are likely to be the most successful in the long run. Married women are far less likely to have abortions. Married families are more likely to be politically and culturally conservative and therefore to support pro-life views. On the other hand, an increase in single-parent families wedded to the welfare state is unlikely to sustain a conservative and pro-life culture.
Policies to Strengthen Marriage and Reduce Abortion
Instead of restoring permissive welfare, those who truly care about reducing abortion, preserving marriage, and improving social well-being should build on the successes of welfare reform. This would include establishing or strengthening work requirements in welfare programs and removing or sharply reducing marriage penalties within the welfare system.
Work requirements can be established or strengthened in many welfare programs including TANF, food stamps, subsidized housing, the Earned Income Tax Credit (EITC), and cash grants provided through the Child Tax Credit (CTC). Work requirements obviously reduce dependence and increase employment and earnings, but they also have a strong pro-marriage effect. Attaching work requirements to any welfare benefit reduces the utility of that benefit to the potential recipient: A benefit you have to work for is less attractive than a benefit provided for free.REF Work requirements therefore reduce the utility/reward of welfare dependence for a single mother and increase the relative utility/reward of self-support and support received from the child’s father through either cohabitation or marriage. The changes in non-marital pregnancy and births and parental cohabitation following welfare reform are largely the side effects of the work requirements established by reform.REF
Welfare reform clearly slowed, if not stopped, the erosion of marriage in the U.S. Nonetheless, marriage and family formation remain in a precarious condition. The next step to strengthen marriage would be to remove or significantly decrease the marriage penalties that exist across the welfare system. Welfare marriage penalties exist because benefits are based on the joint income within a household. If a single mother marries an employed father, the earnings of the father will be applied to her eligibility, and benefits will be sharply cut or eliminated entirely.REF This creates a considerable financial incentive not to marry. Significant marriage penalties exist in nearly all means-tested welfare programs.REF
It is clear that marriage penalties have played a large role in the rise of parental cohabitation. Welfare reform incentivized partial reliance on a father’s earnings rather than exclusive reliance on traditional welfare. In response, the share of total births to parents who were not married but were cohabiting at the time of birth have increased from 11 percent in the early 1990s to 26 percent today.REF By contrast, the share of births to stand-alone mothers did not increase at all but remained fixed at 15 percent of total births.
Why did these couples cohabit rather than marry? Why do those who do marry wait as long as five or more years after their children’s birth to do so? Co-habitational births, like births to isolated single parents, occur predominantly among less educated, lower-income parents. For example, 42 percent of mothers without a high school degree cohabit at the time of birth compared to 9 percent of college-educated mothers.
The most obvious reason for the preference to cohabit rather than marry is the strong financial penalties against marriage in nearly all government means-tested programs that provide cash, food, housing, medical care, day care, and other social services. Lower-income families are most affected by these penalties. They are aware that benefits in most welfare and social service programs will be cut if they marry. A parent couple can substantially increase its joint economic resources by not marrying and keeping the father’s earnings “off the books,” thereby maximizing the family’s eligibility for and benefits from a broad array of means-tested welfare programs.REF
Unfortunately, cohabitation is unstable. Cohabiting couples who do marry are likely to remain together; those who do not are likely to fall apart.REF In most cases, stable marriage will be beneficial to the parents, the child, and society. This is particularly true for children: Children raised in the context of marriage have substantially better life outcomes, including higher levels of educational attainment and better emotional health.REF When fathers are absent, the consequences are dire: During their teen years, boys are more likely to engage in delinquent behavior, and girls are seven to eight times more likely to experience a teenage pregnancy.REF
Clearly, government policy should not penalize marriage; it should not financially discriminate against low-income parents who choose to marry. Policymakers should seek to reduce or eliminate marriage penalties within the broad welfare system, preferably holistically rather than piecemeal.REF They can implement this reform by eliminating fraud, waste, and excess benefits in existing programs and rechanneling the savings to marriage penalty reduction.REF Reducing marriage penalties would significantly increase marriage rates. One study, for example, finds that reducing the marriage penalty in the EITC by $1,000 would increase the marriage rate among low-income women by 10 percent.REF Increasing marriage in this manner would also significantly reduce abortion.
Conclusion
Any conservative approach to the conjoined issues of marriage, welfare, and abortion must begin with marriage. As the preamble of the 1996 welfare reform law states, “Marriage is the foundation of a successful society.”REF The decline of marriage is the central factor driving child poverty, dependence, abortion, and many other social problems.
Marriage is intrinsically linked to human flourishing. It is vital to children’s well-being and upward mobility. The collapse of marriage expands the state’s influence, function, and expenditure. A very large share of the panoply of government welfare and social services (including cash, food, and housing aid, foster care, child protection, and drug abuse services) consists of palliatives set up to mitigate the consequences of family disintegration throughout low-income and moderate-income communities. These policies are like efforts to glue Humpty Dumpty together again after his fall. Serious welfare reform would seek to restore marriage, preventing Humpty from falling in the first place.
The conservative welfare reform enacted in the 1990s serves as a template for future policy. That reform simultaneously reduced child poverty, stabilized family structure, halted the rise in the non-marital birth rate, dramatically cut teen pregnancy and births, and reduced abortion.
The Dobbs decision should spark a renewed examination of the linkages between marriage, welfare, and abortion. High abortion levels are inherently rooted in the collapse of marriage. Given that 85 percent of abortions occur among non-married women, the erosion of marriage inevitably puts strong upward pressure on the abortion rate.
Before welfare reform, marriage among families with children was rapidly disappearing. Reform constrained the permissive features of welfare by limiting eligibility, imposing work and training requirements, and establishing time limits. In response, family structure stabilized, and the rapid rise in the non-marital birth rate was halted. The non-marital pregnancy rate, which is the necessary precursor to most abortion, stopped rising and began a steady fall.
The fall in the non-marital pregnancy rate following reform has resulted in at least 6.8 million fewer abortions. In addition, the rise in the share of non-marital pregnancies pertaining to cohabiting couples rather than isolated single women has resulted in a drop of another 3 million non-marital abortions. Altogether, changes initiated and promoted by welfare reform have led to 9.8 million fewer non-marital abortions.REF
Conservatives should follow a two-track strategy: Seek to limit abortion directly while simultaneously strengthening marriage. These policies are synergistic because increased marriage inherently reduces abortion. What should be avoided are policies that seek to reduce abortion by restoring permissive welfare and increasing subsidies for single parenthood. This approach is sure to backfire, resulting in less marriage and more abortion.
In the long run, it will prove impossible to reduce abortion by subsidizing the collapse of marriage. But policymakers can reduce abortion by eliminating or sharply limiting the welfare system’s penalties against marriage, tightening work requirements in welfare, and scaling back rather than increasing the already prolific subsidies for non-marriage and single parenthood.
Robert Rector is Senior Research Fellow in the Center for Health and Welfare Policy at The Heritage Foundation.
Appendix: Methodology and Data Sources
Non-Marital Birth Rates
Non-marital births and non-marital birth rates for non-married women ages 15 to 40 are taken from natality statistics prepared by the National Center for Health Statistics utilizing 100 percent of birth certificates registered in the 50 states and the District of Columbia.
Figures for 1960–2003 appear in Table 1-17, “Number and Percent of Births to Unmarried Women, by Race and Hispanic Origin: United States, 1940–2003,” and Table 1-18, “Birth Rates for Unmarried Women by Age of Mother, According to Race and Hispanic Origin: United States, Specified Years, 1940–55 and Each Year 1960–2003,” in U.S. Department of Health and Human Services, Centers for Disease Control and Prevention, National Center for Health Statistics, Vital Statistics of the United States, 2003, Volume I, Natality, https://www.cdc.gov/nchs/products/vsus/vsus_1980_2003.htm (accessed April 24, 2023).
Figures for years after 2003 are taken from various “Births: Final Data” reports prepared by the National Center for Health Statistics for individual years and published in NCHS National Vital Statistics Reports, available at https://www.cdc.gov/nchs/products/nvsr.htm (accessed April 24, 2023). The most recent of these is Michelle J.K. Osterman, Brady E. Hamilton, Joyce A. Martin, Anne K. Driscoll, and Claudia P. Valenzuela, “Births: Final Data for 2021,” U.S. Department of Health and Human Services, Centers for Disease Control and Prevention, National Center for Health Statistics, National Vital Statistics System, National Vital Statistics Reports, Vol. 72, No. 1 (January 31, 2023), https://www.cdc.gov/nchs/data/nvsr/nvsr72/nvsr72-01.pdf (accessed April 24, 2023).
Teen Non-Marital Birth Rates
Historical data on non-marital births and birth rates by age of the mother are available from various yearly volumes of U.S. Department of Health and Human Services, Centers for Disease Control and Prevention, National Center for Health Statistics, Vital Statistics of the United States, Volume 1, Natality, available at https://www.cdc.gov/nchs/products/vsus/vsus_1980_2003.htm (accessed April 24, 2023).
Useful multi-year data may be found in Table 16, “Birth Rates for Unmarried Women, by Age of Mother: United States, 1970, 1975, and 1980–2013, and by Age and Race and Hispanic Origin of Mother: United States, 1980–2013,” in Joyce A. Martin, Brady E. Hamilton, Michelle J.K. Osterman, Sally C. Curtin, and T.J. Mathews, “Births: Final Data for 2013,” U.S. Department of Health and Human Services, Centers for Disease Control and Prevention, National Center for Health Statistics, National Vital Statistics System, National Vital Statistics Reports, Vol. 64, No. 1 (January 15, 2015), pp. 41–43, https://www.cdc.gov/nchs/data/nvsr/nvsr64/nvsr64_01.pdf (accessed April 24, 2023), and Table 10, “Birth Rates for Unmarried Women: United States, 2010–2019, and by Age and Race and Hispanic Origin of Mother: United States, 2016–2019,” in Joyce A. Martin, Brady E. Hamilton, Michelle J.K. Osterman, and Anne K. Driscoll, “Births: Final Data for 2019,” U.S. Department of Health and Human Services, Centers for Disease Control and Prevention, National Center for Health Statistics, National Vital Statistics System, National Vital Statistics Reports, Vol. 70, No. 2 (March 23, 2021), p. 28, https://www.cdc.gov/nchs/data/nvsr/nvsr70/nvsr70-02-508.pdf (accessed April 24, 2023).
Non-Married Women
Various calculations in this paper use the number of non-married women aged 15 to 44 for individual years. For most years, this number has been arithmetically derived from CDC natality reports by dividing the number of non-marital births in a year by the non-marital birth rate for that year. When these calculated figures can be compared to published population figures, the figures will be nearly identical.
Number of Non-Marital Abortions
The number of non-marital abortions in each year was calculated by multiplying the total number of all abortions provided by the Guttmacher Institute by the percentage of abortions performed on non-married women as reported in the Centers for Disease Control’s “Abortion Surveillance” report for the same year. The figure on total abortions provided by the Guttmacher data is more complete than the figures provided in the CDC “Abortion Surveillance” reports.
The Guttmacher figures on total abortions are taken from Rachel K. Jones, Marielle Kirsten, and Jesse Philbin, “Abortion Incidence and Service Availability in the United States, 2020,” Perspectives on Sexual Reproduction and Health, Vol. 54, No. 4 (December 2022), pp. 128–141, https://onlinelibrary.wiley.com/doi/epdf/10.1363/psrh.12215 (accessed April 24, 2023).
For the percentage of abortions performed on non-married women, see Katherine Kortsmit, Antoinette T. Nguyen, Michele G. Mandel, Elizabeth Clark, Lisa M. Hollier, Jessica Rodenhizer, and Maura K. Whiteman, “Abortion Surveillance—United States, 2020,” U.S. Department of Health and Human Services, Centers for Disease Control and Prevention, Morbidity and Mortality Weekly Report Surveillance Summaries, Vol. 71, No. l0 (November 25, 2022), https://www.cdc.gov/mmwr/volumes/71/ss/pdfs/ss7110a1-H.pdf (accessed April 24, 2023), and other volumes, available at https://www.cdc.gov/mmwr/indss_2021.html (accessed April 24, 2023).
Non-Marital Abortion Rate
To calculate the non-marital abortion rate, the total number of non-marital abortions was divided by the total number of non-married women aged 15 to 44. The quotient from this was then multiplied by 1,000 to produce X where X = the number of abortions for each 1,000 non-married women aged 15 to 44.
Non-Marital Pregnancy Rate
This number equals the non-marital birth rate plus the non-marital abortion rate. Miscarriages are omitted because of the lack of consistent data. However, because miscarriages as a percentage of pregnancies are relatively constant over time, this omission does not significantly alter the trends reported.


