Central banks … will do wisely to lay aside their inexpert ventures in half-baked monetary theory, meretricious statistical measures of trade and hasty grinding of the axes of speculative interests with their suggestion that by so doing they are achieving some sort of vague “stabilization” that will, in the long run, be for the greater good.
—H. Parker Willis, first Secretary of the Federal Reserve Board, and a principal architect of the Federal Reserve System, 1936
Many economists take for granted that the Federal Reserve has contributed positively to economic stabilization in the U.S. In 1960, for example, economist Arthur Burns noted that the Federal Reserve had fulfilled its promise by helping to “ease the transition from the expanding to the contracting phase of business cycles.”[1] More recently, Harvard professor Martin Feldstein noted that the Fed “[h]as learned from its past mistakes and contributed to the ongoing strength of the American economy.”[2] The conventional wisdom is that the Fed has, in fact, helped to tame business cycles and to reduce volatility in key macroeconomic variables.
A close look at the evidence, though, suggests that this view should be reconsidered. For instance, several studies suggest that data deficiencies cause key pre-Fed-era data series to appear more volatile than their post-World War II counterparts. Despite the conventional view, there is evidence that the Fed has not been as effective as once thought in accomplishing its stabilization goals, and even some evidence that the Fed era has had more economic instability than the pre-Fed era. This Backgrounder highlights these research findings and argues that the apparent postwar stabilization is largely the result of incomplete prewar data.
General Data Problems
Most modern macro-level data, as well as the procedures for compiling the data, did not exist before the Great Depression. The economists who began compiling these data series in the 1920s and the 1930s did the best they could to estimate data from earlier time periods, and they clearly understood that their approximations were rife with potential errors. For the most part, however, their warnings have gone unheeded, as the conventional view that business cycles have been tamed solidified.
Despite this conventional belief, surprisingly few comprehensive academic studies exist that assess the Federal Reserve’s overall performance since its founding in 1913, in part because the Fed’s mission and methods have changed substantially during that time. One such study, published in 2012 by George Selgin, William Lastrapes, and Lawrence White, examines nearly every component of the Fed’s mission. The study includes original empirical research and also provides numerous citations to academic research that more narrowly focuses on key portions of the Fed’s operations.[3] This Backgrounder relies heavily on those citations to highlight the Fed’s impact on business cycles, output, and unemployment.[4]
Another problem with comparing economic performance in the pre– and post–Federal Reserve eras is that three anomalous events occurred soon after the Fed was created in 1913. World War I, the Great Depression, and World War II produced major disruptions to the world’s economies throughout roughly the next 30 years. As a result, many economic studies exclude the interwar years, in order to avoid these somewhat unique economic conditions. Nonetheless, the Federal Reserve did exist during this time period, so several studies also include the interwar years. Whenever possible, this Backgrounder presents data comparisons with and without the interwar period.
Has the Fed Tamed the Business Cycle?
The term “business cycle” describes the pattern of fluctuations—expansions and contractions—in economic activity over time. Periods of expansion are measured from the bottom (trough) of the previous cycle to the top (peak) of the next cycle. Contractionary periods, on the other hand, are measured from peak to trough. The official U.S. business cycle dates are provided by the National Bureau of Economic Research (NBER), a nonprofit research organization consisting mostly of academic economists. These dates, starting with 1854, were first compiled during the Great Depression.
The official dates show that economic expansions have become longer, and also that economic contractions have become both shorter and less frequent in the post-World War II era than before the creation of the Fed. Many economists have attributed this improvement to “better” economic stabilization policies employed in the postwar era, including those implemented by the Federal Reserve. Research published in the late 1980s and early 1990s, however, suggests that such conclusions should be tempered because of problems with the prewar data.[5]
One contribution of this research was to simply remind people that the economists who compiled the NBER dates during the Depression provided us with a major caveat. The 1946 NBER publication Measuring Business Cycles, a highly detailed description of the NBER’s original methodology, states:
This is not to say that the reference dates must remain in their present state of rough approximation. Most of them were originally fixed in something of a hurry; revisions have been confined mainly to large and conspicuous errors, and no revision has been made for several years. Surely, the time is ripe for a thorough review that would take account of extensive new statistical materials, and of the knowledge gained about business cycles and the mechanics of setting reference dates since the present chronology was worked out.[6]
The revisions were never made because NBER economists were diverted from that task in service of World War II-related economic problems.[7] Furthermore, recent research makes it clear that “the NBER reference dates for the cycles before 1927 were chosen long before the modern procedures described in Measuring Business Cycles were established.”[8] In other words, the methods used to date the pre-World War II cycles are different from those used to date the postwar cycles. Statistically, the key problem is that the pre-1927 NBER dates are based on de-trended data while the post-1927 dates are derived using data that include a trend.[9]
Properly accounting for this difference alters the NBER prewar dates and challenges the conventional wisdom that recessions have become shorter in the postwar period. The evidence suggests that the data used to derive the official NBER dates systematically biases the NBER’s pre-World War II cycles so that they appear more severe, in several ways, than they really were. Alternative dates show that many of the “new prewar peaks are several months later than the NBER peaks and many of the new troughs are several months earlier.”[10] The study’s main findings can be summarized as follows:
- The official NBER dates show a dramatic decline in the length of contractions over time. The new dates, though, show that the average length of recessionary periods in the post-World War II period is slightly longer than the average for recessions that occurred prior to World War I.
- The new dates suggest that the average loss of economic output is similar in the post-World War II era relative to the typical loss prior to World War I. However, the length of time it took for the economy to return to its previous peak level was nearly three months shorter in the pre-World War I period.
The new dates confirm that recessions were indeed more frequent in the pre-World War I era relative to the post-World War II time frame. When, instead, the entire Federal Reserve period is compared to the full pre-Fed period, the frequency of recessions did not decrease. Still, even when the interwar period is excluded, the new dates suggest that economic contractions were shorter and recoveries were faster in the pre-Fed era than previously believed.[11] The study’s author concluded:
Thus, the changes in recessions revealed by the new chronology do not show an obvious improvement in business cycles over time. Although the time separating contractions has become longer between the pre–World War I and postwar eras, recessions themselves have not on average become shorter, less severe, or less persistent over time.[12]
One possible caveat is that these results are related to data starting in 1884, thus leaving out a large portion of the post–Civil War period. Other published research, however, has addressed the full post–Civil War time frame and is largely consistent with the earlier results. The updated work finds no discernible difference between either the frequency or average duration of contractions before World War I versus after World War II.[13]
In fact, the newer research suggests that the NBER should reclassify four recessionary periods during the late 19th century as growth periods.[14] More generally, this study reports shorter recessionary periods between the Civil War and World War I. For example, the NBER dates show a recession lasting from October 1873 to May 1879, by far the longest recession in the nation’s history. The newer research, however, suggests the 1873 recession lasted only two years.
Volatility in Unemployment and Output
Another way of assessing stabilization policies is to examine the volatility in specific macroeconomic aggregates, such as unemployment and output. For instance, these policies can be evaluated on the basis of whether variability in gross national product (one measure of total output, commonly referred to as GNP) has declined, regardless of the official NBER business cycle dates. Evaluating single-data series in this manner is complicated by the fact that the underlying trend in the data is difficult to isolate from short-term variation.
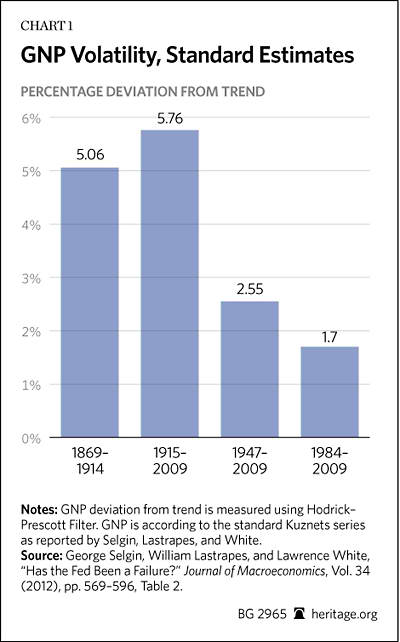
One widely used method for dealing with this issue is to measure variations in the data from the Hodrick–Prescott filter trend, a technique designed to better estimate the “true” trend in the data.[15] Using this method, the standard historical GNP series, known as the Kuznets series, shows somewhat more volatility in the Federal Reserve era than in the pre-Fed era. The percentage standard deviation of GNP from its Hodrick–Prescott filter trend is 5.06 from 1869 to 1914, and it increased to 5.76 between 1915 and 2009.[16] (See Chart 1.) However, the same statistical technique reveals that GNP volatility declined to 2.55 percent in the post-World War II era, a dramatic decline from the pre-Fed period.[17]
Given the economic turmoil caused by the two world wars, many economists argue that the interwar period should be ignored. Consequently, the post-World War II figure is typically used as evidence that stabilization policies—both monetary and fiscal—have reduced economic volatility.[18] Published research suggests, however, that even this claim should be re-evaluated because the standard pre-World War I estimates of output and employment overstate the volatility of the prewar economy. In general, this research shows that the apparent decline in postwar volatility (in both output and employment) is “a figment of the data.”[19] In fact, the prewar economy can look more than twice as volatile as the economy after World War II simply because of data problems.
Alternative Aggregates
During the 1920s and 1930s, economists estimated pre-World War I aggregates, such as for GNP and unemployment, but they were forced to approximate these figures without using the surveys and data-processing techniques employed now. Simon Kuznets and William Shaw compiled prewar GNP data, Edwin Frickey estimated prewar industrial output figures, and Stanley Lebergott approximated various labor statistics for the early 1900s. Although many researchers use these prewar data sets as if they were consistent with their postwar counterparts, newer studies have shown that doing so is unwise because the methods used to construct these prewar data series accentuate cyclical movements.[20]
Gross National Product, Alternate Estimates. The standard prewar GNP series is the Kuznets series, published in 1961. Another widely used prewar series derives nearly all of its cyclical movements from the Kuznets series.[21] The chief problem with the Kuznets series is that it derives prewar GNP (for 1869 to 1919) by relying on disaggregated commodity output data. Kuznets assumed that the percentage deviation of GNP from its trend in any given sector of the economy was equal to the percentage deviation from trend-in-commodity output for a corresponding sector.[22] As time progressed, it became possible to better evaluate this assumption.
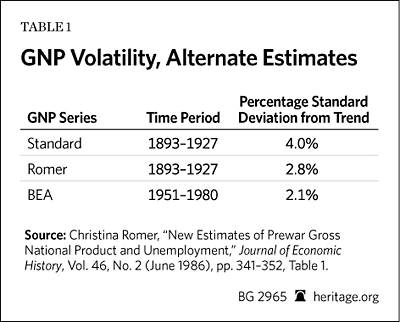
Subsequent research has shown that correcting this issue results in new prewar GNP estimates that are only slightly more volatile than the official postwar series. For instance, the original Kuznets GNP series shows a standard deviation from trend of 4 percent for 1893 to 1927. This figure is roughly twice as volatile as the 2.1 percent variation in the U.S. Commerce Department’s official GNP series from 1951 to 1980. (See Table 1.) The estimates that adjust to account for the data bias, on the other hand, exhibit only a 2.8 percent standard deviation in GNP from trend between 1893 and 1927. Including the interwar period in these comparisons shows a post–Federal Reserve economy that is much more volatile (5.7 percent variation from trend) than it was in the pre-Fed period.[23]
It is true that the data also shows less overall volatility beginning in the mid-1980s. In fact, the period from Fed Chairman Paul Volcker’s second term through the Greenspan-led Federal Reserve is typically referred to as “the great moderation.”
From 1984 to 2009, for instance, the official GNP series exhibited a standard deviation from trend of approximately 1.7 percent.[24] Throughout this period, average inflation also declined to lower single digits, a welcome change from the high inflation of the 1970s. Many economists have credited the results of this era to the supposed improvement of the Fed’s monetary policies.[25] Another view gives most of the credit for the moderation to a decline in the number or magnitude of negative economic shocks as well as financial innovation and other changes.[26]
Unemployment Rates, Alternate Estimates. The standard prewar unemployment series, published in its completed form in 1964, is the data set constructed by Stanley Lebergott.[27] Lebergott essentially estimated the prewar labor force and employment figures first, and then approximated the unemployment rate as a residual. There are several sources of excess volatility in these estimates, such as the reliance on disaggregated employment data for various sectors and types of workers. Lebergott also relied on the assumption that deviations from trend in employment were perfectly correlated with deviations from trend in output, an assumption that (is now known) does not hold in the postwar data.
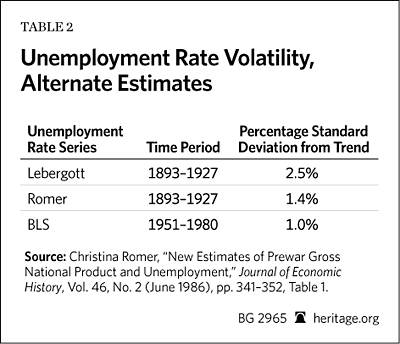
Research shows that correcting some of these issues results in unemployment rate estimates that are much less volatile than the original data set indicates. For instance, the original Lebergott series shows a standard deviation from trend of 2.5 percent for 1893 to 1927. (See Table 2.) The estimates that adjust to account for the data bias, however, exhibit only a 1.4 percent standard deviation from trend between 1893 and 1927.[28] The corrected figure is only moderately more volatile than the 1 percent variation from trend in the U.S. Bureau of Labor Statistics’ official unemployment rate series from 1951 to 1980.[29]
Industrial Production, Alternate Estimates. The main pre-war industrial production series, another measure of economic output, was compiled by Edwin Frickey for 1860 to 1914. Similar to standard prewar GNP data, the Frickey series suggests that economic volatility has greatly declined in the postwar period. However, the Frickey series appears to accentuate volatility because of data deficiencies, a problem inherent in several prewar aggregates.
One specific problem is that the Frickey series is based on a relatively small sample of commodities compared to the Federal Reserve’s official (postwar) industrial production series.[30] Many studies have used the Frickey series as if it were the prewar version of the Fed’s industrial production series, but research shows that these data sets are too different to combine in this manner. However, an “apples to apples” comparison of prewar to postwar periods that uses a consistent data series “[d]oes not reveal the dramatic damping of business cycle fluctuations apparent in the inconsistent series.”[31]
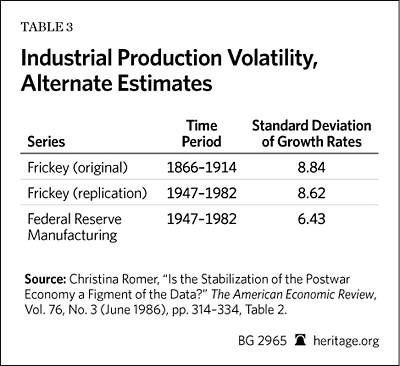
Without making any adjustments for the data deficiencies, the standard Frickey series suggests that output volatility fell from 8.84 percent between 1866 and 1914 to 6.43 percent between 1947 and 1982. (See Table 3.) On the other hand, a replication of the Frickey series in the postwar period shows that the standard deviation of output growth rates fell from 8.84 percent between 1866 and 1914 to only 8.62 percent between 1947 and 1982. The study concludes:
[A] substantial amount of the apparent stabilization of the postwar index of industrial production is due to improvements in the data. Depending on which series and measure are used, somewhere between half and all of the observed stabilization is the result of comparing inconsistent data.[32]
Thus, deficiencies in several prewar aggregates have contributed to the perception that the economy was much more volatile before the founding of the Federal Reserve than during the post-World War II era. In addition to any of the sophisticated techniques that adjust the original prewar output and employment data, several basic time series metrics suggest that “the common belief that the cycle has become more protracted over time is simply not borne out by either the old or the new prewar estimates of GNP and unemployment.”[33] Put differently, this line of research “challenge[s] the common belief that cycles in the forty years before the Great Depression were decidedly more severe than those in postwar era.”[34]
Conclusion
Most of the macroeconomic data series commonly used today did not exist when the Federal Reserve was founded. While early estimates of these pre-Fed aggregates have been used unquestioningly for decades, scholarly work has shown that prewar aggregate data should be used with caution, and adjusted if possible. In particular, the methods used to construct many prewar data series accentuated cyclical movements, thus making the pre-Depression economy look at least twice as volatile as the post-World War II economy. There is solid evidence that the Fed has not been as effective as once thought in stabilizing business cycles.
Some evidence even suggests that, thanks mostly to the Great Depression, the Federal Reserve era has had more economic instability than the pre-Fed era. In fact, this evidence indicates that the average length of recessions in the post-World War II era is slightly longer than the average length prior to World War I. The research also indicates that the time it took for the economy to recover from recessions was slightly shorter in the pre-Fed era. At the very least, these issues deserve a thorough examination, preferably in the context of a congressional commission, such as recommended in the Centennial Monetary Commission Act of 2013 (H. R. 1176 and S. 1895) proposed by Representative Kevin Brady (R–TX) and Senator John Cornyn (R–TX).
—Norbert J. Michel, PhD, is a Research Fellow in Financial Regulations in the Thomas A. Roe Institute for Economic Policy Studies, of the Institute for Economic Freedom and Opportunity, at The Heritage Foundation.


