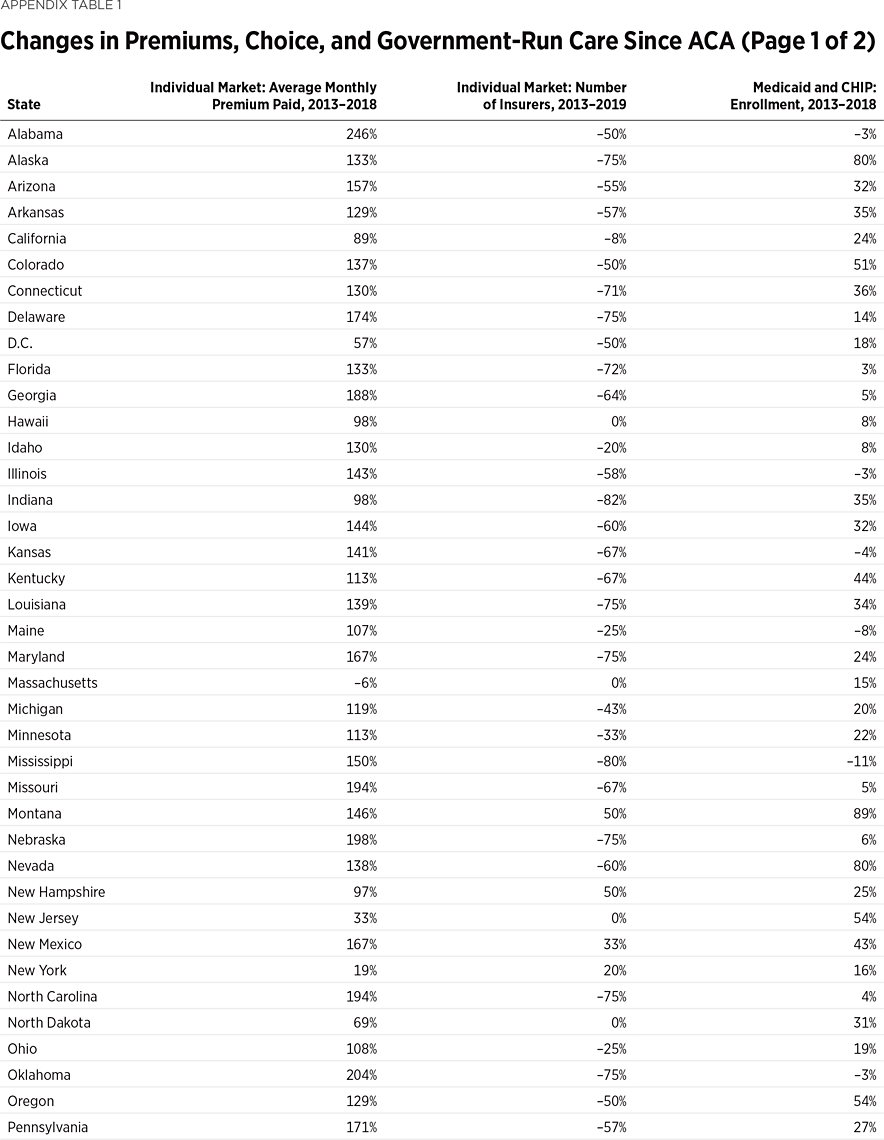
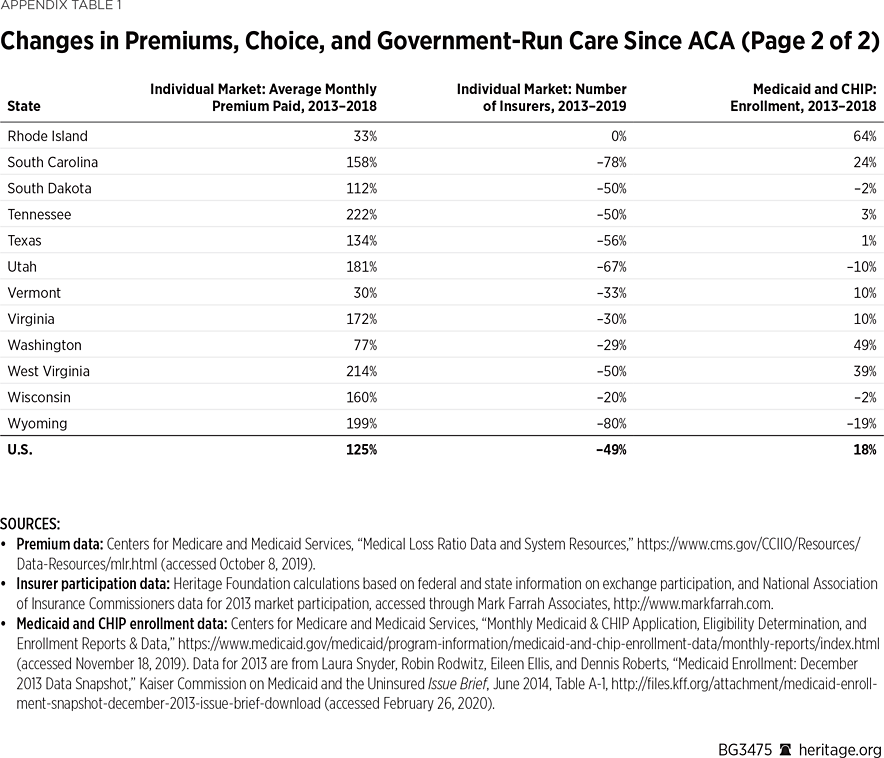
2020 marks 10 years since the passage of the Affordable Care Act (ACA)—also known as Obamacare—and six years since its key elements took effect. In that time, health insurance premiums spiked, coverage options fell, and more Americans became dependent on government-run health care. This Backgrounder examines the changes in these three areas—premiums, choice, and government-run care—and outlines ways that Congress can reverse this trend. (For a summary of changes in all three metrics, see Appendix Table 1.)
Rising Health Insurance Premiums and Deductibles in the Individual Market
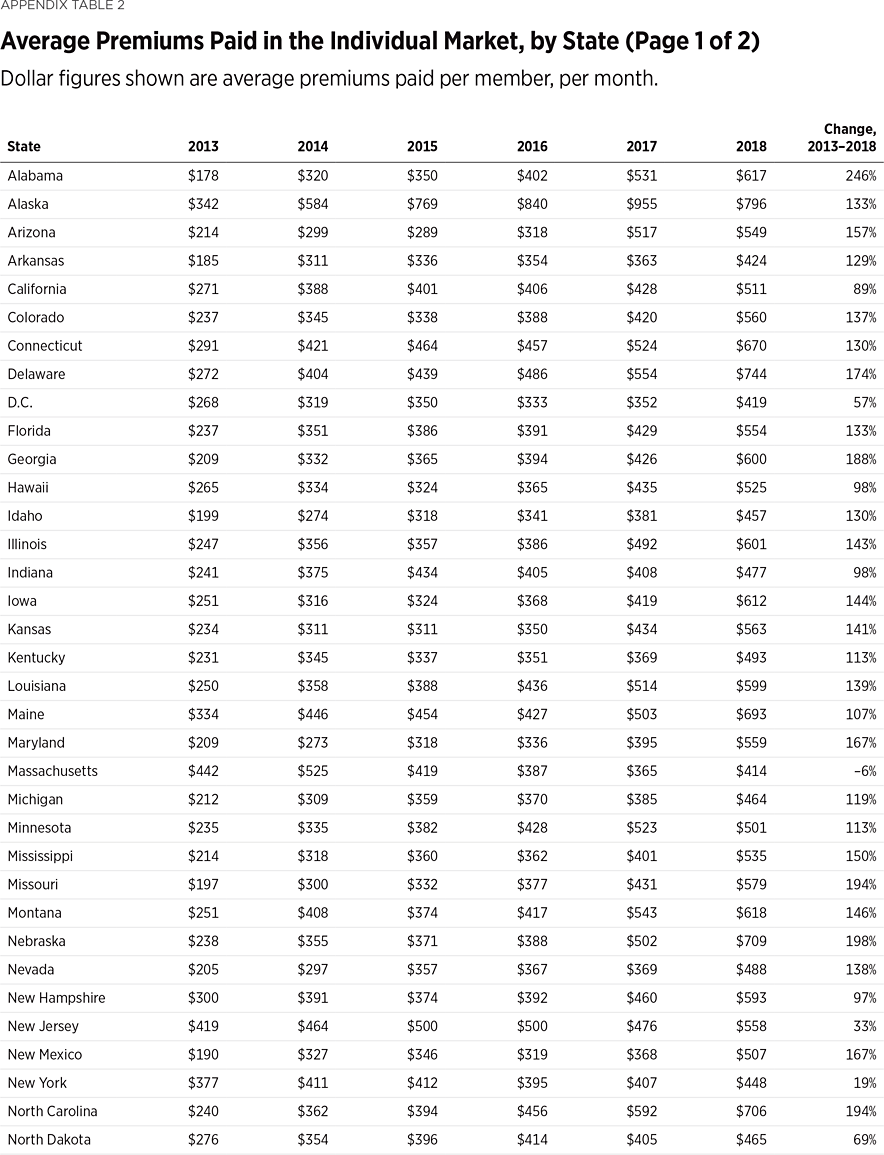
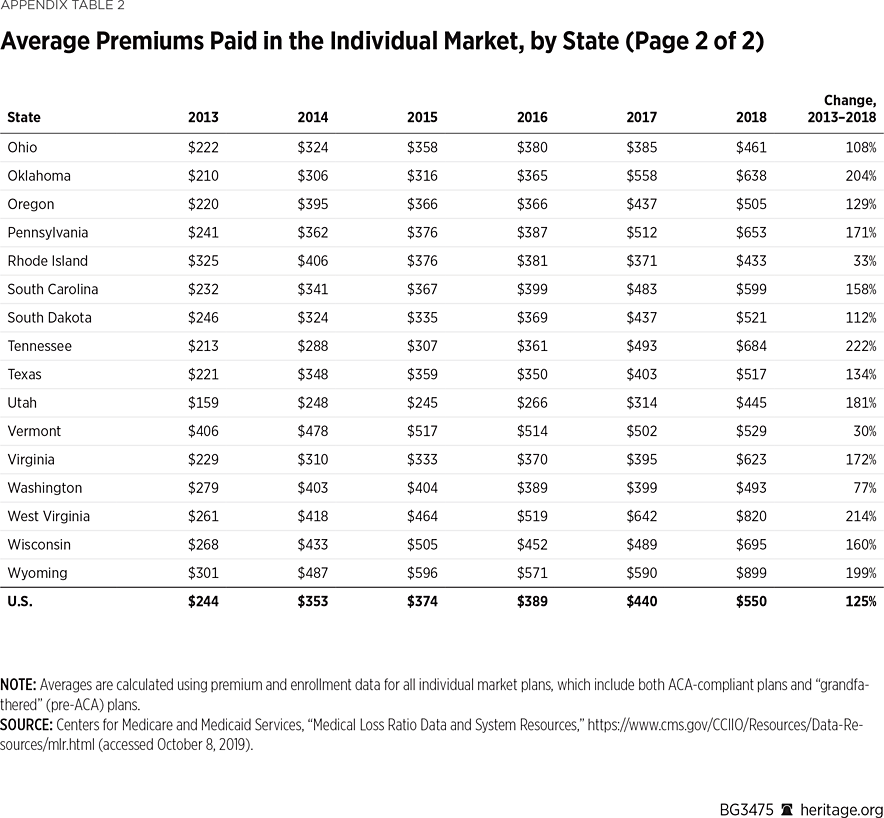
Comparing premium changes in the individual market before and after the ACA is a key measure of the law’s financial effect on consumers. In 2013, the national average premium paid in the individual (non-group) market was $244 (per member, per month).REF In 2018, the national average premium paid in the individual market was $550 (per member, per month). This is a 125 percent increase from 2013 to 2018.REF Over the same period in the large employer market, national average premiums paid per member, per month grew by only 24.7 percent (from $363 to $453).REF
The premium increases varied by state. (See Appendix Table 2.) In nearly every state, consumers on average paid higher premiums under the ACA. States with the largest increase over this period are Alabama (+246 percent), Tennessee (+222 percent), West Virginia (+214 percent), Oklahoma (+204 percent), and Wyoming (+199 percent). States with the smallest increase over this period are New York (+19 percent), Vermont (+30 percent), Rhode Island (+33 percent), and New Jersey (+33 percent). Only one state, Massachusetts, saw a decline (–6 percent) in average premiums paid over this period.REF
The sharpest increase in premiums in the individual market occurred in 2014, the first year that new ACA rules took effect. In the following year, 2015, 10 states had declines in the average premium paid by consumers, though in nine of those states the declines were modest.REF In subsequent years, 15 additional states also saw at least one year of decline. In most cases the declines were short lived. In 19 of the 25 states that experienced any year-over-year reduction in average premiums paid since 2014, the decline was for only one year.REF
At the same time that premiums more than doubled in the individual market, deductibles for ACA-compliant coverage also significantly increased.REF Deductibles for bronze-level plans sold on the federal exchange increased from an average of $5,089 in 2014 to an average of $6,165 in 2019—an increase of 21.2 percent.REF States with the greatest deductible increases were West Virginia (+59.5 percent), Indiana (+56.3 percent), Wyoming (+44.3 percent), North Carolina (+39.0 percent), and Wisconsin (+33.5 percent). States with the smallest deductible increases were Delaware (+1.5 percent), Alaska (+5.2 percent), and New Hampshire (+6.6 percent). Only three states—Illinois, Kansas, and Oklahoma—saw declines in average bronze deductibles (–5.3 percent, –0.5 percent and –1.8 percent, respectively).REF
Fewer Choices and Less Competition in the ACA Exchanges
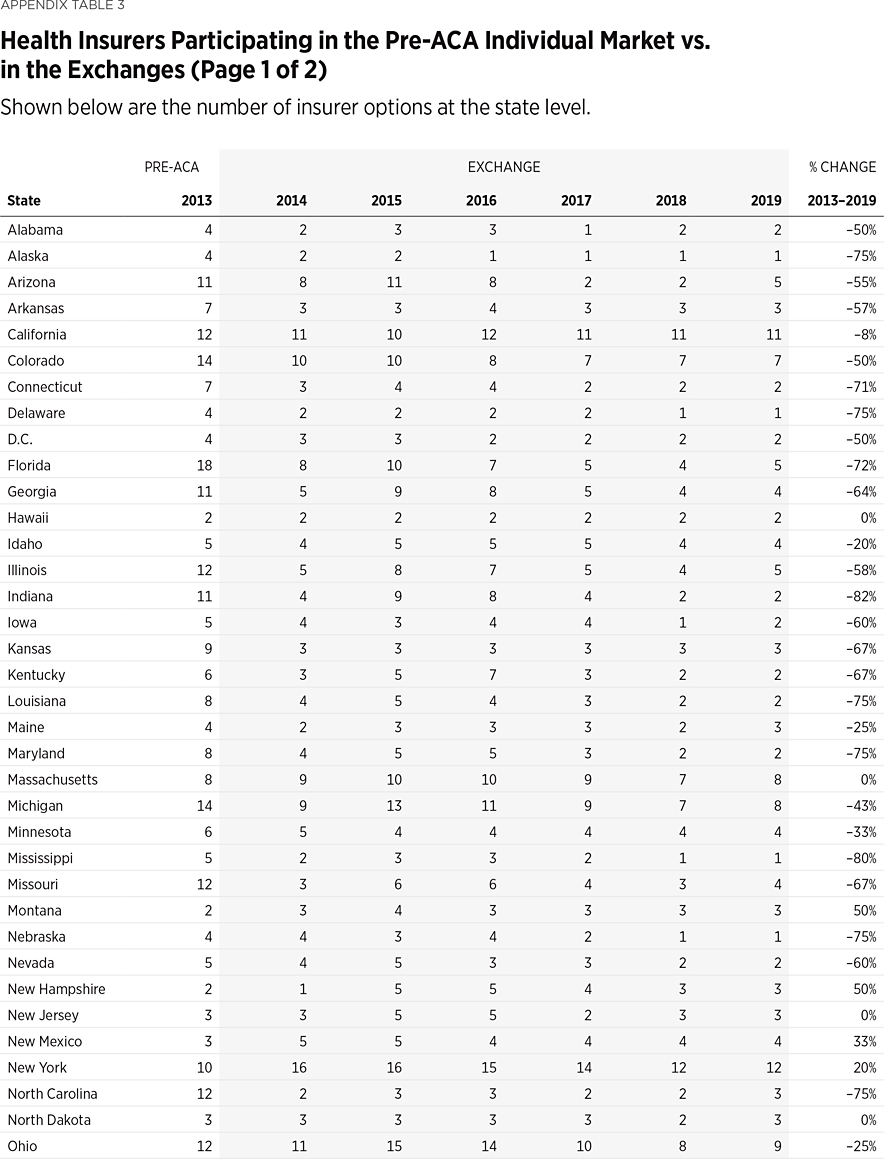
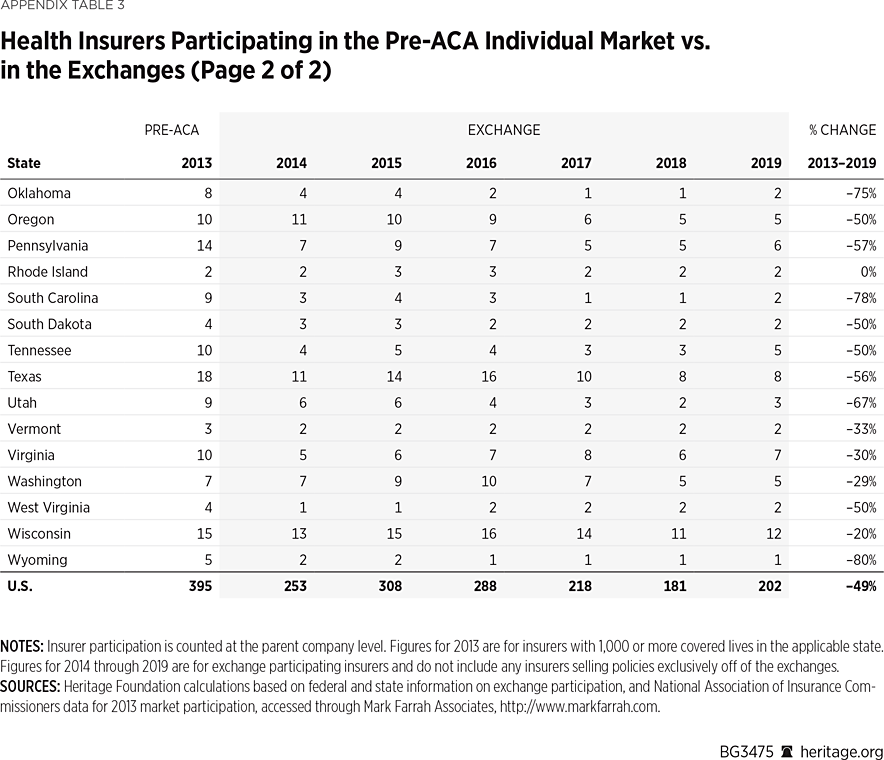
As consumers paid higher premiums, fewer insurers offered plans on the ACA exchanges. In 2019, half as many insurers offered plans through the ACA exchanges as offered plans in the pre-ACA individual market (when measuring insurers offering coverage at the state level).REF In 2013, there were 395 insurers offering coverage in the individual market at the state level. In 2019, there are only 202 insurers offering coverage available through the ACA exchanges at the state level, a 49 percent decrease.
Appendix Table 3 displays the percentage change in insurer competition in the 2013 individual market and the 2019 ACA exchanges, by state. In 2013, there was no state that had fewer than two insurers offering coverage, and two states (Florida and Texas) had 18 insurers offering coverage.
By 2019, five states (Alaska, Delaware, Mississippi, Nebraska, and Wyoming) each had only one insurer on the ACA exchange, and 16 states had only two insurers. It is also worth noting that 38 states and the District of Columbia have not had an increase in the number of insurers participating since 2013.
Greater Dependence on Government Coverage
Not only did the ACA increase the cost of private coverage and reduce its availability, it also significantly expanded government-run coverage through Medicaid. Historically, Medicaid provided health care coverage to the vulnerable poor: children, pregnant women, the elderly, and people with disabilities. The ACA, however, expanded the scope of eligibility to include lower-income able-bodied adults, predominantly those without dependent children. Furthermore, the ACA offered states a much higher level of federal financing for this new population (100 percent in the first three years, eventually declining to 90 percent over subsequent years) than for their existing Medicaid populations.REF
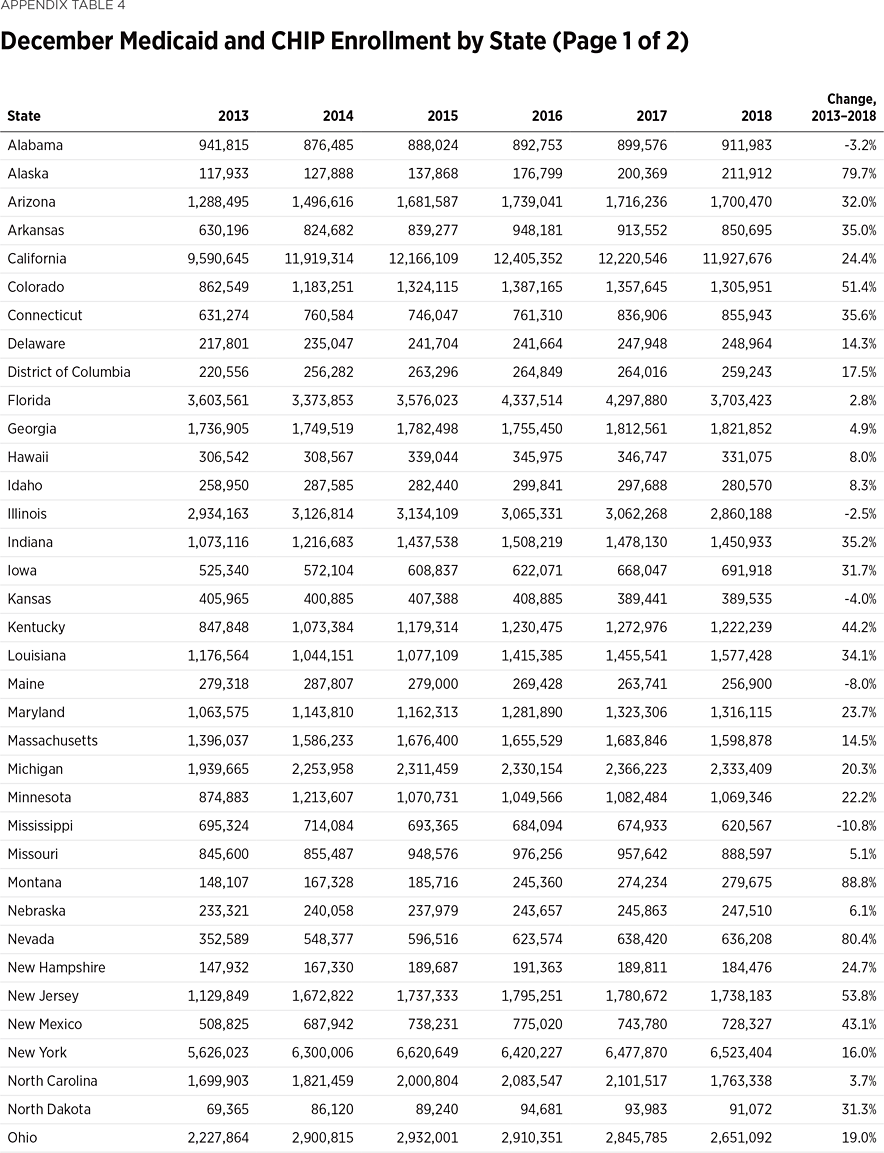
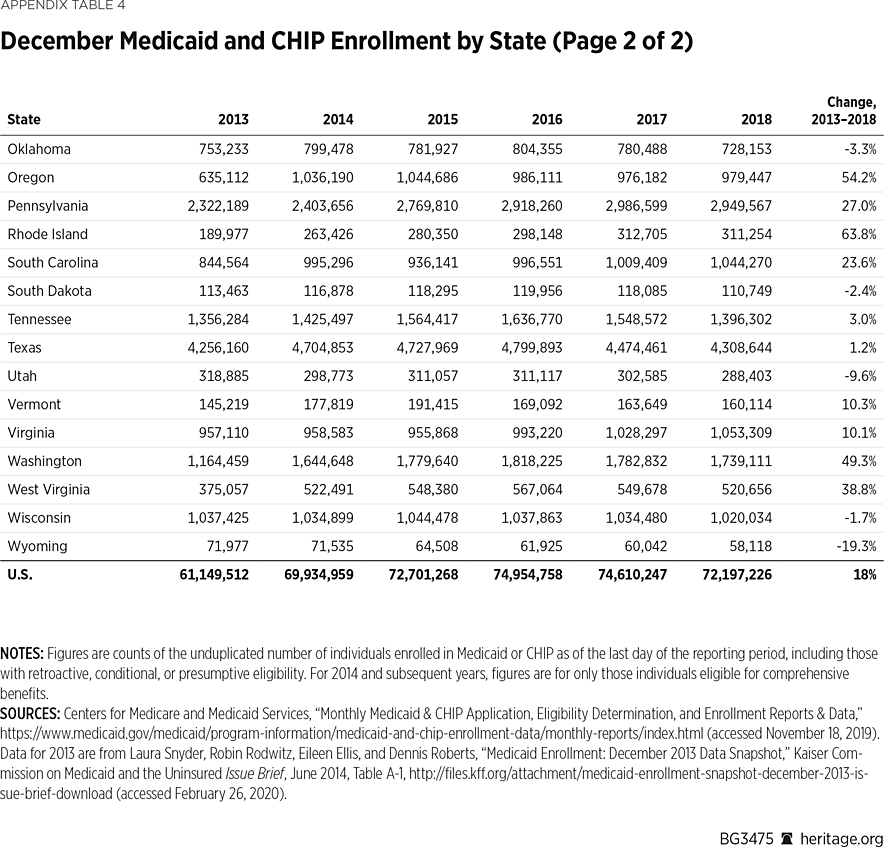
Since 2014, when the ACA took full effect, Medicaid and Children’s Health Insurance Program (CHIP) enrollment has increased by 11 million.REF In December 2013, national Medicaid and CHIP enrollment was 61.1 million. By December 2018, 72.2 million people were enrolled in Medicaid and CHIP—an increase of 18 percent.REF Medicaid and CHIP enrollment reached its highest level to date in the first half of 2017, during which monthly enrollment fluctuated just above and below 75 million.
The enrollment increases varied by state. (See Appendix Table 4.) Most states saw an increase in Medicaid and CHIP enrollment during this period. States with the greatest percentage increase in enrollment over this period were Montana (+88.8 percent), Nevada (+80.4 percent), Alaska (+79.7 percent), Rhode Island (+63.8 percent), and Oregon (+54.2 percent). Texas had the smallest percentage increase in enrollment (+1.2 percent) over the five years, while ten states had Medicaid and CHIP enrollment that was lower at the end of 2018 than it was at the end of 2013.REF
States that expanded Medicaid had the greatest enrollment growth. Between December 2013 and December 2018, the 32 expansion states (including the District of Columbia) saw a 25.9 percent collective net increase in Medicaid and CHIP enrollment, with 19 expansion states experiencing enrollment growth of at least 25 percent.REF By contrast, the 19 non-expansion states saw a collective net increase of 2.4 percent, ranging from a decrease of 19.3 percent in Wyoming to an increase of 23.6 percent in South Carolina.REF
Expansion states saw the greatest Medicaid enrollment growth in the first 12 months to 24 months after initial expansion implementation, followed by a leveling off of enrollment. For example, states that expanded Medicaid on January 1, 2014, had an average enrollment increase of 26.6 percent from December 2013 to December 2014. The following year, the same states had only a 4.5 percent average increase in enrollment. States that expanded before December 2018 had an average increase of 31.9 percent between the last December before expansion and the second December after expansion. These 24-month increases ranged from 6.8 percent (Illinois) to 69.2 percent (Nevada). From December 2013 to December 2018, overall enrollment increases in expansion states ranged from 8.0 percent in Hawaii to 88.8 percent in Montana.REF
Health Care Choices: A Plan to Lower Premiums, Increase Choice, and Protect the Vulnerable
The ACA led to higher premiums, fewer choices, and greater government dependence. To reverse these consequences, policymakers need to provide relief from the ACA mandates that contributed to the problem. As a start, the Trump Administration provided new flexibilities to mitigate some of these issues. A critical step included changes to the law’s Section 1332 waivers, which allow states to seek waivers from certain federal ACA requirements.REF The results, thus far, are encouraging.REF
Seven states had 1332 waivers in effect by 2019, and five additional states were approved to implement waivers in 2020.REF In the initial seven states, first-year premium reductions (relative to projected rates) ranged from 6 percent (Oregon) to 43.4 percent (Maryland) with an average reduction of 19.9 percent across the seven states.REF All five states with waivers taking effect in 2020 projected similar premium reductions.REF
Given the proven relief that waivers provide from high premiums, policymakers in other states should consider similar waivers.
However, more needs to be done. Congress should build on the Trump Administration’s regulatory changes and provide additional relief from the ACA’s burdensome and costly regulations.
One such approach, the Health Care Choices Proposal, would do just that. Under the proposal, Congress would eliminate key regulations that led to increased costs and reduced the ability of private companies to offer products people want to buy. It also would change another key aspect of Obamacare that led to higher costs and reduced choices: the current ACA subsidy structure that gives taxpayer dollars to insurance companies and increases those subsidies as insurance companies raise premiums.REF Instead, states would receive that funding in the form of grants to help the low-income and those with pre-existing conditions access coverage. Finally, unlike Obamacare (which put most subsidized individuals on Medicaid), subsidized individuals would be able to apply their subsidy dollars toward private coverage of their choice.REF
The Center for Health and Economy estimated that the Health Care Choices Proposal would lower premiums by as much as 32 percent, increase private coverage, and keep overall coverage numbers steady.REF
Conclusion
Since taking effect, the ACA more than doubled premiums in the individual market, while cutting the number of participating insurers in half. It also led to a significant increase in the number of people dependent on government-run health care. To reverse these trends, Congress should build on promising improvements made possible by the Trump Administration’s deregulatory agenda, and consider the Health Care Choices Proposal, which would lower costs, increase choices, and protect the vulnerable.
Edmund F. Haislmaier is the Preston A. Wells, Jr. Senior Research Fellow in Domestic Policy Studies, of the Institute for Family, Community, and Opportunity, at The Heritage Foundation. Meridian Baldacci is former Research Assistant in Domestic Policy Studies.