The Index of Dependence on Government measures the growth in spending on dependence-creating programs that supplant the role of civil society. Dependence on government in the U.S. rose again in 2011, the year of the most recently available data, and which is principally assessed by this report. A solid majority of Americans polled by Rasmussen believe that government dependence is too high. In a September 2013 poll, 67 percent of adults nationwide said that too many Americans are dependent on the government.[1]
Virtually no issue so dominates the current public policy debate as the future financial health of the United States. Americans are haunted by the specter of growing mountains of debt that sap the economic and social vitality of the country. The enormous growth in debt is largely driven by dependence-creating government programs. Only the painfully slow labor market recovery garners more attention, and many are beginning to believe that even that sluggishness is tied to the nation’s growing burden of publicly held debt.[2] Carmen M. Reinhart and Kenneth S. Rogoff of Harvard University created a unique data set of countries’ financial crises covering eight centuries. Reinhart and Rogoff conclude that a unifying problem among the financial crises they analyzed is government debt.[3] They coined the phrase “this-time-is-different syndrome,” that is, the “belief that financial crises are things that happen to other people in other countries at other times; crises do not happen to us, here and now. We are doing things better, we are smarter, we have learned from past mistakes.”[4] This syndrome is often displayed despite indicators of a forthcoming financial crisis being apparent to all. The U.S. federal government has accumulated a debt of staggering proportions. While the Congressional Budget Office (CBO) estimates strongly suggest that the federal government’s spending pattern is unsustainable,[5] Congress has done little to avert a foreseeable financial crisis.
Of course, the roots of the problems produced by the great and growing debt lie in the spending behaviors of the federal government. Annual deficits far greater than the government’s revenue are fueling explosive levels of debt. One such significant area of rapid growth is in those programs that create economic and social dependence on government.
The 2013 publication of the Index of Dependence on Government marks the 11th year that The Heritage Foundation has flashed warning lights about Americans’ growing dependence on government programs. When discussing dependence, one must make a careful distinction between different kinds of dependence. According to Yuval Levin, the editor of National Affairs:
We are all dependent on others. The question is whether we are dependent on people we know, and they on us—in ways that foster family and community, build habits of restraint and dignity, and instill in us responsibility and a sense of obligation—or we are dependent on distant, neutral, universal systems of benefits that help provide for our material wants without connecting us to any local and immediate nexus of care and obligation. It is not dependence per se, which is a universal fact of human life, but dependence without mutual obligation, that corrupts the soul.[6]
This Index is designed to measure the pace at which federal government services and programs have grown in areas once considered to be the responsibility of civil society. Civil society is the space between the individual and the state where individuals, families, communities, neighborhood groups, religious institutions, and other institutions of civil society preside. America is increasingly moving away from a nation of self-reliant individuals, where civil society flourishes, toward a nation of individuals less inclined to practicing self-reliance and personal responsibility. Government programs not only crowd out civil society, but too frequently trap individuals and families in long-term dependence, leaving them incapable of escaping their condition for generations to come. Rebuilding civil society can rescue these individuals from the government dependence trap.
The Index uses data drawn from a carefully selected set of federally funded programs that were chosen for their propensity to duplicate or replace assistance—shelter, food, monetary aid, health care, education, or employment training—that was traditionally provided to people in need by local organizations and families. Thus, government dependence does not include traditional government services that provide public goods, such as defense, police protection, and transportation infrastructure. In contrast to public goods, dependence on government for basic tasks that individuals were traditionally expected to perform themselves, or were provided on a voluntary basis to those in need through the civil society, runs the risk of generating political pressure from interest groups—such as health care organizations, nonprofit organizations, and the aid recipients themselves—to expand and cement federal support. Readers should be aware that the increasing dependence on government is not limited to the lower class. The Social Security and Medicare entitlements, and other programs, such as government-backed higher education loans, provide services to the middle and upper classes.
For more than a decade, the Index has signaled troubling and rapid increases in the growth of dependence-creating federal programs, as measured by the amount of spending devoted to them, and every year Heritage has raised concerns about the challenges that rapidly growing dependence poses to this country’s republican form of government, its economy, and the broader civil society. Index measurements begin in 1962; since then, the Index score has grown by more than 20 times its original amount. This means that, keeping inflation neutral in the calculations, more than 20 times the resources were committed to paying for people who depend on government in 2011 than in 1962. In 2011 alone, the Index of Dependence on Government grew by 3.3 percent. This rise in government dependence occurred despite the modest economic recovery. The Index variables that grew the most from 2010 to 2011 were:
- Education: 40.4 percent
- Retirement: 3.1 percent
The Index has now grown by 80.1 percent since 2001. One of the most worrying trends in the Index is the coinciding growth in the non-taxpaying public. The percentage of the population who do not pay federal income taxes, and who are not claimed as dependents by someone who does pay them, jumped from 15 percent in 1984 to 48.5 percent in 2010. However, the portion of the population who did not pay federal income taxes dropped to 44.7 percent in 2011. The recent decrease is likely due to expiring tax credits that were temporarily authorized by the American Recovery and Reinvestment Act of 2009, and the start of the economic recovery. This means that in 1984, 35.3 million paid no taxes; in 2011, 139.3 million paid nothing.[7]
It is the conjunction of these two trends—higher spending on dependence-creating programs, and a long-term trend in an increased portion of the population who do not pay for these programs—that concerns those interested in the fate of the American form of government. Americans have always expressed concern about becoming dependent on government, even while understanding that life’s challenges cause most people, at one time or another, to depend on some form of aid from someone else. Americans’ concern stems partly from deeply held views that life’s blessings are more readily obtained by independent people, and that growing dependence on government erodes the spirit of personal and mutual responsibility created through family and civil society institutions. These views help explain the broad public support for welfare reform in the 1990s.
This ethic of self-reliance combined with a commitment to the brotherly care of those in need appears threatened in a much greater way today than when the Index first appeared in 2002. This year, 2013, marks another year that the Index contains significant retirements by baby boomers. By 2040, 93.8 million people will be collecting Social Security checks and drawing Medicare benefits.[8] Many retirees will also be relying on long-term care in assisted living facilities or home health care providers under Medicaid. No event will financially challenge these programs over the next two decades more than this shift into retirement of the largest generation in American history.
Some may argue that any measure of government dependence should not cover Social Security, because beneficiaries previously paid payroll taxes into the program before receiving benefits. However, the Index is designed to measure the amount of federal spending on programs that assume the responsibilities of individuals, families, communities, neighborhood groups, religious institutions, and other civil society institutions. Clearly, Social Security has greatly encroached on the responsibility of individuals for providing their own retirement resources.
It is not only financial tests that these programs will face. Certainly, financial challenges will be great over the next several decades, given that none of these “entitlement” programs can easily meet its obligations even now. Doubling the number of people in retirement will constitute a massive growth of the U.S. population that is largely dependent on government programs, and a potentially ruinous drain on federal finances. Even accounting for the increased productivity of current and future workers, the rapid increase in retirees coincides with historically fewer workers supporting those in retirement. Perhaps the most important aspect of the boomer retirement is its dramatic reminder of the rapidly growing dependence on government in the United States.
While the major contributors to the nation’s debt crisis are health and income support entitlement programs, such as Medicare and Social Security, Congress spends hundreds of billions of dollars on discretionary social programs each year. These social programs are intended to address a whole host of social problems, including low academic skills, poverty, sex outside marriage, out-of-wedlock births, unemployability and low wages, bad parenting, and relationship troubles within and outside marriage. Things that once were the subject of personal responsibility are now under the federal government’s jurisdiction. When rigorously evaluated, federal social programs have been found to be overwhelmingly ineffective.[9]
There has been such a rapid growth in dependence in recent years that the twin concerns—how much damage this growth has done to the republican form of government and how harmful it has been to the country’s financial situation—have deepened significantly. Not only has the federal government effectively taken over half of the U.S. economy and expanded public-sector debt by more than all previous governments combined, it also oversaw a third year, in 2011, of enormous expansion in total government debt at the federal level. Much of that growth in new debt can be traced to programs that encourage dependence. Chart 2 illustrates how 69.4 percent of federal spending now goes to dependence-creating programs, up dramatically from 21.2 percent in 1962 and 48.5 percent in 1990.
Many Americans are expressing increasing frustration at this fiscally grim state of affairs. Most Members of recent Congresses have known that the major entitlement programs not only need major repairs, but also that these programs are starting to drive up annual deficits and promise to produce substantial deficits in the near future. Many Americans are especially frustrated by the way Congress ignores or, at best, claims to support, comprehensive budget reform plans. Plans like The Heritage Foundation’s Saving the American Dream[10] and Representative Paul Ryan’s (R–WI) “Roadmap,”[11] offer blueprints for getting federal finances under control, but Congress has not seriously debated these or any other such plans.
This absence of genuine efforts by Congress to manage the federal government’s worsening financial crisis is now worrying a number of international financial organizations, including the International Monetary Fund (IMF). On May 14, 2010, the IMF ranked the U.S. in second place among countries that must reduce their structural deficit (caused in part by spending on dependence-creating programs) or risk financial calamity. The IMF predicted that U.S. public-sector debt would equal 100 percent of its gross domestic product (GDP) by 2015 unless immediate actions were taken to cut the deficits by an amount equal to 12 percent of GDP by 2014. The IMF concluded that Greece needed to cut its deficits by 9 percent of its national output to avoid the risk of financial calamity.
Then, on August 5, 2011, the credit rating company Standard & Poor’s downgraded U.S. sovereign debt from its AAA rating to AA+.[12] This dramatic and highly controversial assessment of the federal government’s financial health followed Moody’s Investors Service’s announcement three days earlier that the prospects for the fiscal health of the central government had turned “negative.”[13] Not to be outdone, on November 28, the third big ratings agency, Fitch, also revised its outlook on U.S. credit from “stable” to “negative” (meaning there was a slightly greater than 50 percent chance that Fitch would downgrade U.S. credit from AAA over the next two years).[14] On February 27, 2013, Fitch again warned that a downgrade could be imminent, stating:
During the course of this year Fitch expects to resolve the Negative Outlook placed on the sovereign ratings of the US in late 2011 after the failure of the Congressional Joint Select Committee on Deficit Reduction. In Fitch’s opinion, further delay in reaching agreement on a credible medium-term deficit reduction plan would imply public debt reaching levels inconsistent with the US retaining its “AAA” status despite its exceptional credit strengths.[15]
The IMF, the rating agencies, and many watchful citizens are right to be concerned about the growing debt and growing dependence. Programs that encourage dependence quickly morph into political assets that policymakers readily embrace. Many voters support politicians or political parties that mandate higher incomes or subsidies for the essentials of life. No matter how well meaning policymakers are when they create such aid programs, these same programs quickly spiral beyond their mission and become severe liabilities.
Many countries have already passed the fiscal tipping point, at which reckless growth in dependence programs produces domestic debt crises. How far along the path to crisis is the United States? Are Americans closing in on a tipping point that endangers the workings of their democracy? Or have Americans already passed that point? Can this republican form of government withstand the political weight of a massively growing population of Americans who receive government benefits and who contribute little or nothing for them? How seriously have these federal programs eroded civil society by eroding once-social obligations, and by crowding out services that used to be provided by families, congregations, and community groups?
To explore these questions, one must measure how much federal programs have grown. The Index of Dependence on Government is an attempt to measure these patterns and provide data to help ascertain the implications of these trends. Specifically, the Index measures the amount of spending on federal programs that perform functions once primarily provided by civil society. Table 1 contains the 2013 Index scores—from 1962 to 2011, with 1980 as the base year. As the table indicates, dependence on government has grown steadily at an alarming rate.
Despite the prevailing view that people were left on their own to solve their problems before the creation of the welfare state, there is a rich history of Americans providing voluntary mutual aid before and during the Progressive Era.[16] Assistance was often provided by private charity, mutual aid societies, and state and local governments.[17]
For example, a considerable share of the Masonic mutual aid involved employment-seeking assistance, short-term housing, and character references.[18] Other organizations, such as the Ancient Order of United Workmen, offered life insurance to members.[19] While the exact numbers are unknown, University of Alabama professor of history David T. Beito estimates that fraternal life insurance societies in 1910 had at least 13 million members.[20] These fraternal societies were characterized by “an autonomous system of lodges, a democratic form of internal government, a ritual, and the provision of mutual aid for members and their families.”[21]
However, the rise of the welfare state, especially during the New Deal and Great Society, assumed much of the social responsibility that was once the province of voluntary associations.[22] In essence, the welfare state “crowded out” or diminished the role of private charities and voluntary associations in benefiting members of society. The year after the Social Security Act of 1935 saw the beginning of benefit retrenchment by fraternal societies and their eventual decline.[23] The decline in mutual aid societies and the growth of federal domestic programs are likely the direct results of the growth of the welfare state.
Complementary research[24] to the Index indicates that federal dependence-creating programs crowd out assistance from civil society institutions, even replacing aid that used to come from family members. While the social science literature on crowd-out has found mixed results, the preponderance of the literature finds at least small crowd-out effects.[25]
Theoretically, crowd-out can occur in two ways. First, charitable donors will treat the taxes they pay to provide government-run welfare services as a substitute for donations to private charities.[26] In other words, the taxes paid to finance welfare programs make individuals less likely to make private donations, because they are already paying for assistance programs. This result has been coined the classic crowd-out effect. Second, private charities will substitute government grants for private donations.[27]
An analysis of the impact of the New Deal on religious charitable activity confirms the presence of the classic crowd-out effect.[28] Based on data from church activity from 1929 to 1939 for six of the largest Christian denominations (representing more than 20 percent of churches) during this period, the authors found “strong evidence that the rise in New Deal spending led to a fall in church charitable activity.”[29] Specifically, the “New Deal crowded out at least 30% of benevolent church spending.”[30]
A more current example of the welfare state crowding out voluntary assistance is the impact that unemployment insurance (UI) has on familial assistance. Familial assistance takes the form of family members helping relatives in times of need. For example, a recently unemployed son may receive financial assistance from his parents to help him get through a difficult period. A study using data from the Panel Study in Income Dynamics (PSID) found a negative association between the receipt of UI benefits and familial support.[31] Specifically, one dollar in UI benefits displaces familial support by $0.24 to $0.40.[32]
Additional studies have found classic crowd-out effects of government welfare spending. A national study that covered 1975 to 1994 found that a 10 percent increase in government aid to the poor is associated with a 5.87 percent decrease in private charitable donations.[33] A similar study covering 1965 to 2003 also found that government welfare spending has a negative association with charitable giving.[34]
Researcher Ralph M. Kramer finds that individual giving as a proportion of personal income fell by 13 percent between 1960 and 1976, while the proportion of philanthropic giving devoted to social welfare dropped 15 percent to 6 percent.[35] By 1974, government was spending about 10 times as much on social services as did nonprofit agencies, and that year the nonprofit agencies themselves received close to half ($23 billion) of their total revenues from government (receiving $25 billion from all other sources combined).[36] Such data also raise traditional concern about the long-term viability of the political institutions in a republic when a significant portion of the population becomes dependent on government for most or all of its income.[37]
Alternatively, when government welfare services contract, charitable giving may increase. This proposition was tested when the Personal Responsibility and Work Opportunity Reconciliation Act of 1996 cut federally funded welfare services to noncitizens. A nationwide analysis of Presbyterian Church congregations from 1994 to 2000 suggests that the reduction in federal welfare services to noncitizens was associated with an increase in charitable giving.[38] Specifically, a one dollar decrease in county-wide per capita welfare spending was associated with an increase of $0.40 in the church congregation’s per-member donations to local community projects.[39]
There is also evidence to support the second type of crowd-out effect of private charities and nonprofits substituting government grants for private donations. A study of more than 8,000 tax returns from American charities found a crowd-out effect of about 76 percent.[40] For example, a government grant of $1,000 to a charity was associated with a decrease in $760 in private donations raised by the charity. However, the study found that most of this decline in private donations is the result of reduced private fundraising efforts by government-funded charities.
This second type of crowd-out increases the influence of government, for better or worse, over government-funded charities. The acceptance of government funding by private charities may cause these entities to become dependent on future government funding. Further, government funding opens charities to government mandates that may run counter to the mission of charities. To avoid such mandates, for example, Catholic Charities in Illinois has closed most of its affiliates in the state rather than comply with a state law requiring it consider same-sex couples as potential foster-care and adoptive parents, contrary to the tenets of its faith, in order to continue receiving state money.[41]
The Fiscal Calamities Created by Growing Dependence
Entitlements. The issue of dependence is particularly salient today, when more and more Americans are increasing their reliance on government as they pass into retirement. Some may argue that any measure of government dependence should not include Social Security, because beneficiaries paid payroll taxes into the program before they received benefits. However, the Index is designed to measure spending on federal government programs that have assumed the responsibilities of individuals, families, communities, neighborhood groups, religious institutions, and other civil society institutions. Workers rationally view Social Security taxes as a substitute for private savings.[42] Clearly, Social Security has greatly encroached on the responsibility of individuals for providing their own retirement funds, thus leaving millions of retirees dependent on younger, working generations to fund their retirement.
Current retirees become eligible for Social Security income, as well as for health care benefits from Medicare or Medicaid, at age 65.[43]Each day, 10,000 baby boomers begin to collect these benefits.[44] The three programs, along with the Children’s Health Insurance Program, currently make up 44 percent of all non-interest federal program spending. At the current growth rate, they will make up 57 percent in 2022.[45] By 2048, Social Security, Medicare, and Medicaid will absorb the entire tax revenue of the United States. Any additional spending would have to be borrowed.[46] All told, these programs will enable the government dependence of nearly 80 million baby boomers.
This phenomenon is particularly troubling because most of the soon-to-be users of these programs are middle-class to upper-class Americans who are less likely to need government support. Since eligibility for these programs is linked to age, not financial need, millionaires collect the same benefits, such as subsidized prescription drugs through Medicare Part D, as do low-income and struggling retirees.
Paying for these middle-class and upper-class entitlements in the coming years will require unprecedented levels of deficit spending. Focusing on Social Security and Medicare alone, Americans face $45.9 trillion in unfunded obligations (read: new borrowing) over the next 75 years. That was more than $160,000 per American citizen in 2010—an unsustainable level of debt that is sure to slow the economy and could force even higher rates of taxation in the future. The high costs of these programs, which will be shouldered by the children and grandchildren of baby boomers, could easily lead to further increases in dependence of future generations—which would be more likely to depend on welfare during a slow economy. This snowballing of dependence—caused by automatic reliance on Social Security, Medicare, and Medicaid—could easily send the country past the tipping point of endurable dependence, eroding civil society and endangering the functioning of democracy itself as citizens become dependent on government, instead of the other way around.
Additionally, the growing cost illustrates the budgetary problem of allowing dependence to expand unchecked. One reason this growth will be so significant is that these programs increase on autopilot, which further perpetuates dependence, since these programs are not subject to regular debate and evaluation. Unlike nearly all other federal outlays, Social Security, Medicare, and Medicaid are mandatory spending programs that operate outside the annual budget process. This exemption entitles these programs to call on all federal revenues first, regardless of other budgetary priorities. Substantive policy reform is required if this automatic dependence is to be halted. Part of the solution is to turn these programs into 30-year budgeted programs, subjecting the budgets to debate at least every five years.
Other policy reforms—that emphasize independence and self-reliance—must also be part of addressing the problems inherent in these and other programs. The concept of a safety net ought to be restored to gear Social Security, Medicare, and Medicaid toward those who truly need these programs. This restoration can be accomplished by relating benefits to retirees’ income and encouraging personal savings during working years.
Even though many Members of Congress and other policymakers show great hesitance in reforming these badly broken programs, good reforms that preserve the basic commitments this country has made to its retired and indigent populations do exist. The Heritage Foundation’s Saving the American Dream[47] plan strengthens the anti-poverty elements of these mandatory programs while protecting them from financial ruin. Doing nothing guarantees that seniors one day will find themselves largely without the benefits that currently play such an important part of their retirement plans.
Growth in the Non-Taxpaying Population. The challenges that Congress faces in reforming these entitlement programs are heightened by the rapid growth of other dependence-creating programs, such as subsidies for food and housing and college financial aid, and by the growing number of Americans who incur no obligations for receiving them. How likely is Congress to reform entitlements in any meaningful way under such circumstances? Can Congress rein in the massive middle-class entitlements in an environment of fast-expanding dependence programs?
In 1962, the first year measured in the Index of Dependence on Government, the percentage of people who did not pay federal income taxes themselves and who were not claimed as dependents by someone who did pay federal income taxes stood at 24.0 percent; it fell to 12.6 percent by 1969 before beginning a ragged and ultimately steady increase. By 2000, the percentage was 34.1 percent; by 2010, it was 48.5 percent.[48]Fortunately, this figure dropped to 44.7 percent in 2011. Despite the recent decline, the country is still at a point where nearly one-half of “taxpayers” do not pay federal income taxes, and where most of that same population receives generous federal benefits. (See Chart 1.) This high percentage of people who do not pay the federal income tax persists despite the nation undergoing an economic recovery since the economic collapse during 2008 and 2009.
This trend should concern everyone who supports America’s republican form of government. If the citizens’ representatives are elected by an increasing percentage of voters who pay no income tax, what will be the long-term consequences when these representatives respond more to demands of non-taxpaying voters who urge more spending on entitlements and subsidies than to the pleas of taxpaying voters who urge greater spending prudence?
Instead of encouraging more virtue, such as self-reliance, personal responsibility, and mutual cooperation, dependence on government encourages citizens who pay little taxes to view government as a source of ever expanding benefits, provided by other citizens who pay taxes, without any mutual obligations. Do Americans want a republic that encourages and validates a growing dependence on the state and a withering of civil society? Rejuvenating civil society can help people escape from dependence on government.
Section 1: The Purpose and Theory of the Index
The 2013 Index of Dependence on Government is divided into four major sections. Section 1 explains the purpose of and theory behind the Index; Section 2 features a methodology that describes how the Index is constructed; Section 3 discusses the Index in terms of the number of Americans who receive money from government programs; and Section 4 reviews major policy changes in five federal program areas.
The Index of Dependence on Government is designed to measure the pace at which federal government services and programs have grown in areas once considered to be the responsibility of individuals, families, communities, neighborhood groups, religious institutions, and other civil society institutions. By compiling and condensing these data into a simple annual score (composed of the scores for the five components in Section 4), the Index provides a useful tool for analyzing dependence on government. Policy analysts and political scientists can also use the Index and the patterns it reveals to develop forecasts of trends and consider how these trends might affect the politics of the federal budget.
The Index uses data drawn from a carefully selected set of federally funded programs. The programs were chosen for their propensity to duplicate or replace assistance, such as shelter, food, monetary aid, health care, education, or employment training, which was traditionally provided to people in need by local organizations and families.
In calculating the Index, the expenditures for these programs are weighted to reflect the relative importance of each service (such as shelter, health care, or food). The degree of a person’s dependence will vary with respect to the need. For example, a homeless person’s first need is generally shelter, followed by nourishment, health care, and income. Analysts in The Heritage Foundation’s Center for Data Analysis weighted the program expenditures based on this hierarchy of needs, which produces a weighted index of expenditures centered on the year 1980.
Historically, individuals and local entities have privately provided more assistance to members of society in need than they do today. Particularly during the 20th century, government gradually offered more and more services that were previously provided by self-help and mutual aid organizations.[49] Lower-cost housing is a good example. Mutual aid, religious, and educational organizations long have aided low-income Americans with limited housing assistance; after World War II, the federal and state governments began providing the bulk of low-cost housing. Today, government provides nearly all housing assistance for the poor and low-income.
Health care is another example of this pattern. Before World War II, Americans of modest income typically obtained health care and health insurance through a range of community institutions, some operated by religious institutions and social clubs. That entire health care infrastructure has since been replaced by publicly provided health insurance, largely through Medicaid and Medicare. Regardless of whether the medical and financial results are better today, the relationship between the people who receive health care assistance and those who pay for it has changed fundamentally. Few would dispute that this change has affected the total cost of health care, and the relationships among patients, doctors, and hospitals, negatively.
Financial help for those in need has also changed profoundly. Local, community-based charitable organizations once provided the majority of aid, resulting in a personal relationship between those who received assistance and those who provided it. Today, Social Security and other government programs provide much or all of the income to low-income and indigent households. Nearly all the financial support that was once provided to temporarily unemployed workers by unions, mutual aid societies, and local charities is now provided by federal income, food, and health programs.
This shift from local, community-based, mutual aid assistance to anonymous government payments has clearly altered the relationship between the receiver and the provider of the assistance. In the past, a person in need depended on help from people and organizations in his or her local community. The community representatives were generally aware of the person’s needs and tailored the assistance to meet those needs within the community’s budgetary constraints. Today, housing and other needs are addressed by government employees to whom the person in need is a complete stranger, and who have few or no ties to the community in which the needy person lives.
Both cases of aid involve a dependent relationship. The difference is that support provided by families, religious institutions , and other civil society groups aims to restore a person to full flourishing and personal responsibility, and, ultimately, perhaps to be able to aid another person in turn. The reciprocal relationship is essential to the existence of civil society itself. This kind of reciprocal expectation does not characterize the dependent relationship with the government. Government aid is usually based on one-sided aid without accountability for a person’s regained responsibility for self and toward his community. Indeed, the “success” of such government programs is frequently measured by the program’s growth rather than by whether it helps recipients to escape dependence. While the dependent relationship with civil society leads to a balance between the interests of the person in need and the community, the dependent relationship with the government is inherently prone to generating political pressure from interest groups—such as health care organizations, nonprofit organizations, and the aid recipients themselves—to expand and cement federal support. Perhaps more troubling is the expansion of means-tested safety-net programs, which have the unintended consequence of reducing the rewards to activities that increase one’s market income.[50] The unintended consequence of means-tested programs is that these welfare benefits penalize actions to improve one’s financial situation through one’s own labors. For example, increased working hours translate into increased income, meaning that means-tested assistance participants face decreased assistance if they earn more. Such a quandary can turn into a poverty trap for an individual weighing the “cost” of earning more income at the expense of means-tested assistance. In addition, the programs of the welfare state are likely to create an intergenerational cycle of dependence.
Welfare assistance causes intergenerational dependence because the welfare system generates a culture of dependence in both recipient parents and their children.[51] First, parental welfare participation may encourage children to accept unneeded welfare assistance later in life.[52] Second, parental welfare participation may decrease the employment prospects of the children through multiple avenues.[53] For instance, the lower attachment to work of many welfare-receiving parents may lead their children to be less aware of proper on-the-job behavior. Additionally, such parents may be less able to teach their children job-search skills and provide contacts with those able to provide employment opportunities. Any combination of these factors can significantly inhibit the ability of children to become economically self-sufficient. Third, parental participation may encourage some children to “learn how to ‘play the system’ at an early age.”[54]
A study using data from the PSID found that 20 percent of girls raised in families that were highly dependent[55] on Aid to Families with Dependent Children (AFDC) when the girls were 13 to 15 years old were themselves highly dependent on AFDC between the ages of 21 and 23.[56] The same was true for only 3 percent of girls from non-AFDC-recipient families. However, the results of this study should be interpreted with caution because the study failed to account for other factors that may contribute to participation in AFDC.
An analysis of intergenerational welfare participation based on the National Longitudinal Survey of Youth (NLSY) from 1979 to 1988 provides stronger evidence for welfare assistance causing intergenerational dependence.[57] After controlling for factors that may influence welfare participation, the study found that “exposure to welfare at home increases later offspring dependency.”[58] Specifically, children raised in families participating in AFDC were almost 4.6 times more likely to participate in AFDC during adulthood, compared to the adulthood participation rates of children raised in families never enrolled in AFDC.[59] A similar study using NLSY data found that women raised in households that received welfare were 1.67 to 2.74 times more likely to be dependent on AFDC in adulthood than their counterparts from non-welfare households.[60]
Other studies that account for factors that may influence welfare participation have confirmed an intergenerational link. According to a study based on a random sample of AFDC female recipients from Tennessee, growing up in a family that participated in AFDC was associated with an increased length of time for these women on AFDC in adulthood.[61] An analysis of welfare assistance in Canada found that a 1 percent increase in parental participation during a child’s pre-adult years (ages seven to 17) was associated with a participation rate increase of 0.29 percent during the child’s early adulthood (ages 18 to 21).[62] Converted to a monthly basis, a one-month increase in prior participation by parents is associated with a three-day increase in participation by their children when age 18 to 21.
The Index of Dependence on Government provides a way to assess the magnitude and implications of the change in government dependence in American society. The Index is based principally on historical data from the President’s fiscal year (FY) 2013 annual budget proposal.[63] The last year measured in the 2013 Index is FY 2011. The Center for Data Analysis (CDA) used a simple weighting scheme and inflation adjustment to restate these publicly available data. CDA analysts encourage replication of their work and will gladly provide the data that support this year’s Index upon request to professionals. The steps to prepare this year’s Index are described in the methodology in Section 2.
Section 2: The Methodology
After identifying the government programs that contribute to dependence, the Center for Data Analysis further examined the data to identify the components that contributed to variability. Relatively small programs that required little funding and short-term programs were excluded. The remaining expenditures were summed up on an annual basis for each of the five major categories listed in Table 2.[64] The program titles are those used by the federal Office of Management and Budget (OMB) for budget function and sub-function in the budget accounting system. For federal spending on higher education, U.S. Department of Education appropriations for higher education loans and grants were used instead of OMB data for fiscal years 1980 to 2011 because the CDA analysts determined them to be more accurate, and less prone to accounting technicalities in recent years.[65]
The CDA analysts collected data for FY 1962 through FY 2011. Deflators centered on 2005 were employed to adjust for inflation.
Indices are intended to provide insight into phenomena that are either so detailed or complicated that simplification through chosen but reasonable rules is required for obtaining useful insights. The Consumer Price Index (CPI) of the Bureau of Labor Statistics, for instance, is a series based on a selected “basket of goods” that the bureau surveys periodically for price changes. The components of this basket are weighted to reflect their relative importance to overall price change. Energy prices are weighted as more important than clothing prices. Multiplying the weight by the price produces a weighted price for each element of the CPI, and the total of the weighted prices produces the rough CPI score.
The Index of Dependence on Government generally works the same way. The raw (unweighted) value for each program (that program’s yearly expenditures) is multiplied by the weight reasonably assigned to it by CDA. The total of the weighted values is the Index score for that year.
The Index is calculated using the following weights:
- Housing: 30 percent
- Health Care and Welfare: 25 percent
- Retirement: 20 percent
- Higher Education: 15 percent
- Rural and Agricultural Services: 10 percent

The same weighting procedure is consistently applied to each annual edition of the Index. The weights are “centered” on the year 1980. This means that the total of the weighted values for the Index components will equal 100 for 1980, and 1980 is the reference year in comparison to which all other Index values can be evaluated as percentages of 100.
The CDA chose the year 1980 due to its apparent significance in American political philosophy. Many analysts view 1980 as a watershed year in U.S. history because it seems to mark the beginning of the decline in left-of-center public policy and the emergence of right-of-center challenges to policies that were based on the belief that social systems fail without the guiding hand of government.[66]

The Index certainly reflects such a watershed. Chart 3 plots the Index from 1962 to 2011. The scores have clearly drifted upward throughout the entire period.
There are two plateaus in the Index—the 1980s and the period from 1995 to 2001—that suggest that policy changes may significantly influence the Index growth rate. During the early 1980s, the growth of some domestic programs was slowed to pay for increased defense spending, and Congress enacted significant policy changes in welfare and public housing during the 1990s. Both of these cutbacks reduced the Index growth rate.
Chart 4 connects the Index to major public policy changes. The largest jump in the Index occurred during the Johnson Administration, following the passage of the Great Society programs. The Johnson Administration not only launched Medicare and other publicly funded health programs, but also vastly expanded the federal role in providing and financing low-income housing. The Index also jumped 90 percent (from 39 to 74) under the Nixon and Ford Administrations, when Republicans were funding and implementing substantial portions of the Great Society programs.
The two periods of relatively less liberal public policy (the 1980s and 1995–2001) stand out clearly in Chart 4. The slowdowns in welfare spending increases during the Reagan years and after the 1994 congressional elections produced two periods of slightly negative change in the Index. These periods saw significant retreats from Great Society methods, particularly in the nation’s approach to welfare, but the return of budget surpluses during the last years of the Clinton Administration led to significant spending increases for all of the components, particularly education and health care. The George W. Bush years saw more leaps in retirement, housing, health, and welfare spending, and since 2009, health care and welfare spending has blasted upward like a rocket. Health care and welfare now stand at four and a third times the 1980 level (inflation-adjusted). With the continuing implementation of Obamacare (the Patient Protection and Affordable Care Act of 2010), the parameters of Chart 4 will most likely have to be expanded again to fit the higher Index number in the years to come.
Section 3: The Five Index Components
CDA analysts began by reviewing the federal budget to identify federal programs and state activities supported by federal appropriations that fit the definition of dependence—providing assistance in areas once considered to be the responsibility of individuals, families, neighborhood groups, religious institutions, and other civil society institutions. The immediate beneficiary of the program or activity must be an individual. This method generally excludes state programs; federally funded programs in which the states act as intermediaries for benefits to individuals are included.
Elementary and secondary education are the principal state-administered programs that are excluded under this stipulation. Post-secondary education is the only part of federal government–funded education included in the Index.[67] Expenditures on the military and federal employees are also excluded. National defense is the primary constitutionally mandated function of the federal government and thus does not promote dependence as measured by the Index. Non-military federal employees are also excluded from the Index based on the fact that these individuals are paid for their labor. In addition, military and federal employees are assumed to possess marketable skills that allow them to find work in the private sector should their federal jobs not exist.
CDA analysts then divided the qualifying programs into five broad components:
- Housing
- (a) Health Care and (b) Welfare
- Retirement
- Higher Education
- Rural and Agricultural Services
The following sections discuss the pace and content of policy changes in these five components.
1) Housing.[68] The Department of Housing and Urban Development (HUD) was created in 1965 by consolidating several independent federal housing agencies into one executive department. The purpose of the consolidation was to elevate the importance of government housing assistance within the constellation of federal spending programs. At that time it was believed that the destructive riots that broke out in many cities in the early 1960s were a consequence of poor housing conditions and that these conditions were contributing to urban decay.
In any given year, about 80 percent of HUD’s budget is aimed at housing assistance, and the other 20 percent is focused on urban issues by way of the Community Development Block Grant (CDBG) program. Given the nature of these programmatic allocations, HUD budgetary and staff resources are concentrated on low-income households to an extent unmatched by any other federal department.
Within the 80 percent of the HUD budget spent on housing assistance are a series of means-tested housing programs, some of which date back to the Great Depression. Typically, these programs provide low-income people, including the elderly and disabled, with apartments at monthly rents scaled to their incomes. The lower the income, the lower the rent. Traditionally, HUD and the local housing agencies have provided eligible low-income households with “project-based” assistance, an apartment unit that is owned and maintained by the government.
Public housing projects have historically been the most common form of such assistance, but they began to fall out of favor in the 1960s due to the rampant decay and deterioration that followed from concentrating low-income families in a single complex or neighborhood. Periodically, new forms of project-based programs are adopted as “reform,” which also tend to fall out of favor after years of disappointing results. HOPE VI[69] is the most recent form of project-based assistance, and high costs and low benefits led the George W. Bush Administration to attempt, unsuccessfully, to terminate the program in 2006. Efforts are now underway by some in the Obama Administration to increase the program’s funding.
HUD also provides “tenant-based” housing assistance to low-income households in the form of rent vouchers and certificates. These certificates help low-income people rent apartments in the private sector by covering a portion of the rent. The lower the person’s or family’s income, the greater the share of rent covered by the voucher or certificate. Vouchers were implemented in the early 1970s as a cost-effective replacement for public housing and other forms of expensive project-based assistance; vouchers still account for only a portion of housing assistance, in part because of housing-industry resistance to terminating the lucrative project-based programs. However, the unintended consequence of the sliding contribution of vouchers based on income means that the assistance operates with the disincentives of marginal tax rates: Voucher participants face decreased housing assistance if they experience income gains. Such a dilemma can turn into a poverty trap for an individual weighing the “cost” of earning more income at the expense of losing housing assistance.
Finally, HUD provides block grants to cities and communities through the CDBG program according to a needs-based formula. Grant money can be spent at a community’s discretion among a series of permissible options. Among the allowable spending options is additional housing assistance, which many communities use to provide assistance to a greater number of low-income households. Although HUD programs are means-tested to determine eligibility, they are not entitlements. As a result, many eligible households do not receive any housing assistance due to funding limitations. In many communities, housing assistance requires waiting periods of several years—and in some cases local housing authorities no longer add new families to the waiting list because there is simply no foreseeable prospect of new applicants receiving an apartment.
Recognizing that HUD housing assistance can create dependence among those who receive its benefits, some Members of Congress have attempted to extend the work requirements of the 1996 Personal Responsibility and Work Opportunity Reconciliation Act (PRWOR) to HUD programs. Self-described advocates for the poor have thwarted these efforts. To date, the most that can be required of a HUD program beneficiary is eight hours per month of volunteer service to the community or housing project in which the beneficiary lives.
After a mid-decade jump reflecting spending to rebuild infrastructure destroyed by Hurricanes Katrina and Rita, the housing component of the Index moderated, but in 2008 it jumped significantly as the federal government added several mortgage-bailout programs to its traditional low-income, housing-assistance focus.
The Federal Housing Finance Agency (FHFA) took over the supervision of operations of Fannie Mae and Freddie Mac on July 24, 2008, as part of the Housing and Economic Recovery Act (HERA). The federal government provides direct financing to the mortgage market through Fannie Mae and Freddie Mac due to HERA. The net loss to the federal government from November 2008 to the end of March 2011 totaled $130 billion ($154 billion minus $24 billion in dividends on the agencies’ respective preferred stock). Moreover, any agency debt issued by Fannie Mae and Freddie Mac is not considered official government debt, and, therefore, is not included in the accounting of federal publicly held debt.

The change in agency status is important since Fannie Mae and Freddie Mac directly hold purchased mortgages and issue mortgage-backed securities (MBS). Their role in the single-family residential mortgage market is substantial. Fannie Mae and Freddie Mac guarantee approximately half of outstanding U.S. mortgages,[70] and they finance more than 70 percent of all single-family residential mortgages.[71]
In the past two years, under the Obama Administration, there have been incremental steps to extend help to homeowners. The Administration established two broad programs to help U.S. homeowners through the Making Home Affordable (MHA) initiative[72]—the Home Affordable Modification Program (HAMP) and the Home Affordable Refinancing Program (HARP).[73]
These programs go beyond extending federal government support to low-income Americans. The HAMP program uses Troubled Asset Relief Program (TARP) funds to reduce the burden of mortgage-related debt service from homeowners at risk of foreclosure. These are targeted homeowners that took a sub-prime or alternative high-risk mortgage, and are paying more than 31 percent of their household income on their primary mortgage.[74] HARP, however, extends federal support in housing to many moderate-income and upper-middle-income households[75] by allowing eligible homeowners to refinance their mortgage at historically low interest rates and to change their term structure on loans. All mortgages refinanced under HARP are either owned or underwritten by Fannie Mae or Freddie Mac.
2(a) Health Care.[76]Increasing spending and enrollment in public health care programs, and particularly Medicare, Medicaid, and the Children’s Health Insurance Program (CHIP), is leading to greater dependence on government. In 2011, total combined enrollment in these three programs was nearly 109 million individuals—approximately 32 percent of the entire U.S. population.[77] The three programs accounted for $999 billion, or 6.6 percent of GDP.[78] According to the Centers for Medicare and Medicaid Services (CMS), by 2021, government spending on health care will represent nearly 50 percent of total national health expenditures.[79]
In its 2011 annual report on health insurance coverage, the U.S. Census Bureau published figures that underscore the current trend toward greater dependence on government health programs.[80]The percentage of Americans enrolled in government health programs is rising faster than ever, in part due to a struggling economy, Medicaid and CHIP expansions, and a rapidly growing elderly population transitioning into Medicare. The consequence is greater dependence on taxpayer-subsidized coverage.
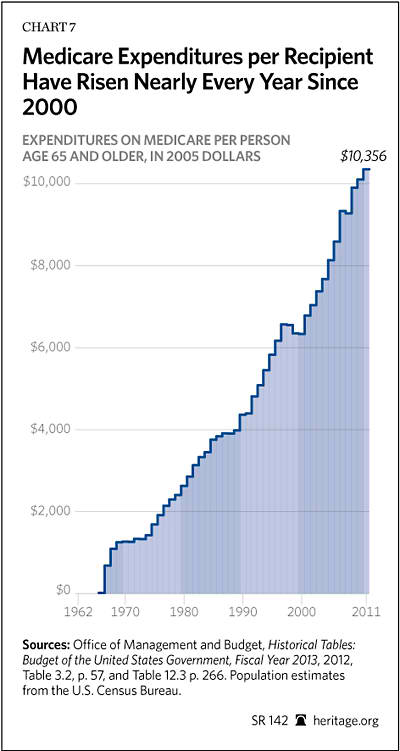
Medicare. Congress established Medicare in 1965 through Title XVIII of the Social Security Act. Medicare pays for health care for individuals ages 65 and above, and for those with certain disabilities. Medicare enrollment has steadily increased since its enactment due to increases in both population and individual life expectancy. In 1970, 20.4 million individuals were enrolled in Medicare.[81] By 2011, the number of enrollees had more than doubled to 48.7 million.[82]In 2011, the first of 81.5 million baby boomers became eligible for Medicare, leading to an expected dramatic increase in enrollment over the next 10 years.[83]
The heavily taxpayer-subsidized Medicare coverage increases overall demand for health care and places upward pressure on health care pricing. Medicare fee-for-service is the primary source of coverage for beneficiaries. However, traditional Medicare’s fee-for-service structure adds to rising costs by rewarding providers for higher volumes of services. Moreover, gaps in coverage lead 90 percent of enrollees to carry supplemental plans, such as employer-provided retiree coverage, Medigap plans, or Medicaid.[84] By design, supplemental policies shield seniors from the financial effects of their health care decisions.
Growing enrollment and rising spending are quickly leading Medicare to become an unsustainable program. Under current law, the program faces $26.9 trillion in long-term unfunded obligations; under an alternative, more plausible, scenario, the estimate reaches $36.9 trillion over the long term.[85] Medicare Part A is already running yearly deficits, and according to the Trustees, the Hospital Insurance Trust Fund will become insolvent in 2024. Between 1985 and 2011, gross federal spending for Medicare rose from 1.7 percent of GDP to 3.7 percent, and under the CBO’s extended alternative fiscal scenario, gross federal spending on Medicare will reach 6.7 percent of GDP by 2037.[86]
The last decade has seen a significant expansion of benefits provided by Medicare, including the addition of a prescription drug benefit (Medicare Part D). From 2004 to 2011, Part D was responsible for $337.9 billion in spending.[87] Though the role of competition in its defined-contribution financing model has caused its costs during this period to be 48 percent lower than initial CMS projections, the program has added substantially to health care entitlement spending.[88] Additionally, the publicly funded Part D program has crowded out private coverage alternatives. Research suggests that before Medicare Part D was enacted, 75 percent of seniors currently receiving public coverage held private drug coverage. Part D also increased average spending on prescription drugs by seniors, an expense that is funded by an increase in public spending of 184 percent, accompanied by a reduction in seniors’ out-of-pocket spending of 39 percent and private insurance plan spending of 37 percent.[89]
Medicaid and CHIP. Medicaid, the joint federal–state health care program for specific categories of the poor, was also established in 1965, through Title XIX of the Social Security Act. In 2011, 56.1 million Americans were enrolled in Medicaid, an increase of 2.2 million individuals in just one year, and 21.6 million since 2000.[90] Medicaid serves a diverse population of the poor, including children, mothers, the elderly, and the disabled. Combined, the total national cost of Medicaid and CHIP in 2011 is estimated at $441 billion, and is projected to rise to $963 billion by 2021.[91]
The generous, open-ended federal reimbursement that states receive for Medicaid spending encourages many states to grow the program beyond what could be expected if state taxpayers funded the full cost. The structure of the Medicaid program varies from state to state because states determine their own eligibility and benefit levels after meeting a minimum federal standard. States have used this flexibility to expand eligibility and benefit packages. Indeed, past research has shown that a majority of Medicaid expenditures are for optional services or groups.[92]
Incremental Medicaid expansions and the addition of CHIP[93]have increased the number of individuals eligible for government health programs. CHIP has led many working families who would otherwise enroll their children in private coverage to opt for public coverage. The CBO concluded that private coverage crowd-out from CHIP expansions ranges from 25 percent to 50 percent.[94] In 2011, 5.7 million children were enrolled in CHIP—an increase of 300,000 children from the year before, and 3.7 million from 2000.[95]
Impact of Obamacare. The Patient Protection and Affordable Care Act (PPACA), enacted in 2010, relies on a massive expansion in Medicaid and the creation of a new income-related subsidy to purchase insurance through government-controlled insurance exchanges.
The most recent CBO estimate projects that, by 2022, 25 million individuals will receive subsidized coverage in the new exchanges.[96]CMS originally estimated that over 20 million additional Americans would be enrolled in Medicaid and CHIP by 2019 due to the PPACA.[97] However, the CBO has an updated estimate that reflects the recent June 2012 Supreme Court decision, which made the Medicaid expansion optional for states, causing a smaller amount of additional Medicaid enrollees—11 million in 2022.
These new provisions are projected to cost the federal government nearly $1.7 trillion between 2012 and 2022. To reduce the impact on the federal deficit, the PPACA depends on a variety of offsetting provisions, including an estimated $716 billion from Medicare.[98] Thus, instead of extending Medicare’s solvency, these reductions were used to fund the new spending provisions. Moreover, both the CMS Actuary and the CBO warn that much of these Medicare spending reductions are unlikely to materialize due to the effects they will have on health care providers’ profitability, and subsequently, seniors’ access to care.[99]
Conclusion. The growing dependence on government health programs, the result of recently enacted legislation, and other factors will have a direct negative impact on federal and state taxpayers. Spending on Medicare and Medicaid, two of the largest entitlement programs, is on track to well surpass current levels. By 2021, Medicare spending is expected to surpass $1 trillion, and total spending (federal and state) for Medicaid and CHIP will reach $963 billion, with exchange spending totaling $136 billion, at which point government spending will represent nearly half of all health care expenditures.[100]
2(b) Welfare.[101]The 1996 Welfare Reform Act (PRWORA) replaced the decades-long Aid to Families with Dependent Children (AFDC)—which entitled recipients to unconditional benefits—with the Temporary Assistance for Needy Families (TANF) program. Enacted during the Great Depression, AFDC, an old cash-welfare program, was intended to provide financial assistance to children in need. Over the decades, the program swelled and added adults, such as unemployed parents of enrolled children. Welfare rolls peaked in 1994, reaching more than 5 million cases—14.2 million individual recipients. Before welfare reform, one child in seven received AFDC.
An open-ended assistance program, AFDC granted states more money as their welfare rolls continued to increase. At the individual level, AFDC handed out benefits without any expectations from the recipients, who were entitled to cash aid as long as they fell below the need standards set by the states. The entitlement created perverse incentives—discouraging work among able-bodied adults and discouraging marriage.
Welfare reform effectively altered the fundamental premise of receiving public aid and ended it as an entitlement. Receiving assistance became temporary and tied to demonstrable efforts by able-bodied adult recipients to find work or take part in work-related activities. Self-sufficiency became the goal. The successes of welfare reform are undeniable. Between August 1996 and December 2011, welfare caseloads declined by 59.1 percent—from 4.4 million families to 1.8 million families. The legislation also reduced child poverty by 1.6 million children.[102]
The initial years after welfare reform brought significant progress. By the late 1990s, most states had met the PRWORA’s work goals, and motivation to reduce dependence and encourage work among recipients even more began to wane. The national TANF caseload has flatlined in the past few years, and the percentage of TANF families with work-eligible adults who worked at least 30 hours per week (20 hours for those with young children) never rose above the 38.3 percent attained in 1999, and has hovered near 30 percent in recent years.
In February 2006, after four years of debate, Congress reauthorized TANF under the Deficit Reduction Act. The new legislation reiterated the need to engage recipients in acceptable work activities and promote self-sufficiency. Once again, states were required to increase work participation and to reduce their welfare caseloads, using the lower 2005 caseload levels as the new baseline—which essentially restarted the 1996 reform. As required by Congress, the Department of Health and Human Services also issued new regulations to strengthen work-participation standards.
The 2006 TANF reauthorization also contained a notable measure that began to rectify the inattention to the other two 1996 welfare reform goals: reducing unwed childbearing and restoring stable family formation.[103] The erosion of marriage and family is a primary contributing factor to child poverty and welfare dependence, and it figures significantly in a host of social problems. A child born outside marriage is nearly six times more likely to be poor than a child raised by married parents, and more than 80 percent of long-term child poverty occurs in single-parent homes. Moreover, unwed parents and the absence of fathers in the home negatively affects a child’s development, educational achievement, and psychological well-being, as well as increases children’s propensity toward delinquency and substance abuse.[104]
For the past four decades, the unwed birth rate in America has been rising steadily, from 5.3 percent in 1960 to 40.7 percent in 2011.[105] Among blacks, 72.3 percent of children born in 2011 were to unmarried parents; among Hispanics, the percentage was 53.3 percent.[106] The percentage among whites was 29.0 percent.[107] Although the pace of growth in the proportions of births to unmarried women slowed in the immediate years after welfare reform, more recently, it has risen rapidly. From 2002 to 2009, the share of non-marital births increased by one-fifth—34.0 percent to 41.0 percent.[108] Since then, the share of non-marital births appears to have leveled off at 40.8 percent and 40.7 percent in 2010 and 2011, respectively.[109]
In 2011, 1.6 million children were born to unmarried parents.[110] Contrary to popular belief, the typical single mother is not a teenager, but in her twenties. Whereas in 1970 one-half of all out-of-wedlock births were to teens, in 2011 births to girls younger than 18 years of age comprised only 5.9 percent of such births.[111] Almost 61 percent of out-of-wedlock births are to women in their twenties.[112]About 49 percent are high-school dropouts, and 34 percent are high-school graduates. Fourteen percent have had some college education; only 2 percent have a college degree.[113] Tragically, the Obama Administration seems bent on derailing the successful 1996 welfare reforms. In July 2012, the Administration’s Department of Health and Human Services announced that it would allow states to waive the work requirement, the heart of the reform law. The Administration’s policy threatens the success of the law in helping those in need attain self-sufficiency.
Welfare reform should be restored. Additionally, comprehensive welfare reform of the federal government’s many other welfare programs is needed. Today’s welfare system is a convoluted machinery of 80 programs, 13 federal departments, and a voluminous collection of state agencies and programs. Overall, the welfare system amounts to over $900 billion in spending per year.[114]
Since President Lyndon Johnson declared the War on Poverty in 1964, the federal government has spent approximately $20 trillion on means-tested welfare aid. Today, means-tested assistance is the fastest-growing part of government, with the nation spending more on welfare than on national defense. Under the Obama Administration, welfare spending has increased dramatically. For example, since FY 2008, spending on the Supplemental Nutrition Assistance Program (SNAP), formerly the Food Stamp program, more than doubled from $37.6 billion to $78.4 billion for FY 2012.[115] The tremendous growth in the SNAP budget means that more and more Americans are dependent on the program. In 1969, 1.4 percent of the population or about 2.9 million people participated in the program.[116] By 2008, the participation rate increased to 9.3 percent of the population with 28.2 million individuals receiving benefits. In 2011, 44.7 million people (14.3 percent of the population) participated in the program. (See Chart 12.) The figure for FY 2012 is 14.8 percent—meaning that one of every 6.7 people in the nation is participating in the program. Over the next 10 years, total welfare spending is expected to cost taxpayers $12.7 trillion. The Obama Administration has worked rapidly to expand the welfare state further.[117]Such growth is clearly unsustainable.
The 1996 Welfare Reform Act was the first phase of meaningful welfare reform. The work requirements in this law must be restored and strengthened. The next phase of welfare reform should focus on the following: First, since means-tested welfare spending goes to more than 80 federal programs, Congress should require the President’s annual budget to detail current and future aggregate federal means-tested spending. The budget should also provide estimates of state contributions to federal welfare programs. Second, continuing reform should rein in the explosive growth in spending. When the unemployment rate returns to the historically normal level of approximately 5 percent, aggregate welfare funding should be capped at pre-recession (FY 2007) levels plus inflation. Third, building on the successful 1996 model, further reform should continue to promote personal responsibility by encouraging work. For example, SNAP, one of the largest means-tested programs, should be restructured to require able-bodied adult recipients to work or prepare to work, in order to be eligible for food stamps.[118]
3) Retirement.[119]Since the time of President Franklin D. Roosevelt, the American retirement system has been described as a three-legged stool consisting of Social Security, employment-based pensions, and personal retirement savings. The reality is quite different. Almost half of American workers (about 78 million) are employed by companies that do not offer any type of pension or retirement savings plan. This proportion of employer-based retirement savings coverage has remained roughly stable for many years, and experience has shown that few workers can save enough for retirement without such a payroll-deduction savings plan. For workers without a pension plan, the reality of their retirement consists almost entirely of Social Security.
Since 1935, Social Security has provided a significant proportion of most Americans’ retirement incomes. The program pays a monthly check to retired workers, and monthly benefits to surviving spouses and children under the age of 18.[120] Monthly benefits are based on the indexed average of a worker’s monthly income over a 35-year period, with lower-income workers receiving proportionately higher payments and higher-income workers receiving proportionately less. The lowest-income workers receive about 70 percent of their pre-retirement income; average-income workers receive 40 percent to 45 percent; and upper-income workers average about 23 percent.
However, the demographic forces that once made Social Security affordable have reversed, and the program is on an inexorable course toward fiscal crisis. To break even, Social Security needs at least 2.9 workers to pay taxes for each retiree who receives benefits. The current ratio is 3.3 workers per retiree and dropping because the baby boomers produced fewer children than their parents did and have begun to reach retirement. The ratio will reach 2.9 workers per retiree around 2015 and drop to two workers per retiree in the 2030s.
Current retiree benefits are paid from the payroll taxes collected from today’s workers. Social Security has not collected enough taxes to pay for all its promised benefits since 2010. Both the Social Security Administration and the CBO say that these deficits are permanent.
Between 1983 and 2009, workers paid more in payroll taxes than the Social Security program needed in order to pay benefits. These additional taxes were supposed to be retained to help finance retirement benefits for baby boomers. But the government did not save or invest the excess taxes for the future. Instead, the government used the money to finance other government programs. In return for the diverted revenue, Social Security’s trust fund received special-issue U.S. Treasury bonds. Now that Social Security has begun to spend the interest that is accumulating on those Treasury bonds and will soon begin to redeem them, the federal government will be required to raise the money through higher taxes or massive borrowing.
Social Security’s uncertain future is a problem for all workers, and especially for roughly half the American workforce that has no other retirement program. Few of these Americans have any significant savings, and unless the situation improves, they will depend heavily on the government for their retirement incomes.
This dependence is largely the result of government policies. By soaking up money that should have been invested for the future, Social Security’s high tax rate makes it much harder for lower-income and moderate-income workers to accumulate any substantial savings. Workers logically view Social Security taxes as a substitute for private savings—the problem is that the government is spending, rather than saving that money, and the complexity of the program, along with its long-term fiscal insolvency, prevents workers from knowing precisely what they will receive in return for their Social Security taxes.[121]
Additionally, Social Security reduces private savings by relieving people of the responsibility for factors such as securing assets to last into very old age or to pay for medical treatments not covered by insurance. If Social Security did not provide a guaranteed lifetime benefit, people would have to increase their private savings to provide for a longer retirement. And, the Supplemental Security Insurance (SSI) component of Social Security, which provides additional income and medical benefits to individuals who run out of private savings, discourages lower-income workers from saving money that could prevent them from receiving additional government assistance.[122]
Complex government regulations also discourage the expansion of occupational pensions to cover a higher proportion of the workforce. Over the past few decades, the costs of traditional pension plans have skyrocketed, and thousands of them have shut down. Efforts to develop innovative hybrid pension plans stalled when confusing laws and regulations resulted in lawsuits.
4) Higher Education.[123]Federal post-secondary education spending continues to grow at a rapid pace. During the 2011–2012 school year, total federal spending on student aid programs (including tax credits and deductions, grants, and loans) was approximately $236.7 billion—making total federal aid 218 percent higher than for the 2001–2002 school year (total inflation-adjusted federal aid totaled $108.6 billion that year).[124] In the 2010–2011 school year, federal grant aid increased to $50.3 billion, a 2.7 percent increase over the previous year (Pell Grants: $34.5 billion; other federal grants: $14.8 billion; Work Study: $1 billion).[125] Between 2000 and 2011, inflation-adjusted Pell Grant funding grew 191 percent.[126] Notably, federal intervention into the student lending market has also continued to grow. The U.S. Department of Education notes that “as of July 1, 2010, all Subsidized and Unsubsidized Stafford Loans, PLUS, and Consolidation Loans are originated in the Direct Loan (DL) program.”[127]
The data in Chart 11 is limited to spending expressed in 2005 dollars, so tax credits, deductions, and loan liabilities are not included. As the chart shows, higher education spending steadily increased since 1962. Higher education increased from $1.8 billion in 1962 to $40.9 billion in 2011—an increase of a staggering 2,172 percent.
Over the past decade, growing federal higher-education subsidies have increased the number and percentage of post-secondary students who depend on government aid. In the 2011–2012 school year, 9.4 million students received Pell Grant scholarships—more than double the number of students who received Pell Grants in the 2001–2002 school year.[128]The maximum Pell Grant award rose to $5,550 during the 2011–2012 school year.[129] Moreover, during the 2007–2008 school year (the most recent data available), 47 percent of students received federal student aid (including both grants and loans).[130] Federal borrowing through the Stafford loan program grew to 10.4 million loans from just 5.4 million loans during the 2001–2002 school year, a 95 percent increase.[131]
Both federal spending and students’ dependence on government are likely to continue to rise in 2013. In seeking to make the United States the country with “the highest proportion of college graduates in the world by 2020,” President Obama has pushed for significant increases in federal subsidies.[132] The President’s 2013 budget request increases funding for federal grants, loans, and work-study programs to $165 billion—a 69 percent increase since 2008.[133]Moreover, “the administration’s budget would provide a record $36.1 billion in Pell Grants to nearly 10 million students during the 2013–2014 award year.”[134]

Increases in federal student aid subsidies over the years have done nothing to mitigate ever-rising college costs. Tuition and fees at private and public four-year institutions rose by 13 percent and 27 percent, respectively, after adjusting for inflation, from the 2007–2008 academic year to the 2012–2013 academic year.[135] In the decade from 2002 to 2012, tuition and fees rose by an average annual rate of 5.2 percent at public universities.[136]Since 1982, the cost of college tuition and fees has increased by 439 percent—more than four times the rate of inflation.[137]
Decades-long increases in federal subsidies for college have led to increases in college tuition and fees because universities know that more aid makes students less sensitive to rising college costs. Economist Richard Vedder argues that “some of these [federal] financial aid programs have contributed mightily to the explosion in tuition and fees in modern times.”[138] Vedder also notes that it “is not clear that higher education has major positive spillover effects that justify government subsidies in the first place, and the private loan market that can handle anything from automobile loans to billion-dollar government bond sales can handle financial assistance to students if necessary.”[139]
Instead of continuing to expand the government’s role in student lending, federal subsidies should be limited to those students with the greatest financial need. Limiting the number of years that students are able to receive federal subsidies would also likely begin to tackle the college cost problem.[140]
5) Rural and Agricultural Services.[141] Government dependence in the rural and agriculture sector is largely driven by farm subsidies. Direct payments are designed to supplement farm income; production quotas inflate crop prices; and premium subsidies offset the cost of crop insurance. The government also pays farmers to adopt conservation methods, and provides export subsidies that enable them to undercut commodity prices overseas.[142]
Supporters of farm subsidies often characterize farmers as particularly vulnerable to both natural and economic forces. But risk exists in all types of commercial endeavors, and there are a host of nongovernmental methods with which farmers themselves can manage risk, including crop diversification, credit reserves, and private insurance.
In fact, American farmers are doing quite well. Net farm income hit a record $117.9 billion in 2011, and is forecast by the U.S. Department of Agriculture (USDA) to reach $128.2 billion in 2013—the highest level on record in four decades.[143] Chart 12 shows that average farm-household income began to eclipse the average of all U.S. households in 1996, and remains so (despite the fact that most farm-household income is derived from off-farm sources).[144]
Meanwhile, the top five earnings years during the past three decades have all occurred since 2004.[145] The debt-to-asset ratio[146] for 2012 is pegged at just 10.3 percent,[147] meaning that debt is only about one-tenth of total assets—the strongest position in some 40 years, due largely to rising land values.[148] Farm subsidies are higher now than in the early 1990s, when farm-household income and that of the rest of America were roughly equal.
Farm subsidies, commodity quotas, and tariffs largely enrich upper-income producers of grains, oilseeds, cotton, milk, and sugar, and ignore most other commodities. Nearly 80 percent of farms with gross cash farm income of $250,000 to $999,999 receive government payments, compared to 24 percent of farms with gross cash farm income of $10,000 to $249,999.
Instead of payments based on need, farm subsidies are largely based on the type of crops grown, and the volume produced over time. Because yield has long been a primary factor in the allocation of subsidies, bigger farms receive a larger proportion of the payments. Since the operators of bigger farms tend to have higher household incomes than their smaller counterparts, subsidies have shifted to higher income households.
This is where the rationale for farm subsidies falls apart. Large farms are generally more viable than small farms by virtue of economies of scale and access to technology.[149] Large farms can afford more sophisticated machinery and can take advantage of the latest scientific advances—both of which allow operators to manage more acreage and increase yields. To the extent that taxpayers absorb the costs of farming, farmers are less likely to optimize efficiency or minimize risk.
In 1996, Congress appeared to acknowledge the failures of centrally planned agriculture. That year’s Federal Agricultural Improvement and Reform Act[150](also known as the Freedom to Farm Act) was designed to phase out farm subsidies by 2002 and allow the agricultural sector to operate as a free market. After spending just $6.2 billion on what is called farm “income stabilization” in 1997—half the amount that was spent in 1992—Congress overreacted to a temporary dip in crop prices in 1998 (resulting from the Asian economic slowdown) by passing the first in a series of annual emergency bailouts for farmers.
By 2000, farm income stabilization spending hit a record $33.4 billion. Farmers quickly grew accustomed to massive government subsidies, and competition for the farm vote induced a bipartisan bidding war on the eve of the 2002 elections. That same year, lawmakers gave up on reform and enacted the largest farm bill in American history, projected to cost at least $180 billion over the following decade. Despite escalating costs and negative economic effects, farm subsidization continued to be the overwhelming preference of Congress and the White House.
Rather than fix this broken system, the 2008 farm bill made it worse.[151] Congress repealed key limits on the subsidies a farmer may receive, thereby ignoring President George W. Bush’s call to subsidize only those farmers who earn less than $200,000 a year, which would have effectively ended subsidies for corporate farms. The bill created a permanent new disaster program, increased subsidy rates, and used gimmicks to cover up a spending increase of approximately $25 billion over 10 years. Even corn farmers, who already benefit from soaring prices resulting from federal ethanol policies, continued to receive billions in annual subsidies.
With the national debt above $16 trillion, lawmakers are finally considering cuts to some farm subsidies. For example, the House and Senate have passed farm bills that would repeal a set of wasteful and antiquated commodity programs. Unfortunately, they would supplant those cuts with new subsidy programs, dubbed “shallow loss” and “target price” programs.[152] A shallow loss program protects farmers from even minor (shallow) losses, effectively removing virtually all risk from farming. In the Senate, farmers would be guaranteed protection for up to 88 percent of their revenue; in the House it would be 85 percent of the revenue. Since the cost of the shallow loss programs is based on an average of commodity prices from the previous five years, the numbers could skyrocket if prices are higher than expected. For both bills, the Congressional Budget Office assumed that commodity prices would stay at or near record highs. If the prices return to long-term averages, taxpayers could pay far more than what is projected.[153]
A target price program sets a specific price in law. If a commodity price falls below that level, farmers of the specific commodity receive a payment. In the House bill particularly, the target prices have been set so high that payments for some commodities would likely be guaranteed, such as payments to peanut farmers.
Not surprisingly, decades of farm subsidies have created an entitlement mentality among a class of farmers who have significant influence in Congress. Prospects for reform also are stymied by the sprawling scope of previous farm bills, which have encompassed food stamps, child nutrition, forestry, telecommunications, energy, and rural development. This concentration of special interests constitutes a powerful force for the status quo.
Major reforms are sorely needed to reduce farmers’ unnecessary dependence on taxpayers. First and foremost, lawmakers must separate the food stamp program from the agriculture-related programs of the farm bill so that reform is a possibility. Nearly 80 percent of the farm bill is composed of food stamps, making it really the “food stamp bill.” These distinct programs are combined solely for political reasons in order to get them passed. If the programs are separated, lawmakers could have the chance to consider each of these programs on its own merits. Thereafter, Congress can move toward elimination of numerous subsidies, placing restrictions on eligibility, and imposing income limits and subsidy caps.
Conclusion
Public policy decisions can alter the fabric of society. Changes in the Index of Dependence on Government are clearly traceable to public policy decisions that expanded or constricted the reach of government. The rapid increase in the 1960s and 1970s corresponds with a new commitment by the federal government to solve local social and economic problems, which had previously been the responsibility of local governments, civil society organizations, communities, and families. Both the number of government employees and people covered by government programs surged in the wake of the War on Poverty.
The 1980s and 1990s generally witnessed much slower growth in the Index as public policy emphasized reining in the size and influence of government. Unfortunately, the first decade of the new millennium was a different story: The Index resumed the growth rates attained during the era of big government and they are now growing even faster.
Americans should be concerned about this relentless upward march in Index scores. Dependence on the federal government for life’s many challenges strips civil society of its historical—and necessary—role in providing aid and renewal through the intimate relationships of family, community, and local institutions and local governments. While the Index does not measure the decay of civil society, it reflects an increase in the size and scope of government with a concurrent displacement of the institutions of civil society.
Today, the growth of government spending is of particular concern as the retirement of the baby-boomer generation has caused sharp increases in government spending. At the same time, the tax code has become a morass of tax credits and deductions that remove millions of Americans from the tax rolls, insulating them from the cost of government.
Perhaps the greatest danger is that the swelling ranks of Americans who enjoy government services and benefits for which they pay few or no taxes will lead to a spreading sense of entitlement that is simply incompatible with self-government. Americans have reached a point in the life of their republic at which the democratic political process has become a means for many voters to defend and expand the “benefits” they receive from government. Do Americans want a republic that encourages and validates a growing dependence on the state and a withering of civil society? Do Americans want sharp class lines drawn between those who receive government largesse and those who pay for it? These are questions increasingly in need of urgent answers. How Americans answer them may well determine the ultimate fate of their political system—and of their society.
It is not too late: The individual genius of Americans, acting through their civil society institutions, can still steer the nation from its present disastrous course. Civil society is not dead today. While government programs have crowded out civil society, Americans do not have to look far beyond their own neighborhoods to find fellow citizens voluntarily helping each other in times of need. Such noble examples should inspire Americans to shed their dependence on government programs that breed a sense of entitlement without any responsibility. The alternative—nurturing family and community relationships that foster voluntary mutual assistance—will help restore civil society as a strong pillar of American exceptionalism.
About the Authors
David B. Muhlhausen, PhD, is Research Fellow in Empirical Policy Analysis in the Center for Data Analysis at The Heritage Foundation.
Patrick D. Tyrrell is Research Coordinator in the Center for Data Analysis.
The former Director of the Center for Data Analysis, William Beach, made a substantial contribution to this report. Former Heritage Foundation policy expert David C. John and current Heritage Foundation policy experts Daren Bakst, Diane Katz, Lindsey Burke, Alyene Senger, Rachel Sheffield, and John Ligon contributed significantly to the 2013 Index.


