Introduction
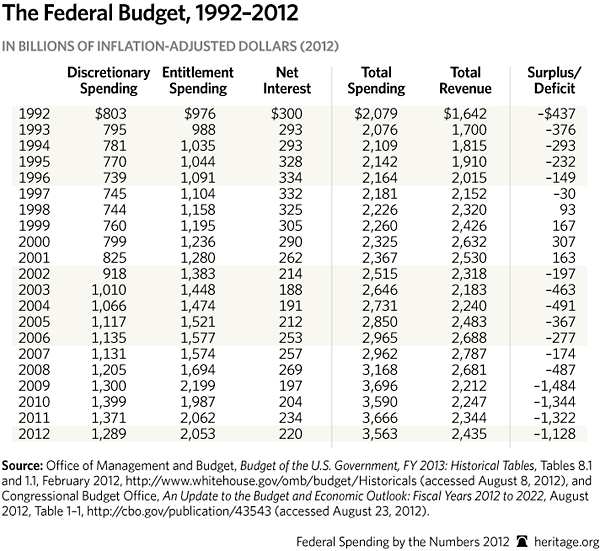
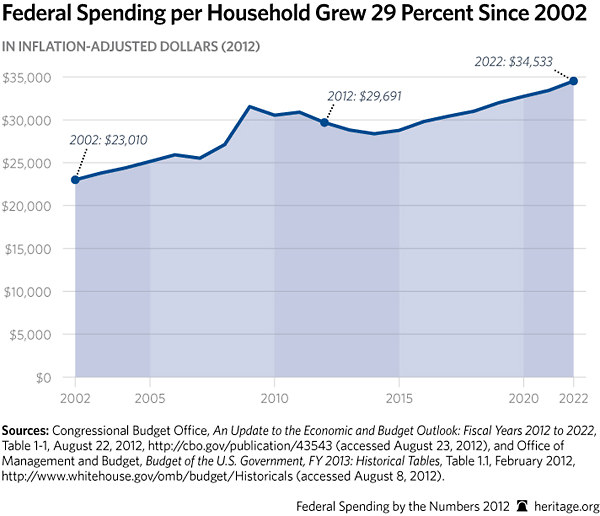
As this 2012 edition of Federal Spending by the Numbers shows, total federal spending for fiscal year 2012[1] reached $3.6 trillion, or 22.9 percent the size of the entire U.S. economy. In the past 20 years, federal outlays have grown 71 percent faster than inflation. The average American household’s share of this spending is $29,691, roughly two-thirds of median household income. This relentless growth is projected to continue, pushing total government outlays to $5.5 trillion a decade from now, and to about 36 percent of gross domestic product (GDP) in the next 25 years.
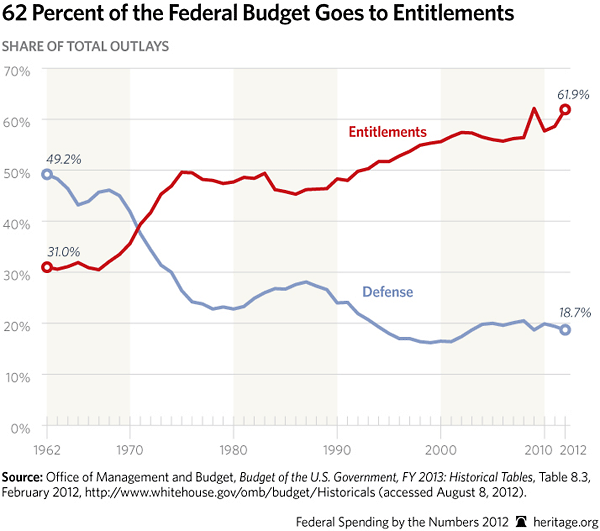
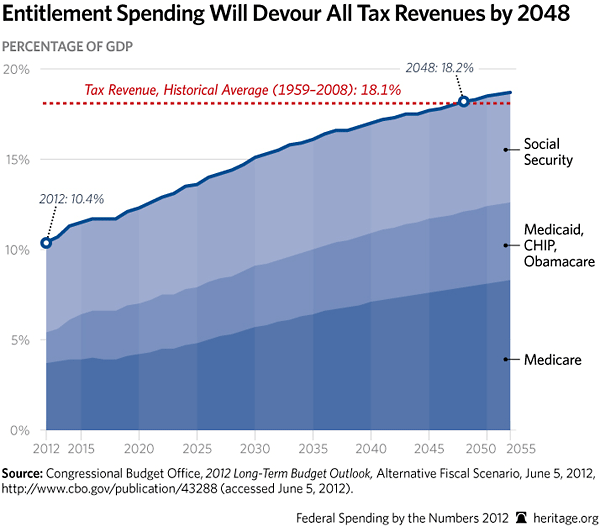
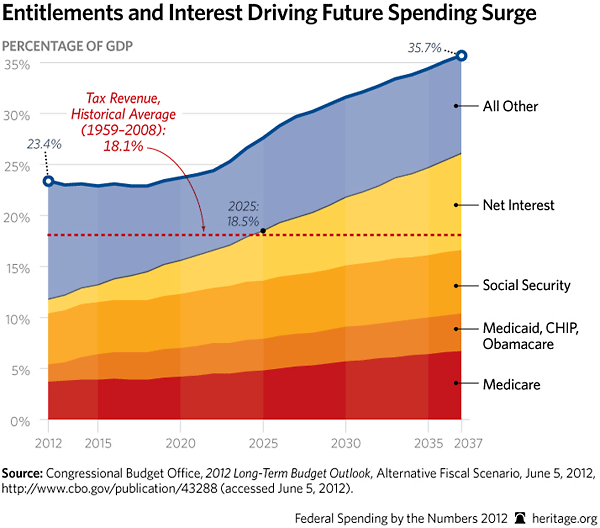
Federal entitlements are driving this spending growth, having increased from less than half of total federal outlays just 20 years ago to nearly 62 percent in 2012. Three major programs—Medicare, Medicaid, and Social Security—dominate in size and growth, soaking up about 44 percent of the budget. All three programs are growing faster than inflation, and—when joined with $1.7 trillion in new Obamacare spending—will drain about 18.5 percent of the nation’s total economic output by mid-century. Because that is about the historical annual average of total federal tax revenue, it means all other government programs—national defense, veterans health care, transportation, federal law enforcement, and others—would effectively have to be financed on borrowed money.
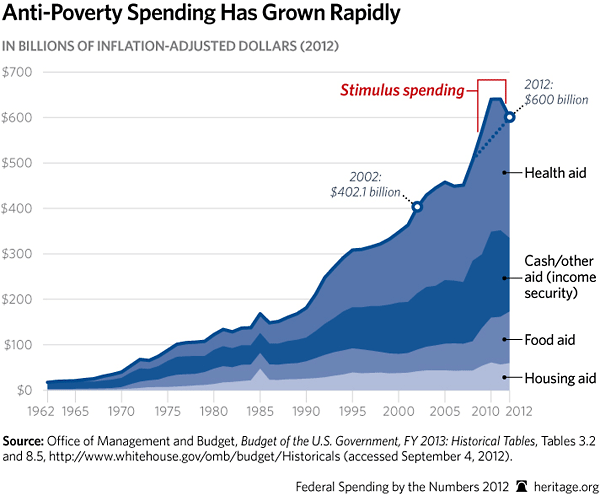
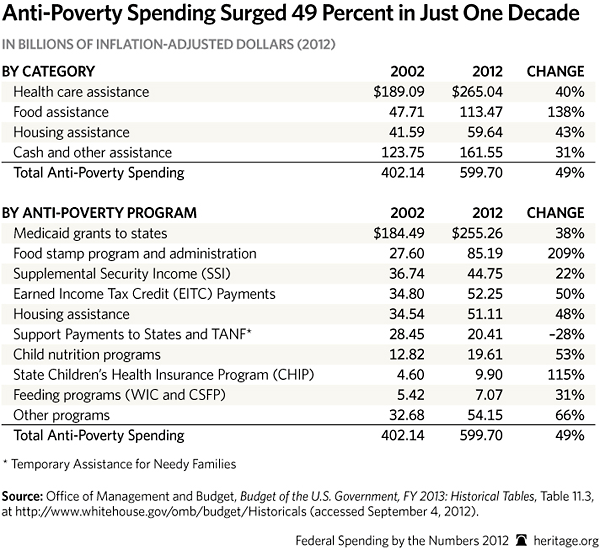
Other entitlements continue growing as well. Anti-poverty programs have surged by 49 percent in just the past decade, even after adjusting for inflation. Spending for food stamps alone has more than tripled since 2002. Health programs, including Medicaid, have increased by 38 percent, and housing assistance by 48 percent.
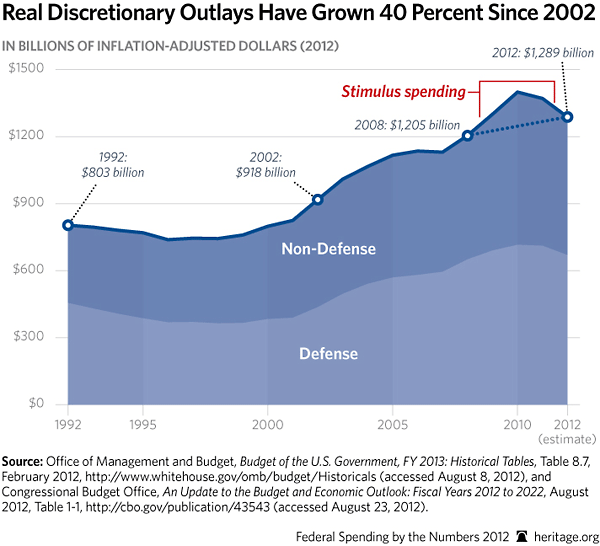
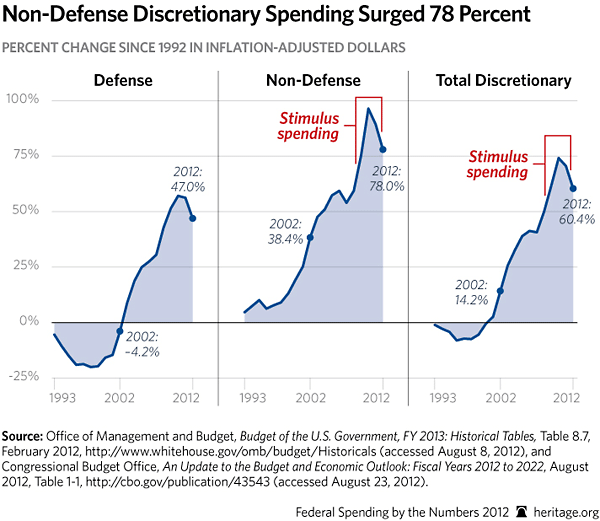
Although these entitlement programs have dominated the government’s spending growth, discretionary spending—spending authorized by annual appropriations bills—also has grown by 40 percent more than inflation, to $1.289 trillion. Spending on non-defense programs has grown 29 percent. These outlays peaked in 2010 due to the stimulus bill, but remain 7 percent higher than their pre-stimulus level of 2008.
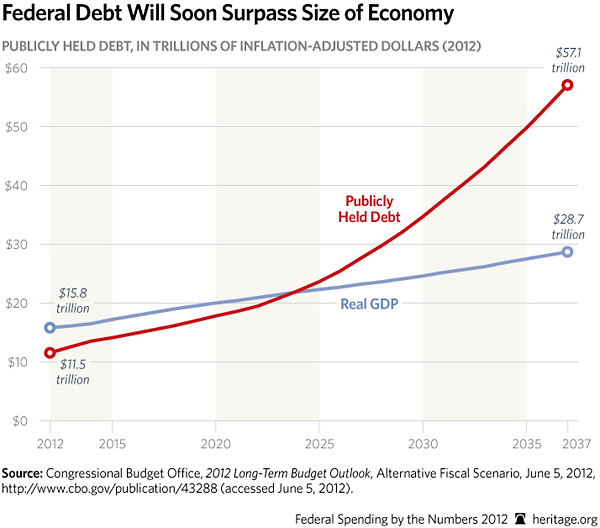
The result of this increasing deficit spending—which is financed by borrowing—is growing debt. If current policies continue, debt held by the public will approach 90 percent of total economic output by 2022, and will be twice the size of the entire economy 25 years from now.
There is still time to change course—but that time is growing short. The Heritage Foundation’s budget plan, Saving the American Dream,[2] reforms entitlements to make them affordable and sustainable, reins in other spending while adequately funding defense, and balances the budget in 10 years. The budget can be put on a stable, sustainable course if policymakers act soon.
Overall Budget Trends
- Over the past 20 years, federal spending grew 71 percent faster than inflation.
- Entitlement spending more than doubled over the past 20 years, growing by 110 percent (after adjusting for inflation). Discretionary spending grew by 60 percent.
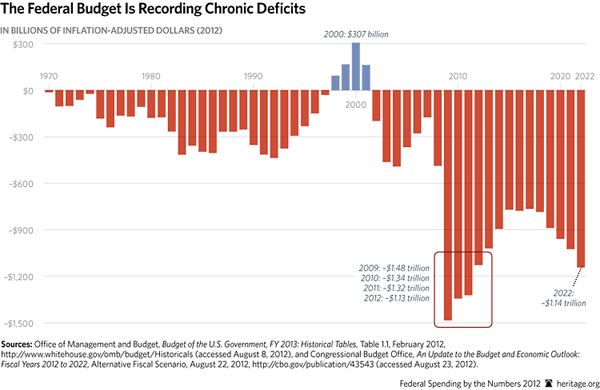
- Deficits have pushed up the debt each year since 2002 as federal spending exceeded revenue. Fiscal year 2012 marked the fourth consecutive year of $1 trillion deficits.
- Although debt held by the public surged from 33.6 percent of gross domestic product in 2002 to 73 percent in 2012, net interest costs have held below 2 percent of GDP because interest rates have fallen to all-time lows.
- In 1962, defense spending was nearly half the total federal budget (49 percent); Social Security and other mandatory programs were less than one-third of the budget (31 percent). Two major entitlement programs, Medicaid and Medicare, were signed into law by President Johnson in 1965.
- In 2012 entitlements were nearly 62 percent of total spending, while defense dropped to less than one-fifth (18.7 percent) of the budget.
Overall Spending Trends
- Federal spending per household reached $29,691 in 2012, a 29 percent increase (adjusted for inflation) from $23,010 in 2002. The government collected $20,293 per household in taxes in 2012.
- The excess of spending over taxes produced a budget deficit of $9,398 per household in 2012.
- For every $6.80 the federal government collected in taxes in 2012, it spent $10. Consequently, $3.20 out of every $10 spent was borrowed.
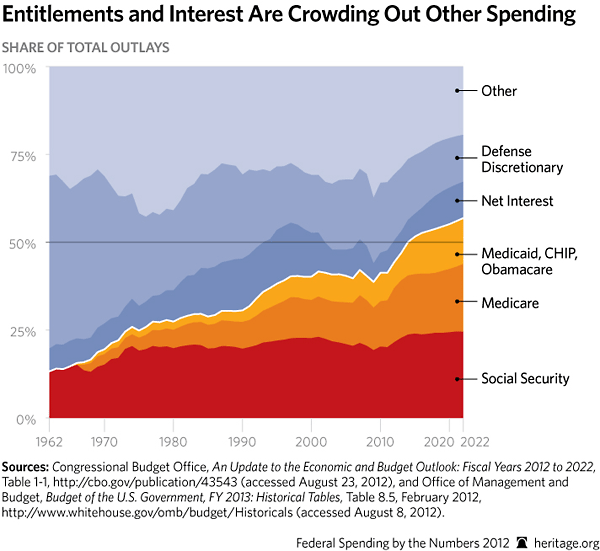
- Major entitlements (Social Security, Medicare, Medicaid, Children's Health Insurance Program, Obamacare) will increase from 44 percent of federal spending in 2012 to 57 percent in 2022.
- Entitlement programs and net interest costs will reach 67 percent of federal spending in 2022, crowding out spending on national defense and all other programs.
Where the Money Goes
- Total federal spending has grown 43 percent faster than inflation in just the past 10 years.
- Some of the largest growth in federal spending has been in K–12 education, a state and local priority.
- Food stamps and other nutrition programs also have more than doubled in the past 10 years. Food stamp participation rates also more than doubled, growing from 19.096 million recipients in 2002 to 44.709 million by 2011.
- In 1993, Social Security surpassed national defense as the largest federal spending category, and remains first today.
- Federal energy spending has increased steadily over the past decade with the government increasingly subsidizing activities like energy efficiency, energy supply, and technology commercialization. An unprecedented $42 billion was spent in 2009 as part of the stimulus, a nine-fold increase over the 2008 spending level.
- Interest on the debt is the fifth largest federal spending category, even at today’s low interest rates.
Spending Is Causing Damaging, Structural Budget Deficits
- The budget deficit results from the government spending more than it collects in taxes during a given year. The government must borrow to cover the excess spending.
- The $1.1 trillion deficit in 2012 marked the fourth consecutive year the deficit exceeded $1 trillion.
- The 2012 $1.1 trillion deficit was $953 billion (in inflation-adjusted dollars), or 547 percent, greater than the pre-recession and financial contagion deficit in 2007 of $174 billion.
- The 2012 deficit was an estimated 7.3 percent of GDP; the historical average is 2.1 percent of GDP.
- Deficits will not fall below $760 billion (in inflation-adjusted dollars) over the next 10 years and have only been higher in the period immediately after World War II.
Spending Increases Driving Debt Growth
- Structural budget deficits—driven largely by increased spending—are causing increasingly high levels of debt, which will threaten the economy.
- Debt held by the public reached 73 percent of GDP in Fiscal Year 2012. The historical average is 37 percent of GDP.
- Debt will reach nearly 90 percent of GDP by 2022. Levels this high damage the economy.
- Debt will surge to 200 percent of GDP in 25 years.
- Debt at the end of Fiscal Year 2012 was twice its 2007 pre-recession and pre-stimulus level of 36 percent of GDP.
- Debt in 2022 will be 90 percent of GDP. The highest level recorded previously—96.2 percent of GDP—was in 1947.
- Debt climbed from just over half of GDP in 2009 to nearly three-fourths in 2012.
Discretionary Spending
- Discretionary spending is set annually by Congress through appropriations. Today, it constitutes about one-third of total federal spending.
- Since 2002, discretionary outlays surged 40 percent faster than inflation.
- In 2012, the federal government spent $1.289 trillion on discretionary programs. Of that amount, $669 billion went to national defense (including operations in Iraq and Afghanistan) and the remaining $620 billion funded nearly all other federal programs including education and transportation.
- Stimulus spending caused discretionary spending to peak in 2010. It is still 7 percent higher than its pre-stimulus level of $1,205 billion in 2008.
- Budget surpluses in the late 1990s were fed largely by deep defense cuts that gutted the military, while non-defense discretionary spending continued growing.
- After 9/11, the Bush Administration began replenishing base defense spending, as well as funding the war against terrorism.
- Recent declines in defense spending are due to reductions in war spending and cuts to the core defense budget.
Base Spending Continues Growing
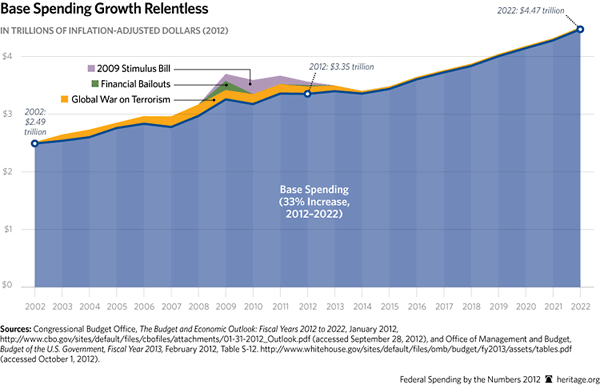
- In 2009, Washington spent $440 billion on temporary measures, such as the financial bailouts, the economic stimulus, and the global war on terrorism.
- In 2012, this temporary spending fell to $211 billion as the stimulus and financial bailouts waned.
- Base spending was 13 percent higher, adjusted for inflation, in 2012 than in 2008, before the financial bailouts and the stimulus.
- Even after the temporary spending ends, base spending (excluding the war on terrorism) will grow by 33 percent, adjusted for inflation, over the next decade.
The Major Entitlement Programs
- Entitlements run on autopilot, with annual spending determined by benefit formulas, caseloads, and economic factors. They are not budgeted annually, which makes entitlement spending difficult to control.
- All entitlements (excluding net interest) total nearly 62 percent of all federal spending today.
- Spending on the largest, Social Security, Medicare, and Medicaid, will leap from 10.4 percent of GDP in 2012 to 18.2 percent by 2048.
- The big three entitlements alone will absorb all tax revenues by 2048. Other spending, such as national defense or interest on the debt would have to be financed completely on borrowed money.
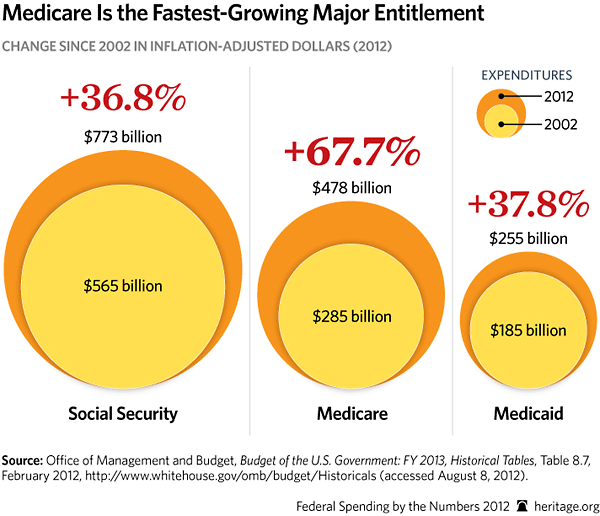
- Medicare is the fastest-growing major entitlement, growing 68 percent since 2002. Medicaid grew 38 percent and Social Security 37 percent.
Obamacare’s Spending
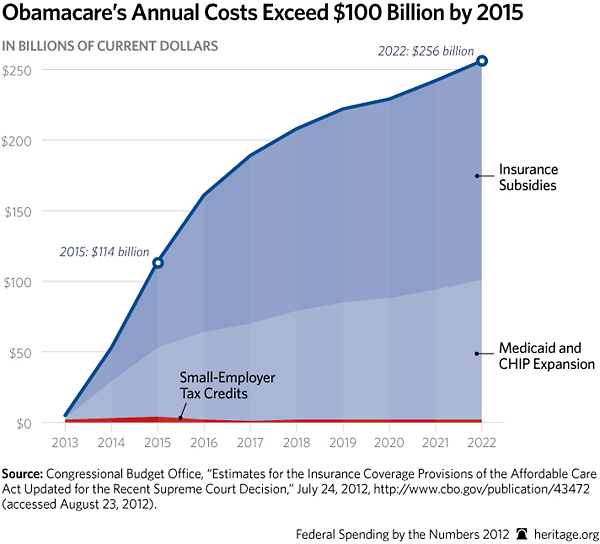
- Obamacare will spend $1.7 trillion (over 10 years) on its coverage expansion provisions alone, including a massive expansion of Medicaid and federal subsidies for the new health insurance exchanges.
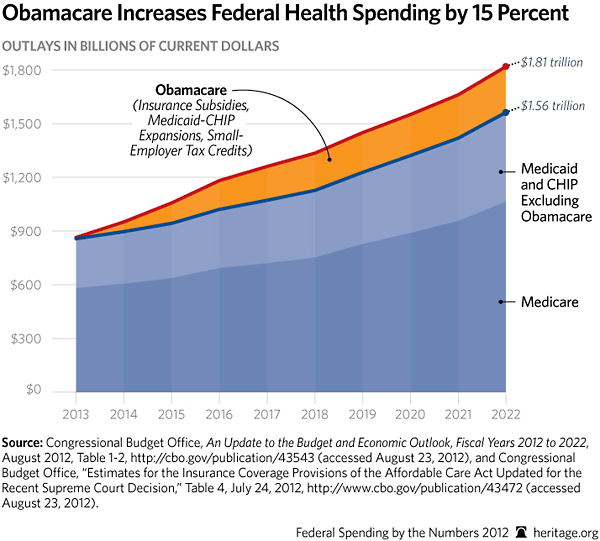
- Obamacare will increase federal health spending by 15 percent, bringing it to 44 percent of all mandatory spending.
- Obamacare’s 18 new or increased taxes and penalties raise $836 billion in new taxes between 2013 and 2022.
- Obamacare also includes $716 billion in spending cuts to Medicare, which are used to help offset new spending on non-Medicare provisions.
- The Medicare chief actuary warns that these cuts are unrealistic and unsustainable. Therefore, Obamacare will likely add billions to the budget deficit.
- Under Obamacare, all government health spending (including state and local) is projected to be nearly 50 percent of all health spending by 2021. Federal spending will account for two-thirds of total government health care spending.
Anti-poverty Spending
- Anti-poverty spending provides benefits to poor and low-income individuals and families in the form of income, health aid, food stamps, and housing assistance.
- Anti-poverty spending surged by 49 percent, inflation-adjusted, since 2002.
- Support Payments to States and Temporary Assistance for Needy Families (TANF) dropped by 28 percent. TANF is a block grant and is not adjusted for inflation or caseload changes.
- Spending for food stamps— the Supplemental Nutrition Assistance Program—has more than tripled since 2002, when the program was expanded.
- Spending on food stamps doubled in inflation-adjusted terms from $42 billion in 2008 to $85 billion in 2012.
- The Children’s Health Insurance Program (CHIP) grew 115 percent since 2002, adjusted for inflation.
Other Popular Programs Continue to Grow Rapidly
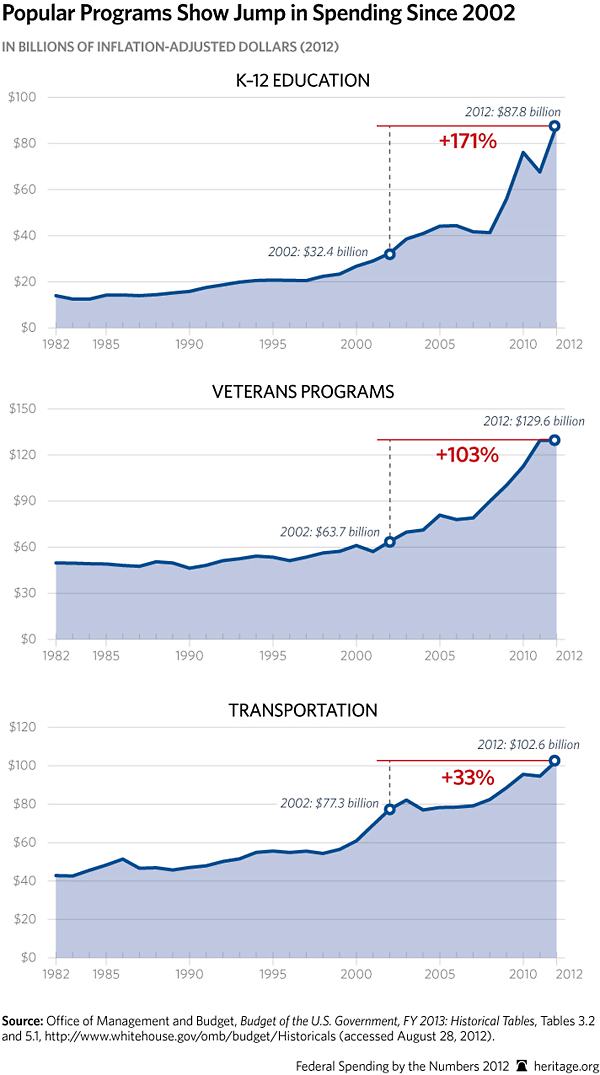
Congress has overseen unsustainable spending increases on programs such as education, veterans benefits, and transportation, demonstrating its failure to set budget priorities and rein in federal spending.
- In fiscal year 2012, Washington spent $88 billion on K–12 and vocational education, nearly triple the amount of just 10 years ago, after adjusting for inflation. Yet these huge infusions of federal funds to these state and local priorities have failed to improve educational performance.
- Veterans spending, which totaled about $130 billion in fiscal year 2012, has more than doubled over the past 10 years. It includes programs such as income security, housing aid, education and training services, and veterans health care. Under President Obama’s Fiscal Year 2013 budget, this spending would rise 18.5 percent from 2012 to 2015 and surpass the $150 billion mark.
- Transportation outlays have risen by $25 billion, or 33 percent, over the past 10 years. Budget authority, which takes several years to spend out, increased by $53 billion, or 61 percent over 10 years. Costly transit projects and low-value transportation enhancement programs for bicycle and horse trails and roadside transportation museums are fueling the increased spending, even though they do not improve mobility or relieve traffic congestion.
The Long-Term Budget Outlook
- The principal drivers of spending growth are Social Security, Medicare, Medicaid, the Children’s Health Insurance Program (CHIP), and Obamacare. By 2037, these entitlements will consume nearly 70 percent of all non-interest spending, and nearly 17 percent of GDP.
- Entitlements (Social Security, Medicare, Medicaid, CHIP, and Obamacare) and net interest will reach 18.5 percent of GDP in 2025, devouring all tax revenues at the historical average level. Total federal spending, including interest on the debt, will exceed 35 percent of GDP.
- Excluding interest payments, spending will reach a post–World-War II record 26 percent of GDP in 2037 and continue growing thereafter.
- Debt held by the public will grow rapidly to twice the size of the entire U.S. economy by 2037.
The Budget Control Act
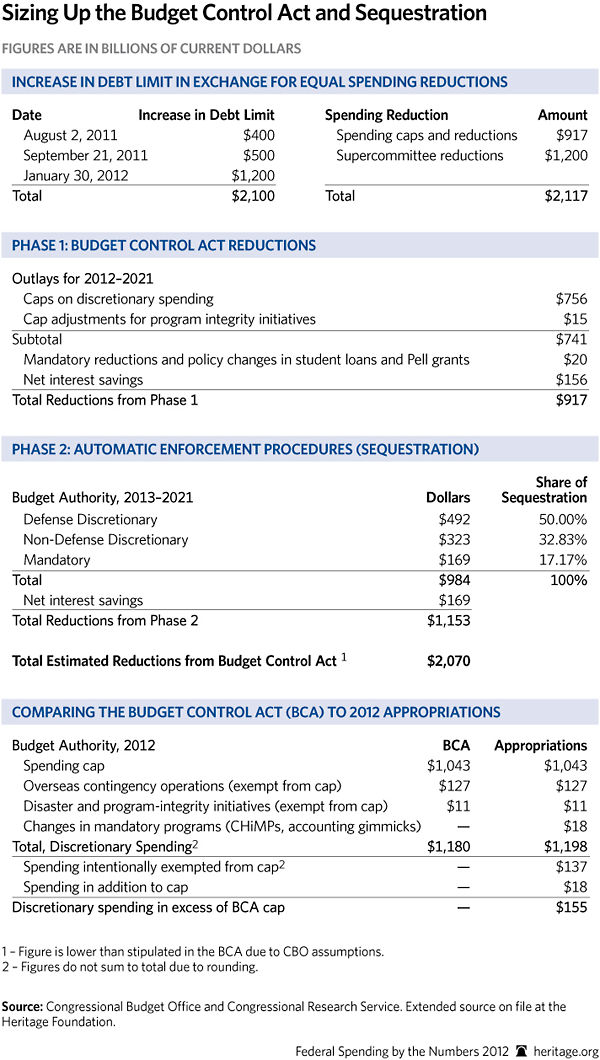
- The Budget Control Act of 2011 (BCA) increased the debt limit by $2.1 trillion, with an equal amount in spending reductions to take place over 10 years.
- The BCA first established caps on discretionary spending, saving $917 billion over 10 years, and then tasked a Joint Select Committee on Deficit Reduction—the Supercommittee with finding at least $1.2 trillion more in savings.
- The Supercommittee failed to reach agreement, which triggered sequestration—automatic budget cuts—totaling $1.2 trillion including interest savings over nine years. Sequestration begins on January 2, 2013.
- In 2012, the first year of the BCA, Congress spent $11 billion on “disasters” and program increases, and $127 billion on overseas contingency operations, which are exempt from the caps. Congress further evaded the BCA cap by $18 billion using an accounting gimmick.
Sequestration
- When the Supercommittee failed to reach agreement on $1.2 trillion in additional cuts required in the Budget Control Act of 2011, this triggered sequestration.
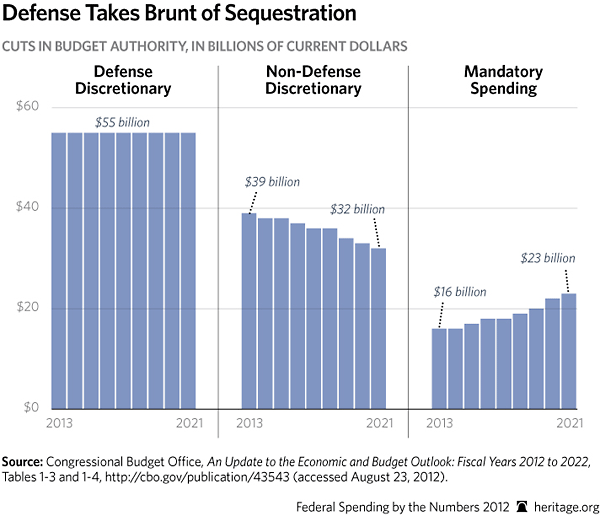
- Sequestration is a series of automatic budget cuts totaling $1.2 trillion, including interest savings, over nine years, beginning on January 2, 2013.
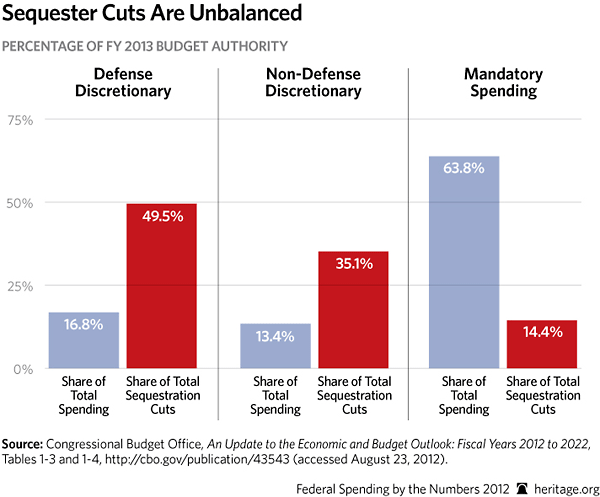
- Sequestration imposes 50 percent of its reductions on defense, which represents only 17 percent of fed- eral spending in 2013.
- Mandatory spending accounts for 64 percent of the budget in 2013, but receives only 15 percent of the sequestration cuts.
- Two of the largest spending programs, Social Security and Medicaid, are exempt from sequester savings, as is all but 2 percent of Medicare.
Nowhere to Cut?
- In 2011, the federal government wasted $115.3 billion of taxpayers’ money in improper payments: money paid in the wrong amount, to the wrong person, or for the wrong reason. Most of these excess payments—$107 billion, or 93 percent—were in just 10 programs, including Medicare fee-for-service ($28.8 billion), Medicaid ($21.9 billion), the Earned Income Tax Credit ($15.2 billion), and Unemployment Insurance ($13.7 billion). Implementation of updated computer systems and fraud detection methods and stricter documentation requirements would reduce payment errors.
- Federally subsidized Amtrak lost $84.5 million on its food and beverage services in 2011, and $833.8 million over the past 10 years. It has never broken even on these services.
- The Government Accountability Office (GAO) identified 34 areas in which federal agencies or initiatives have overlapping goals or duplicative services, which cost taxpayers billions of dollars each year. There are:
- More than 80 economic development programs operating out of four different agencies: the Departments of Agriculture, Commerce, and Housing and Urban Development, and the Small Business Administration;
- More than 100 economic development programs spread across five agencies within the Department of Transportation;
- Seven federal agencies, including the Departments of Education, Health and Human Services, and Housing and Urban Development, which have more than 20 programs addressing homelessness;
- 44 employment and training programs in the Departments of Education, Health and Human Services, and Labor; and
- 82 programs on teacher quality run through the Departments of Defense, Education, and Energy, as well as NASA and the National Science Foundation.
- In 2008 and 2009 alone, the Department of Justice spent (DOJ)$121 million to host or participate in 1,832 conferences.
- At one conference, petite Beef Wellington made the hors d’oeuvres menu, at a cost of $7.32 per serving.
- An internal audit found DOJ did not keep costs to a minimum, despite federal guidelines. The most expensive conference reviewed in the audit was held in Istanbul, Turkey, and cost $1.18 million.
- The General Services Administration (GSA), which is responsible for managing federal buildings and helping to cut costs, held a conference costing $822,751 in Las Vegas. At more than $2,500 per employee, it included $44-per-person breakfasts and commemorative coins for conference participants that cost $6,325.
- In fiscal year 2010, the federal government spent nearly $1.7 billion to maintain 77,700 underused or unused buildings.
- Eliminating both the New Starts and Small Starts transit grants programs would save taxpayers $5.6 billion over the next five years and $16.3 billion over 10 years. It would get the federal government out of the business of subsidizing high-cost, low-value local transit projects, such as $900 million for a 10-mile extension of the Bay Area rail system in San Jose and a $1.6 billion grant to construct a Honolulu rail line.
- The Department of Agriculture’s Office of the Chief Information Officer funded a $2 million intern program. Only one intern was hired full time as a result.
- Fifteen federal agencies are involved in administering 30 food safety laws, resulting in fragmented food safety oversight.
- The U.S. Navy bought 450,000 gallons of biofuels for $12 million, or almost $27 per gallon, to conduct exercises to showcase the fuel and bring it closer toward commercialization. It is the largest biofuel purchase ever made by the government.
- The Internal Revenue Service stored 22,486 items of unused furniture in a warehouse at an annual cost of $862,000.
- An Inspector General audit found that the Department of Energy cannot locate $500,000 worth of “green energy” manufacturing equipment that was bought with stimulus money.
- The Bureau of Indian Affairs funded a fish hatchery that never saw a fish hatch for fourteen years, continuing funding even after the land had been converted to office space. Taxpayers spent $46.1 million in fiscal year 2012 to operate the national fish hatchery system.
- The Department of Agriculture endorsed the “Meatless Monday” initiative and then a few weeks later announced plans to purchase $170 million worth of meat from drought-stricken livestock producers.
- The Labor Department spent $495,000 in stimulus money on 100 television commercials to advertise the Obama Administration’s Jobs Corps Initiative for green jobs.
- The Department of Veterans Affairs spent $6.1 million, or $3,389 for each of the 1,800 employees that attended two training conferences last year in Orlando, Florida. The agency Inspector General’s office is investigating the conference organizers for possible ethics rules violations. The department also spent nearly $50,000 to make a video parodying General Patton that was shown at the conferences and $98,000 on promotional items. The items included pens, highlighters, hand sanitizers, and USB flash drives with VA’s logo.
- The State Department began a Diplomatic Culinary Partnership program in 2012. Over 80 American chefs have been inducted into the American Chefs Corps and will support the State Department by preparing food for visiting officials and traveling around the world to engage in “culinary diplomacy.”
- The Department of Veterans Affairs spent $221,540 on an 11-day conference at a resort—enough to pay annual disability compensation for six totally disabled combat veterans.
- Department of Agriculture and Department of Energy officials approved a $76 million grant for a wood-to-ethanol plant in Soperton, Georgia, despite concerns among the project’s researchers and other officials. The plant closed within a year of receiving the loan guarantee, without producing any ethanol.
- The Rural Business Enterprise Grant Program gave $55,660 to a New York State dairy farm to package its butter in smaller, eight-ounce containers.
- A grant totaling $25,000 was used to transcribe a Maldivian love ballad.
- Taxpayers funded a National Institutes of Health study costing $55,382 in 2011, and $170,000 over three years, to study the hookah smoking habits of Jordanian university students.
- The Department of Agriculture’s Market Access Program spends $200 million a year to help U.S. agricultural trade associations and cooperatives advertise their products in foreign markets. In 2011, it funded a reality TV show in India that advertised U.S. cotton.
- The Environmental Protection Agency awarded a $141,450 grant under the Clean Air Act to fund a Chinese study on swine manure and a $1.2 million grant to the United Nations for clean fuel promotion.
- The Government Accountability Office (GAO) found that some people are double-dipping from unemployment and disability benefits programs. This lack of coordination among government agencies is costing taxpayers $850 million annually. GAO found one individual who drew $62,000 from unemployment insurance and disability insurance at the same time she was working and earning an additional $7,000 in income.
- In 2011, the top 20 percent of farm subsidy recipients received almost 80 percent of all premium subsidies. Twenty-six farm businesses each collected over $1 million worth of subsidies.
- Taxpayer losses from the failed solar cell manufacturing company Solyndra, which received a federal loan guarantee, totaled $528 million. Beacon Power and Abound Solar, two other failed alternative energy companies, cost taxpayers $46.5 million and $73.1 million, respectively.
- A Congressional Research Service report revealed that among individuals earning $1 million or more, 2,840 received unemployment benefits in 2008 and 2,362 received the benefits in 2009.
- The Conservation Reserve Program pays farmers $2.1 billion annually not to farm their land for a period of at least ten years.
Sources include Congressional Budget Office and Government Accountability Office reports, Wastebook 2011 from the Office of Senator Tom Coburn (R-OK), and news articles from various media outlets, all of which are on file at The Heritage Foundation.
