
On August 26, the U.S. Census Bureau released annual poverty figures showing that the percentage of persons who are poor rose from 12.1 percent in 2002 to 12.5 percent in 2003.1 It is important to recognize that the recently released census poverty figures are one year old. They cover 2003--not the current year. Given current economic conditions, it is extremely likely that poverty fell during 2004, although the official figures will not be available until August or September of 2005.
Poverty as an Economic Indicator
Poverty is a lagging economic indicator. Formal recessions (periods in which the whole economy is shrinking) usually last less than one year. However, the poverty rate almost always continues to rise for several years after a recession ends. The last recession officially ended--and overall economic growth resumed--in November 2001, but the poverty rate continued to rise in the two subsequent years: 2003 and 2004. This cycle follows the normal economic pattern that has occurred in most prior recessions.
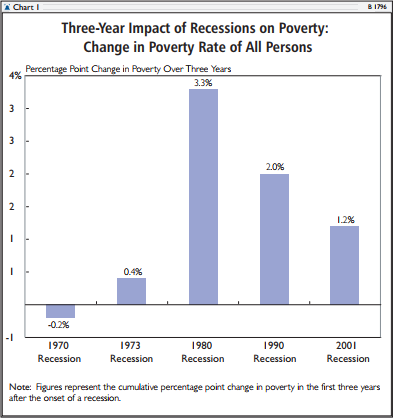
The recent recession was comparatively mild and had a limited impact on poverty, especially child poverty. (See Charts 1 and 2.) Overall, the increase in poverty resulting from the recent economic downturn has been half the increase that occurred in the last two recessions (1980 and 1990).
In the recession that began in 1980, the poverty rate of all persons rose by 3.3 percentage points over three years. In the recession that began in 1990, the poverty rate rose by 2.0 percentage points. By contrast, in the most recent recession, poverty among all persons rose by only 1.2 percentage points over three years.
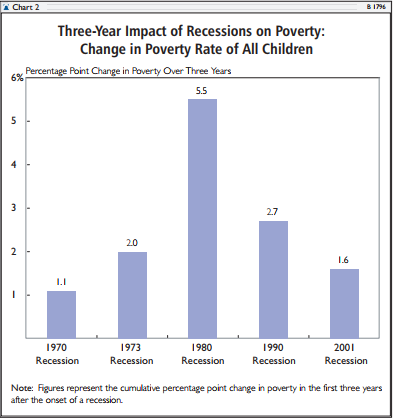
The impact of the recent recession on child poverty has been modest. In the 1980 recession, child poverty rose 5.5 percentage points over three years. In the 1990 recession, child poverty rose 2.7 percentage points. By contrast, during the most recent recession, child poverty rose only 1.6 percentage points over three years.
The newly released census figures also provide evidence of the success of the welfare reform enacted in 1996. For a quarter of a century prior to welfare reform, the black child poverty rate remained frozen near 42 percent. In the years after welfare reform, black child poverty plummeted, reaching 30 percent in 2001--the lowest level in U.S. history.2 In 2003, the black child poverty rate rose, but was still at the comparatively low level of 33.6 percent. Despite the recession, nearly one million black children have been raised out of poverty since the welfare reform of 1996.
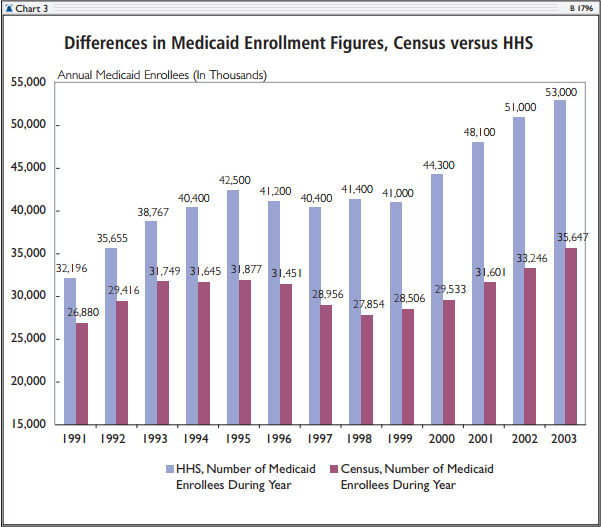
The new Census Bureau report shows an increase in the number of persons without health insurance. However, the census count of the "uninsured" appears unreliable. Historically, census figures are significantly higher than the "uninsured" count in other government surveys, such as the Survey of Income and Program Participation (SIPP) and the Medical Expenditure Panel Survey (MEPS).3 The inaccuracy of the census count of the uninsured may be due, in part, to its undercount of Medicaid enrollments. In 2003, 53 million persons were enrolled in Medicaid but the census reported only 35.6 million enrollees. Medicaid enrollments have expanded dramatically in recent years but the census figures have failed to reflect this increase. As Chart 3 shows, year after year, the gap between actual Medicaid enrollments and the census numbers grows larger.
The Gap Between the Rich and the Poor
The census report also contains the income distribution figures that serve as the foundation for most class warfare rhetoric. The Census Bureau measures income distribution by ranking U.S. households according to income and then dividing them into fifths (or "quintiles"). The share of total income going to each quintile is then measured. Superficially, the census figures show a high level of inequality. In 2003, the census reported that the top fifth of households had 49.8 percent of the total income, while the bottom fifth had only 3.4 percent. Thus, the top quintile appeared to have $14.60 in income for every $1.00 in the bottom quintile.4
These figures are misleading for three reasons. First, they ignore taxes. Second, they ignore nearly all of the $750 billion in social safety net benefits received by low-income and elderly persons. Third, the census' fifths or quintiles do not contain equal numbers of persons. The top quintile actually has 70 percent more people than the bottom quintile.5 If taxes and safety net benefits are taken into account and the quintiles are adjusted so that each contains one-fifth of the population, the apparent gap between the top and the bottom quintiles shrinks dramatically--the ratio of the income of the top quintile to that of the bottom quintile falls from $14.60 to $1.00 down to $4.21 to $1.00.6
The Census Bureau reports that 35.9 million persons "lived in poverty" in 2003. To understand poverty in America, it is important to look behind these numbers and examine the actual living conditions of the individuals the government deems to be poor.7 For most Americans, the word "poverty" suggests destitution--an inability to provide a family with nutritious food, clothing, and reasonable shelter. Yet only a small number of the millions of persons classified as "poor" by the Census Bureau fit that description. Although real material hardship certainly does occur, it is limited in scope and severity. Most of America's "poor" live in material conditions that would be judged as comfortable or well off just a few generations ago.
The following facts about persons defined as "poor" by the Census Bureau are taken from various government reports:
- Forty-six percent of all poor households own their own homes. The average home owned by persons classified as "poor" by the Census Bureau is a three-bedroom house with one-and-a-half baths, a garage, and a porch or patio.
- Seventy-six percent of poor households have air conditioning. By contrast, 30 years ago, only 36 percent of the entire U.S. population enjoyed air conditioning.
- Only 6 percent of poor households are overcrowded. More than two-thirds have more than two rooms per person.
- The average poor American has more living space than the average individual living in Paris, London, Vienna, Athens, and other cities throughout Europe. (These comparisons are to the average citizens in foreign countries, not to those classified as poor.)
- Nearly three-quarters of poor households own a car; 30 percent own two or more cars.
- Ninety-seven percent of poor households have a color television. Over half own two or more color televisions.
- Seventy-eight percent of America's poor own a VCR or DVD player; 62 percent have cable or satellite TV reception.
- Seventy-three percent of America's poor own microwave ovens; more than half have a stereo; and one-third have an automatic dishwasher.
As a group, America's poor are far from being chronically undernourished. The average consumption of protein, vitamins, and minerals is virtually the same for poor and middle-class children and, in most cases, is well above recommended norms. Poor children actually consume more meat than do higher-income children and have average protein intakes that are 100 percent above recommended levels. Most poor children in America today are, in fact, super-nourished and grow up to be, on average, one inch taller and 10 pounds heavier that the GIs who stormed the beaches of Normandy in World War II.
Although the poor are generally well nourished, some poor families do experience hunger--meaning a temporary discomfort due to food shortages. According to the U.S. Department of Agriculture, in 2002, 13 percent of poor families and 2.6 percent of poor children experienced hunger at some point during the year.8 In most cases, their hunger was short term. Eighty-nine percent of the poor reported that their families had "enough" food to eat,9 while only 2 percent said they "often" did not have enough to eat.10
Overall, the typical American defined as poor by the government has a car, air conditioning, a refrigerator, a stove, a clothes washer and dryer, and a microwave. He has two color televisions, cable or satellite TV reception, a VCR or DVD player, and a stereo. He is able to obtain medical care. His home is in good repair and is not overcrowded. By his own report, his family is not hungry and he had sufficient funds in the past year to meet his family's essential needs. Although this individual's life is not opulent, it is equally far from the popular images of dire poverty conveyed by the press, activists, and politicians.
Of course, the living conditions of the average poor American should not be taken as representing all the poor. There is actually a wide range in living conditions among the poor. For example, over a quarter of poor households have cell phones and telephone answering machines, but at the other extreme, approximately one-tenth have no phone at all. While the majority of poor households do not experience significant material problems, roughly a third do experience at least one problem such as overcrowding, temporary hunger, or difficulty obtaining medical care. However, even in households in which such problems do occur, the hardship is generally not severe by historic or international standards.
The best news is that remaining poverty can readily be reduced further, particularly among children. There are two main reasons that American children are poor: Their parents don't work much, and fathers are absent from the home. In good economic times or bad, the typical poor family with children is supported by only 800 hours of work each year: That amounts to 16 hours of work per week. If work in each family were raised to 2,000 hours per year--the equivalent of one adult working 40 hours per week throughout the year--nearly 75 percent of poor children would be lifted out of official poverty.11
Father absence is another major cause of child poverty. Nearly two-thirds of poor children reside in single-parent homes. Each year, an additional 1.3 million children are born out of wedlock. If poor mothers married the fathers of their children, almost three-quarters would immediately be lifted out of poverty. If welfare could be turned around to really require work and to encourage marriage, remaining poverty would drop quickly.12
The recent Census Bureau report substantially exaggerates the extent of poverty and economic inequality in the United States. To the extent that enduring poverty continues in our society, it is largely the result of personal behavior, particularly the lack of work and marriage. Policies that require welfare recipients to work or prepare for work as a condition of receiving aid and that encourage the formation of healthy marriages are the best vehicles for further reducing poverty.
Robert Rector is Senior Research Fellow in Domestic Policy Studies at The Heritage Foundation.


