Abstract: The number of Americans who pay federal income taxes has been shrinking every year, with a recent report suggesting that less than half of American households owed federal income taxes in 2009. One of the key components of Obamacare, tax subsidies to purchase federally approved health insurance, will substantially increase the number of people who are not paying for government services and thus have a lower incentive to be concerned about record-breaking government spending. These tax subsidies, which take effect in 2014, will also harm the economy by increasing the national deficit and by creating huge marginal tax rates that will discourage productivity for many households. Obamacare’s tax subsidies are one of the primary reasons to repeal Obamacare. This Heritage Foundation analysis lays out the facts.
The percentage of households that pay no federal income taxes has more than doubled over the past two decades[1]—creating a detachment between many Americans and the cost of their government. On April 29, 2011, the congressional Joint Committee on Taxation highlighted that only 49 percent of tax-filing units had positive income tax liability in 2009, while 30 percent of tax-filing units received more from the federal government in tax credits than the amount of their income tax liability.[2] It is nothing less than shocking, even given the economic recession, that half of the tax-filing households in the entire country did not pay any federal income tax in 2009.
Obamacare will exacerbate this detachment through its creation of tax subsidies to purchase health insurance. For instance, under the Obamacare tax subsidy, a 50-year-old married couple with three children will not pay federal income tax until they earn around $108,000. The tax subsidies, along with the enormous expansion of Medicaid, represent one of the most significant increases in the number of individuals who do not contribute to the cost of government in generations. Moreover, the deficit-increasing tax subsidies will dramatically increase marginal tax rates at the cutoff point for the subsidy, which is four times the federal poverty level (FPL), or about $95,000 for a family of four, and $111,000 for a family of five, in 2014. Dramatically higher marginal tax rates discourage individuals from working and will therefore harm the economy. For these reasons, the tax subsidies point to the necessity of repealing Obamacare.
Obamacare Tax Subsidies
Obamacare’s tax subsidies are available for certain households who purchase federally approved coverage in the newly created state health insurance exchanges. Households below 400 percent of the federal poverty level qualify for the subsidies unless they are eligible for Medicare or Medicaid or they can receive coverage through their employer that meets standards established in Obamacare.[3]
The tax subsidy is structured to cap the percentage of family income that these households pay for health insurance with an actuarial value of 70 percent, equivalent to a “silver” plan in the exchanges.[4] The percentage is based on a sliding scale, so the subsidy decreases as household income rises. Households at 133 percent of the FPL will receive a tax subsidy that limits their out-of-pocket premium contribution to 3 percent of gross income. Households between 300 percent and 400 percent of the FPL will receive a tax subsidy that limits their premium contribution to 9.5 percent of household income.[5]
Besides income, the tax subsidy is determined by the premiums people would expect to pay for a “silver” plan in the exchanges, adjusted for the person’s age. Since Obamacare allows premiums to reflect the fact that older individuals are more likely to have higher health care expenses, older individuals receive a more generous tax subsidy.[6]
When it takes effect in 2014, the Obamacare tax subsidy will become the largest tax subsidy that many families receive. Currently, the two largest tax credits are the child tax credit ($1,000 per child per year) and the earned income tax credit (EITC), which can be worth up to several thousand dollars.[7] The EITC is a “refundable” tax credit, and the child tax credit is refundable in certain circumstances.[8] These tax credits are the primary reason why many households have zero, or negative, federal income tax liability. The Obamacare tax subsidies will cause more households to fall into these categories. Without Obamacare, a family of four headed by a 40-year-old earning $70,000 owes about $5,400 in federal income taxes. Under Obamacare, that same family will receive a tax subsidy of $5,579.
Expansion of Welfare State to Unseen Heights
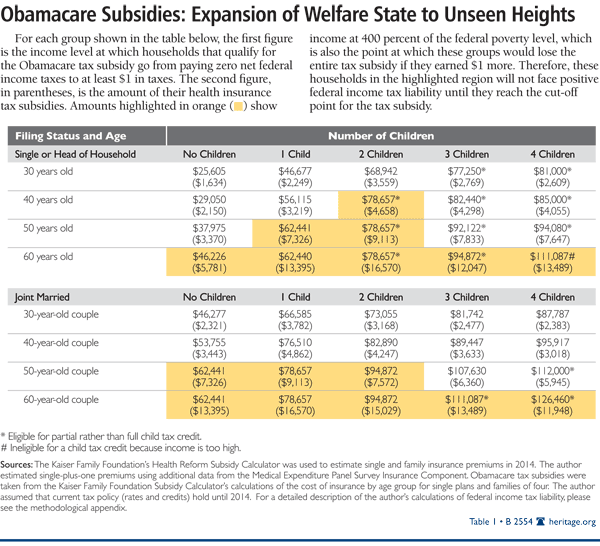
Obamacare’s tax subsidies transfer considerable income from taxpayers to millions of households that do not receive health insurance through their (or their family members’) jobs. The Obamacare subsidies also substantially increase the number of people who do not pay for the government services from which they benefit.[9] Table 1 shows the income at which a household will begin paying federal income taxes if it qualifies for the health insurance tax subsidy under Obamacare. The numbers in parentheses are the estimated size of the household’s health insurance tax subsidy.[10]
Two factors affect the magnitude of the estimates in the table: (1) household size and (2) the age of the head of household. As household size increases, the number of exemptions that households qualify for (that reduce taxable income) and the probability of qualifying for the child tax credit increase as well.[11] Additionally, since the FPL is based on household size and the tax subsidies are based on the FPL, the Obamacare tax subsidies increase as household size increases. The age of the head of household matters for the calculation since health insurance premiums increase as people grow older.[12] Larger families with older parents will qualify for more generous subsidies, relative to similar families with younger parents, and will therefore have to earn higher incomes to have federal income tax liability.[13]
There are several striking features from Table 1. The first is that many middle-class households, some in the upper middle class, will not pay any federal income tax if they qualify for the Obamacare tax subsidy. For example, a married couple aged 50 with two children (under the age of 19, to qualify for the child tax credit), who qualify for the Obamacare tax subsidy, will not begin paying federal income taxes until earning approximately $94,872.[14] An identical family with the same gross income that receives insurance through work will pay about $7,572 in federal income taxes—the value of the Obamacare tax subsidy for a household with these characteristics.
Bigger Deficit, Fewer Taxpayers
The Congressional Budget Office (CBO) estimates that about 19 million people will receive tax subsidies to purchase insurance through the state exchanges in 2019.[15] Since these subsidies are refundable, millions of additional households will have federal tax subsidies that exceed their income tax liability. In fact, most of the households participating in the exchanges will not pay any federal income taxes and will likely receive money back from Washington. Even when accounting for households that currently have no federal income tax liability, the Obamacare tax subsidies create a scenario in which about half of all households will have zero or negative income tax liability after the economy has recovered completely from the recession.
The tax subsidies are projected to be the biggest deficit-increasing component of Obamacare. The CBO estimates that the subsidies will add $100 billion to the deficit by 2018, growing more expensive thereafter.[16] Since many of the beneficiaries will be in the upper middle class, Obamacare’s tax subsidies represent a reckless addition to the welfare state. Furthermore, the considerable expense of these tax subsidies will be borne by a dwindling number of households who pay federal income taxes, and by future taxpayers through increased federal borrowing.
Enormous Marginal Tax Rates
The Obamacare tax subsidies will profoundly discourage productivity near the point at which households lose eligibility for the subsidy. Those participating in the health insurance exchanges will be eligible for subsidies only if their family income is less than four times the federal poverty level (almost $95,000 for a family of four in 2014). Once family income increases beyond 400 percent of the FPL, the entire tax subsidy is lost.
According to the Kaiser Family Foundation Subsidy Calculator, a family of four headed by a 60-year-old would stand to lose a tax subsidy worth more than $15,000 as household income passes 400 percent of the FPL. The subsidy is therefore equivalent to roughly $24,000 in pre-tax income, which means that the family would need a raise of $24,000 to simply break even. The cliff effect is much less significant at lower ages because premiums, and hence the tax subsidies, are less generous.
Table 1 shows the impact of the loss of the tax subsidy for certain families. At $94,872, a 50-year-old married couple with two children is at the maximum amount it can earn to still qualify for the tax subsidy (shown by the shaded region in the table and indicates this family is at 400 percent of the FPL). If the family earns a single extra dollar, it will lose the tax subsidy of $7,572 and experience a significant decrease in disposable income.
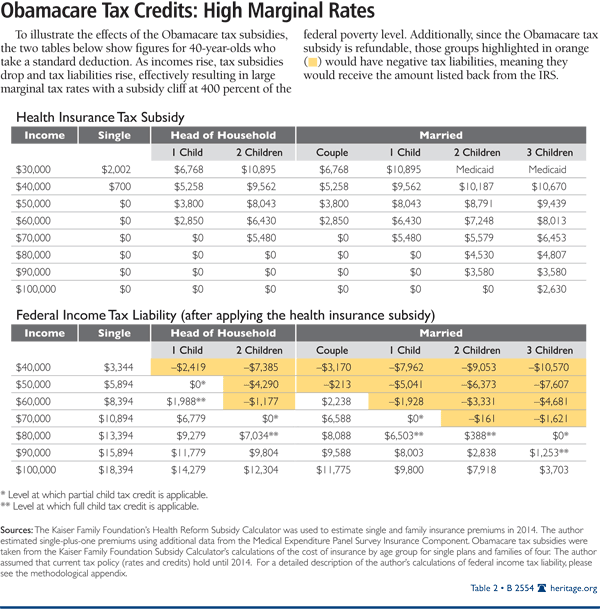
As a case study, consider the impact of the Obamacare tax subsidy on households headed by a 40-year-old taking a standard deduction.[17] Table 2(a) shows the tax subsidy amount by filing status and income level, and Table 2(b) shows the corresponding household federal income tax liability (a negative amount means the household receives that amount back from the IRS). Table 2(b) provides further evidence of the large marginal tax rate when the Obamacare tax subsidies expire at 400 percent FPL. For example, a married 40-year-old couple with one child faces an average marginal federal income tax rate of more than 65 percent when family income goes from $70,000 to $80,000. Including payroll taxes and state taxes, this estimate would likely push the marginal rate for these households above 80 percent.
Because the subsidy for certain households is so large, the threat of losing the tax subsidy will act as a powerful disincentive for individuals to earn additional income. Since the size of the subsidy is larger for older people, this disincentive only increases in strength as people grow older and as income approaches the upper limit for subsidy eligibility. Research on the behavior of people when responding to taxes has shown that these types of subsidies reduce work and productivity.[18]
Widespread Ramifications
Obamacare’s tax subsidies will increase future annual budget deficits well in excess of $100 billion, and will remove millions of households from the federal income tax rolls. While households receiving the tax subsidies will still face payroll taxes, the payroll tax is thought to be earmarked for Social Security and part of Medicare.
Federal income taxes, on the other hand, fund the military, federal agencies, and state programs like Medicaid. The Obamacare subsidies substantially shrink the tax base that pays for these programs and thus desensitizes many more voters to the cost of government. As a result, the corresponding tax burden to finance government will fall on a dwindling number of households. Moreover, many other households will face crushing marginal tax rates around the income cutoff for the Obamacare tax subsidy.[19]
Growth-focused tax policy should be moving in exactly the opposite direction by expanding the tax base and lowering marginal rates. Reforming the federal tax treatment of health insurance to promote equity between those with and without access to insurance through their jobs is necessary, but should be combined with a more significant tax reform that is careful not to take people in the middle class off the tax rolls. Furthermore, the design of tax subsidies to purchase health insurance should not include harmful cutoff points that discourage work and productivity.
—Paul L. Winfree is a Senior Policy Analyst in the Center for Data Analysis at The Heritage Foundation. The author gratefully acknowledges former Heritage Foundation Policy Analyst Brian Blase for his significant contributions in shaping this paper.
Appendix
Methodology
Federal income tax liability is estimated as a function of income, the federal tax schedule adjusted to 2014 levels, the standard or itemized deduction and personal exemption adjusted to 2014 levels, the Earned Income Tax Credit (EITC), the child tax credit, and the Obamacare health insurance tax subsidy. For our calculations, we assumed that the current tax policy is extended and that marginal rates and the number of households affected by the alternative minimum tax do not increase.
We assumed unmarried adults without children will file as singles and will purchase a single health insurance plan in the exchanges. We assumed unmarried individuals with children will file as heads of household. We assumed unmarried adults with only one child would buy a single-plus-one plan, whereas unmarried adults with more than one child would buy family coverage. We assumed married couples without children would buy a single-plus-one plan, whereas married couples with children would buy family coverage.
We used the Kaiser Family Foundation’s (KFF) Health Subsidy Calculator for the estimates of the second-lowest-cost “silver plan,” which has an actuarial value of 70 percent. In addition, we calculated single-plus-one premiums by increasing single-plan-premium estimates from the KFF Calculator by 90 percent. The 90 percent estimate was derived by comparing single and single-plus-one coverage for employer-sponsored insurance from private firms in the Medical Expenditure Panel Survey Insurance Component.[20]
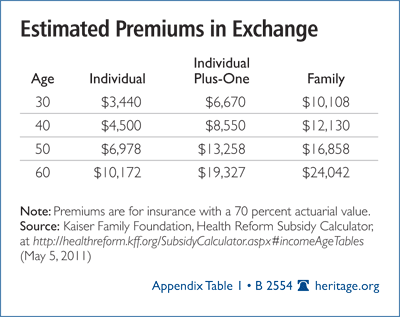
According to the provisions of Obamacare, variations in premiums for insurance plans will be almost entirely based on the age of the head of household. This is because Obamacare does not allow premiums to reflect much besides age, and the variation by age is restricted to a 3-to-1 age rating band. Premiums by age for individual and family coverage for 2014 were calculated based on the Health Subsidy Calculator found on the KFF Web site.[21] The individual-plus-one premiums were derived by multiplying the individual plan premiums by the ratio of average individual-plus-one premiums to individual premiums of employer-sponsored plans for private firms using data from the 2009 Medical Expenditure Panel Survey Insurance Component.[22] Appendix Table 1 shows Kaiser’s estimated premiums (and our estimates for individual-plus-one premiums) by age of the head of household and coverage type.
According to the Department of Health and Human Services, the 2011 federal poverty rate for an individual was $10,890. This amount increases by $3,820 for each additional member of the household. We adjusted these figures by 2 percent annually in order to estimate what they will be in 2014. Appendix Table 2 estimates the 2014 income level corresponding to 133 percent of FPL (the income threshold where households begin qualifying for the subsidies) and 400 percent of the FPL (the maximum income threshold for households to qualify for the subsidies).
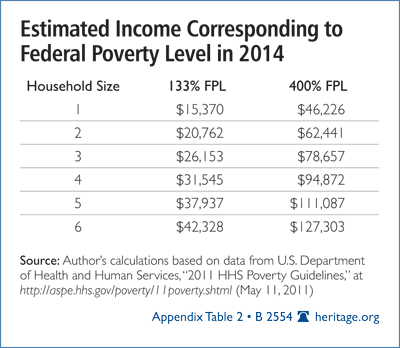
Appendix Table 3 shows the estimated tax brackets that we used.
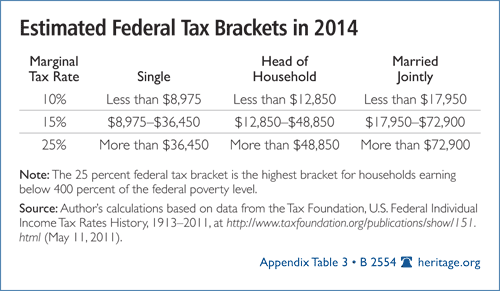
Example of Federal Income Tax Calculation. Following are the calculations for a 40-year-old married couple with three children under the age of 19 who file a joint return. The estimated standard deduction for this couple in 2014 is $12,300, but roughly two-thirds of filers in this bracket itemize their returns, thereby decreasing their taxable income. After adjusting the standard deduction (explained below under “Itemized Deduction Estimates”), itemizing will increase this couple’s deduction by about $7,442. Including the $3,900 personal exemption means that this family can deduct about $39,242 from its total taxable income.
This same household benefits from a $1,000 tax credit per child as long as gross income remains below $110,000. If this household’s gross income was below $50,000, it would also benefit from the EITC. With total deductions (including exemptions) of $39,242 and a child tax credit of $3,000, the household would have to earn more than $89,000 in order for the net federal income tax liability to be positive, if the family qualifies for the Obamacare tax subsidy.
For this particular family, household income would have to reach $89,447 until it has positive federal income tax liability. At this income level, the household is earning 322 percent of the FPL. Accordingly, this household is allowed to pay only 9.5 percent of its income toward the price of the silver plan in the health insurance exchanges, which is the plan to which tax subsidies are benchmarked. Nine and a half percent of this household’s income is $8,498. KFF estimates that a premium for family coverage in the exchange will be $12,130 for a family headed by a 40-year-old. Therefore, this family will receive a tax subsidy of $3,633 to buy health insurance in the exchange. This family’s Obamacare tax subsidy plus its aggregate child tax credit yields $6,633 worth of total tax credits.
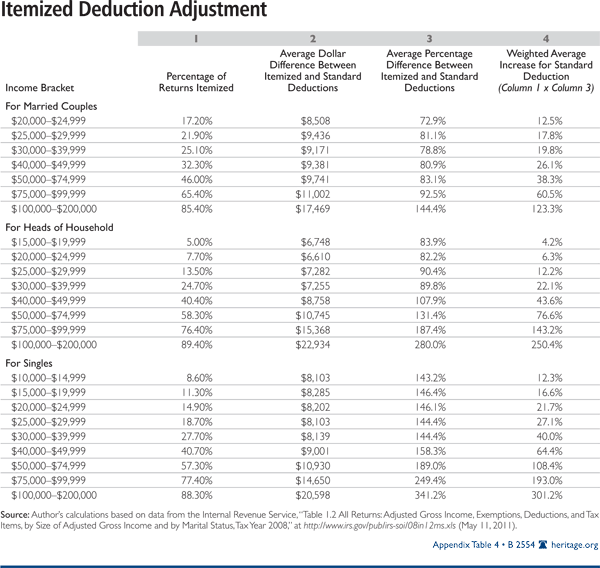
Itemized Deduction Estimates. We also made adjustments to the standard deduction to reflect the fact that many households file their tax returns with itemized deductions, not the standard deduction. As household income rises, more households benefit from filing itemized deductions, as this enables them to further reduce the income on which they pay taxes. We generated these tables from 2008 Statistics of Income tax data from the Internal Revenue Service. See Appendix Table 4. (The last column (“Weighted Average Increase”) shows the combined effect of the probability that a household in that bracket itemizes its return, and the average amount of that itemized return.)
