As President Ronald Reagan reminded the American people in his 1981 inaugural address, the U.S. Constitution separates government powers so that the voters can hold government officials accountable. Government power is separated both horizontally among the legislative, executive, and judicial branches and vertically among the federal, state, and local levels.
However, with more and more federal money flowing into state budgets, the lines of accountability are not as clear as they once were. Whom should voters hold accountable for Medicaid growth and waste when Medicaid funding comes from both the federal government and the states?
Medicaid is a case in point, but the problem is much bigger. Today, federal aid to states and state matching funds account for 45 percent of state spending, and that share is rising. As a result, state spending is gradually being reduced to the mere execution of federal spending programs. In addition to blurring the lines of accountability, this trend also erodes state fiscal independence.
Compromised Local Accountability and Priorities
These state–federal joint ventures create a number of problems. They make it difficult for voters to hold the President, Senators, Representatives, state legislators, and governors accountable. If New York spends more on Medicaid, is that because New York voters demanded that their state government expand Medicaid or because the voters gave the federal government a mandate to expand the program nationwide? If New York voters want to restrain state spending, should they turn to Albany or Washington?
Blurred responsibilities between states and the federal government also make it easier for lawmakers to sneak government-growing bills in under the voters' radar.
Another problem is the sheer magnitude of the programs. Non-discretionary spending programs demand more and more attention from federal and state lawmakers. The federal government is focusing increasingly on state priorities and, consequently, less on national defense and security. On the other hand, states are gradually losing the ability to implement innovative fiscal policies, such as tax cuts, and meet state priorities, such as education and health care, effectively.
The nature of the state–federal spending programs also creates a permanent fiscal interdependency, fiscally tying the states and the federal government together for the long haul. Even a concerted political effort to pursue an innovative fiscal strategy at the state level will run into mounting problems with federally sponsored spending mandates.
In addition, by collecting taxes to fund federal aid to states, the federal government shortchanges taxpayers in some states and rewards taxpayers in other states. This is particularly evident in federal highway funding:
Largely funded by the federal fuel tax that motorists and truckers pay when they fill their tanks, federal highway spending is distributed to the states according to a complicated mathematical formula that attempts to measure need. The formula has changed little since it was developed decades ago and today contains pervasive inequities that consistently reward some states with more money than they pay in ("donee" states) while shortchanging others ("donor" states).[1]
In other words, funding highways and programs like Medicaid through the federal government creates a fiscal detour of inefficiency and inequity.
If the present trend in federal aid to states continues, federally sponsored programs will soon eclipse state budgets and turn the federal government into the single largest revenue source for states.
Measuring State Fiscal Dependency
The problem with federal aid to states is best demonstrated by the state dependency rate—the amount of federal funds a state receives expressed as a percentage of the state's expenditures. This rate measures how deeply federal funds penetrate state finances and blur the line between federal and state spending.[2] Put simply, the rate measures how dependent states are on the federal government and the U.S. Congress.
Expenditures, not revenues, drive the state budget. Expenditures produce services for state residents and are a motivating factor behind legislative efforts to seek more and more revenues. When the federal government pays for more of a state's services, state residents become more dependent on the federal government.
In terms of fiscal commitment, state dependence on the federal government is about more than just how much money comes directly from the federal government. It is also about how much money states contribute as matching funds to secure that federal funding. In the Medicaid program, the federal government typically pays 56 percent of the total expenditures, meaning that for every $100 of Medicaid spending, a state must tax its own residents for $44.[3]
Therefore, a correct measure of the state dependency rate would account for both the $56 from the federal government and the $44 in state funds. The same holds true for other programs. However, Medicaid and the State Children's Health Insurance Program (SCHIP) dominate spending on state–federal joint ventures.
Calculations in the next section account only for state matching funds for Medicaid and SCHIP. This moderately underestimates the actual federal penetration rate. State costs for other programs are more complicated to calculate, partially because methods for reporting state budget data vary by state.
The Relentless Growth in State Fiscal Dependence
Federal aid to states is not a new phenomenon. In 1929, federal aid to states accounted for 2 percent of state consumption expenditures. It spiked in the early 1930s, increasing to 12 percent, where it remained until the early 1960s.[4]
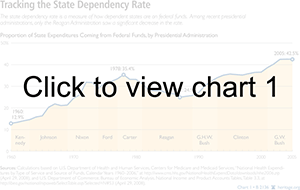
As Chart 1 shows, the state dependency rate has risen significantly over the past half-century, especially since the introduction of Medicaid in 1965. The only period with a distinct decline is the Reagan years, when it fell from a peak of 33 percent during the Carter Administration to 25 percent by the end of the 1980s.
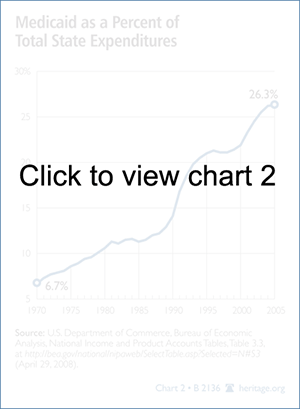
Chart 2 shows Medicaid spending as a percentage of total state expenditures since 1970, further underscoring Medicaid's role in driving the rise in state spending over the past decades.
Except for decline during the 1980s, the state dependency rate has risen steadily since 1960. According to the Census Bureau, the federal government sent $403.7 billion to the states in 2005 (the most recent year for which detailed Census data are available). That is 34 cents per dollar spent by the states,[5] putting the state dependency rate at 34 percent, not counting state matching funds. When the $136.9 billion that states spent on Medicaid and SCHIP (mostly Title XIX and Title XXI) is added, state and federal spending on state–federal joint ventures totaled at least $542.6 billion (42.5 percent of all state spending) in 2005.[6]
Perpetuating State Dependency
As mentioned earlier, when the federal government pays for state spending, it becomes difficult to identify whom to hold accountable, both for the spending and for the policy outcomes. These blurred lines of responsibility also make it easier for federal and state lawmakers to let spending grow than would be the case if each level of government was fully responsible for its own spending. This helps to perpetuate growth in both state and federal government spending.
Moreover, as states become more dependent on federal funding, they begin to lose their ability to set priorities and make policy decisions that are best-suited to their specific needs. Federal aid to states streamlines how states spend money and, consequently, how they collect their revenues. Federal aid also makes it increasingly difficult for the states to pursue different fiscal policies based on the demographic, political, and other preferences of their residents.
On top of this, the spending on state–federal joint ventures blurs the lines of accountability between federal and state lawmakers. Voters find it increasingly difficult to determine whom to hold responsible.
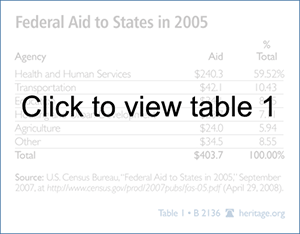
Of the $403.7 billion in federal aid to states in 2005, 60 percent went through the U.S. Department of Health and Human Services (HHS). Medicaid and SCHIP accounted for $186 billion in federal aid to states, and the Administration for Children and Families doled out another $44 billion, including $16.3 billion for Temporary Assistance to Needy Families.[7] The Department of Education reported sending $34 billion to the states, including $4.9 billion for No Child Left Behind.[8] (See Table 1.)
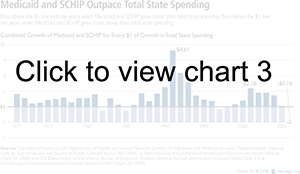
HHS and Education Department funding, which comprise two-thirds of all federal aid to states, have driven the expansion of federal aid to states for a long time. In particular, over the past 35 years, Medicaid and SCHIP have grown by $1.64 for every $1 of growth in total state spending. This growth has come in spurts as Congress added more services and expanded eligibility.[9]
The spike in Medicaid spending in 1991–1992 is a telling example of such legislative initiatives. In 1990, Congress expanded Medicaid coverage and introduced a prescription drug rebate program.[10] For the first time, all families earning up to 100 percent of the federal poverty limit were eligible regardless of whether or not they were receiving welfare under the Aid to Families with Dependent Children program.
In 1990, Congress also expanded Medicaid to cover all children up to 18 years of age. This came on top of the 1989 expansion of Medicaid coverage to pregnant women and all children under the age of six.
Politicians are the single biggest factor behind the growth of Medicaid and SCHIP. State and federal lawmakers have allowed the programs to grow: No tax revenues can be spent until a law is passed.
When laws that expand Medicaid are clustered together, the program's costs obviously rise very fast. Congress apparently realized this in 1991, when it passed bills that restricted Medicaid revenue sources and put a national ceiling on funds for Disproportionate Share Hospitals, which receive a relatively high share of Medicaid patients.[11] As Chart 3 shows, this moderated the growth in federal Medicaid funds to states.
Medicaid spending declined by 0.9 percent in 2006, but this will not help the state dependency rate. This slight reversal was caused by a one-time movement of "beneficiaries dually-eligible for Medicaid and Medicare to Medicare Part D."[12] Medicaid grew by an estimated 8.9 percent in 2007, and the Centers for Medicare and Medicaid Services (CMS) forecasts that Medicaid spending will grow an average of 7.8 percent per year over the next decade,[13] which bodes ill for increasing state reliance on the federal government.
An End to State Fiscal Independence?
A more detailed look at the state level hints at a grim future for state fiscal independence. North Carolina is a telling example. In 1997, federal funds paid approximately one-fourth of state spending. In 2007, according to a 2006 budget estimate, the federal government paid one-third of the state's expenditures.[14] If this trend continues, the federal government will become the largest revenue source for North Carolina by 2017, paying 44 percent of the state's expenditures. In 2022, federal funds will account for more than half of state revenues, with state taxes, including income taxes, providing only 41 percent of state revenues.
This extrapolation concentrates on the state's direct dependence on the federal government. If the state matching funds for state–federal programs (e.g., Medicaid) are included, North Carolina's dependency rate will exceed 50 percent much sooner.
North Carolina is just one example. State dependence on federal aid is a problem that transcends geographic and economic differences among states. In rich and poor states alike, federal money and mandatory matching funds are increasingly and ominously present in state budgets.
Conclusion
The current trend is troubling. Federal aid to states erodes legislators' accountability to voters, increases the public's and the states' dependence on the federal government, weakens incentives to restrain government spending, and even encourages state lawmakers to design and expand their spending to maximize federal aid to their states.
The accountability problem is worsened by the fact that a majority of the federal aid to states goes toward non-discretionary spending programs. These programs are meant to be perpetual and therefore constitute a permanent expansion of state and federal government. They also make it difficult for taxpayers and voters to identify who is responsible—their Senators and Representatives in Congress or their state legislators. Permanent growth in government spending makes this lack of accountability even more worrisome.
Joint state–federal spending programs also increase both individual dependence on the government and states' dependence on the federal government and federal taxpayers. State fiscal policy is increasingly tied to the execution of federal spending programs and policy priorities. With this growing dependence comes a shrinking independence in state fiscal policy, making states increasingly less able to make fiscal choices that fit their residents' needs and preferences.
Federal funds weaken incentives to restrain health care consumption. The public sees these services as "free," which leads to an open-ended demand through programs such as Medicaid and SCHIP.
Federal aid to states also distorts incentives for state legislators. They are given a reason to expand their spending—usually unwisely—to meet Washington's priorities and to maximize federal aid. Together with blurred accountability and the distorted consumer incentives, this perpetuates and aggravates state and individual dependence on federal funds.
Sven R. Larson, Ph.D., is Research Director at the South Carolina Policy Council.


