The American family is in crisis. According to the most recent data available, even before the COVID-19 pandemic, the marriage rate had dropped by more than 25 percent over the past two decades, and it only seems to have fallen further since 2020.REF Meanwhile, 42 percent of all children born in the United States are born to unwed mothers.REF Among black children, that proportion has risen to 70 percent.
There are many plausible candidates for the immediate and ultimate causes of this precipitous decline in the marriage and legitimacy rates in the United States, but policymakers should understand that welfare programs explicitly designed to help low-income families are likely making the problem much worse.
While these programs are intended to help low-income families and individuals, their design greatly contributes to the decline of the family in the United States. Either by malice or carelessness, the American welfare state is, on the whole, egregiously anti-marriage.
Most people have little understanding of the massive penalties for marriage in the welfare state today. Marriage penalties occur whenever a couple has more resources by not marrying or loses a significant part of those resources if the couple does marry. These losses are most often caused when a welfare program either has a benefit cutoff or phase-out that puts married couples at a disadvantage to unmarried couples. Federal, state, and local governments operate more than 40 means-tested programs for families with children, spending over $500 billion per year providing cash, food, housing, medical care, and targeted social services to low-income families. Nearly all these means-tested programs impose substantial marriage penalties on low-income couples.
In the income tax code, tax bracket cutoffs generally double for childless married couples filing jointly, such that most pay the same amount that they would if filing as single individuals. In other words, marriage has little effect on their overall income. However, welfare programs like the Supplemental Nutrition Assistance Program (SNAP), public housing, and the Earned Income Tax Credit (EITC) do not set cutoffs for married couples in this way, and, consequently, couples’ overall income is greatly lowered when they marry.REF To the welfare state, a woman who gets married is viewed more or less as if her individual income has doubled; getting married, even to someone with lower income, can cause a family to completely lose benefits or be caught in a phase-out.
Marriage penalties thus make marriage more expensive than remaining single. If a low-income woman marries a man of similar or moderate means, she can become ineligible for programs like food stamps and public or Section 8 housing and can lose all or most of cash benefits like the EITC. These penalties add up, reaching tens of thousands of dollars when the full set of benefits lost across all programs is calculated.
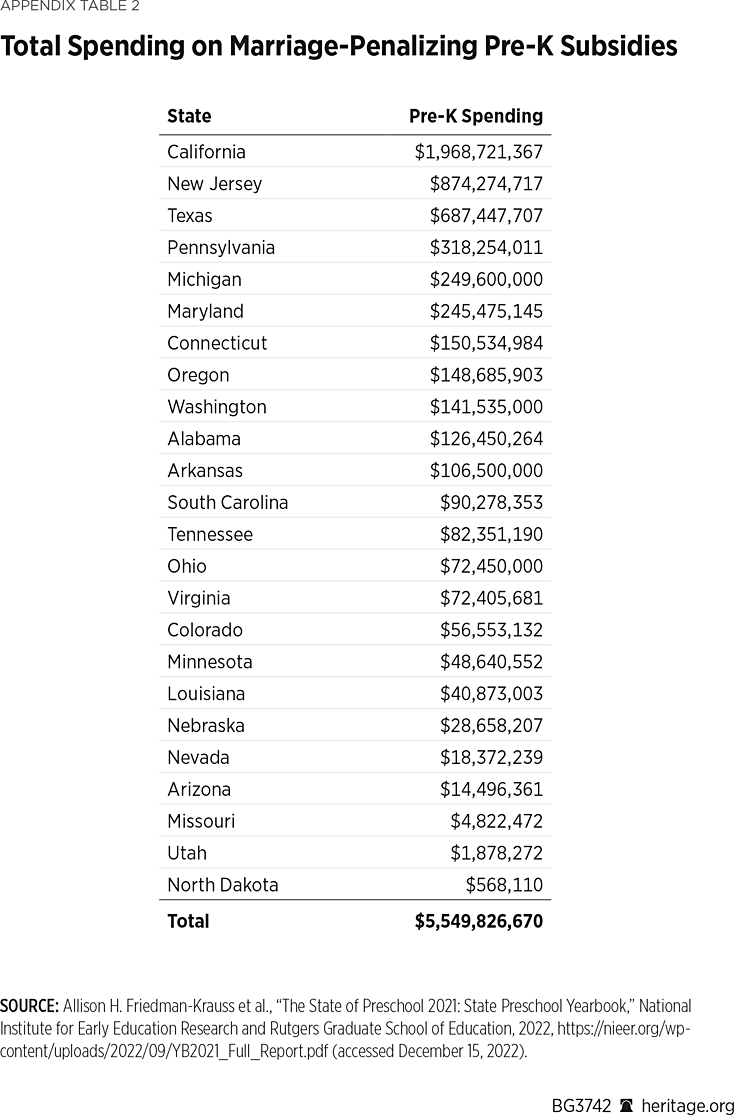
While marriage penalties in federal programs are fairly apparent, penalties also exist at the state and local level; however, the subtle nature of these marriage penalties and the myriad program structures across and within states make them difficult to detect. Indeed, many lawmakers likely are not aware that their states’ policies could be making it thousands of dollars more expensive to marry, in addition to the tens of thousands of dollars of marriage penalties already in federal welfare programs. A good case study of this phenomenon can be found in the evaluation of state-level preschool and early education programs. While these programs vary greatly across states, a striking feature across the board is the lack of attention to marriage penalties in their design.
Pre-K Education Programs: A Case Study in Marriage Penalties
Although ostensibly set up to help and support families with young children, subsidized preschool programs have largely failed to deliver high-quality education to underserved children.REF Even worse, most states’ government-funded preschool programs make marriage much more expensive for those who have children or want to start a family. In turn, these programs subsidize single motherhood and perpetuate a culture of uncommitted and absent fathers and family instability. These penalties disproportionately affect the poor, among whom family structure is already the weakest, having been degraded by over two generations of welfare policies that have neglected the basic truth that the two-parent family is the fundamental unit of human society.
It may seem counterintuitive that preschool programs might make marriage more costly, given that they are usually enacted with the intent of helping American families in the face of rising costs of childcare and preschool. Yet the design of state taxpayer-funded preschool programs in most states makes it such that many couples must remain unmarried to qualify for these resources. In other words, a low-income mother might be eligible for fully funded or partially funded preschool when single but lose this benefit if she decides to marry (even when the father is of a comparably low income level). Couples deciding whether to marry thus are faced with a difficult decision: Raise children as single parents and depend on taxpayer assistance to send them to school for little or no cost, or marry and face thousands of dollars more in costs per child per year.
Twenty-six states have marriage penalties in their free or subsidized pre-K programs.
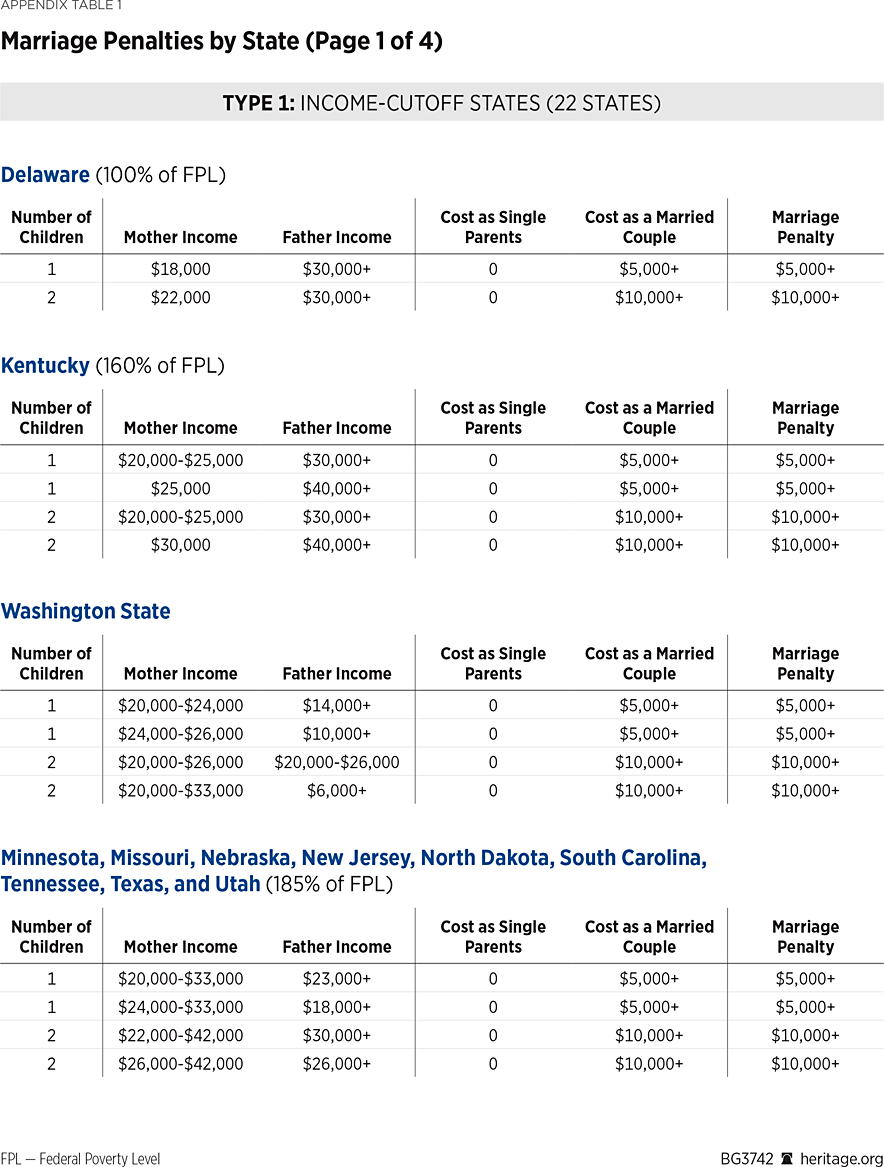
States with Income-Based Eligibility Cutoffs. The worst penalties for marriage come from states that extend free preschool up to a certain level of income with no adjustment based on whether a household is headed by a married couple. This means that couples are incentivized not to marry and that those who qualify for these programs—single or married—are incentivized to keep their income below the limits.REF In Minnesota, Missouri, Nebraska, New Jersey, North Dakota, South Carolina, Tennessee, Texas, and Utah, a single mother with one child making $20,000 to $33,000 per year would receive free preschool, but she would lose all benefits if she married a man making as little as $23,000 per year.REF That means that the couple would face over $5,000 in costs per year. (See Table 1.)REF
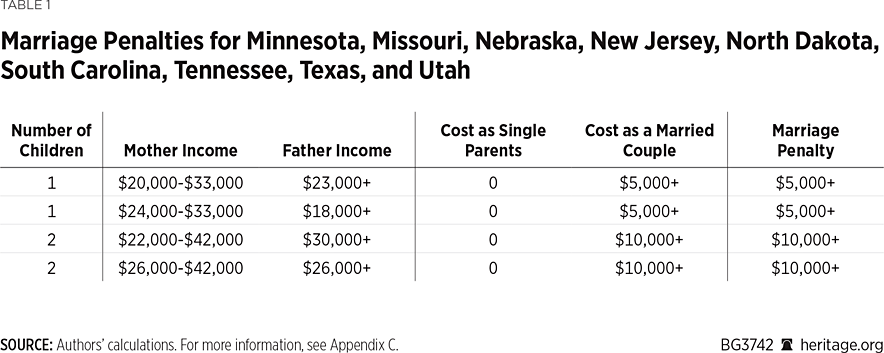
Likewise, a mother of two with an income between $26,000 and $40,000 per year faces $10,000 more in costs if she marries a man who makes a similar income. (See Table 1.) Such income levels are highly typical for low-income and working-class families.
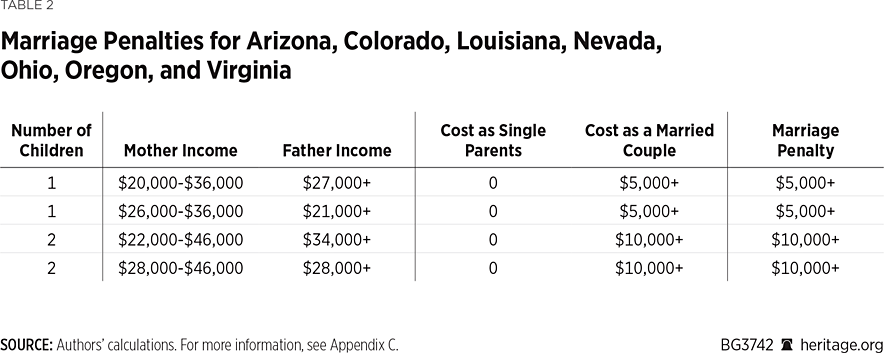
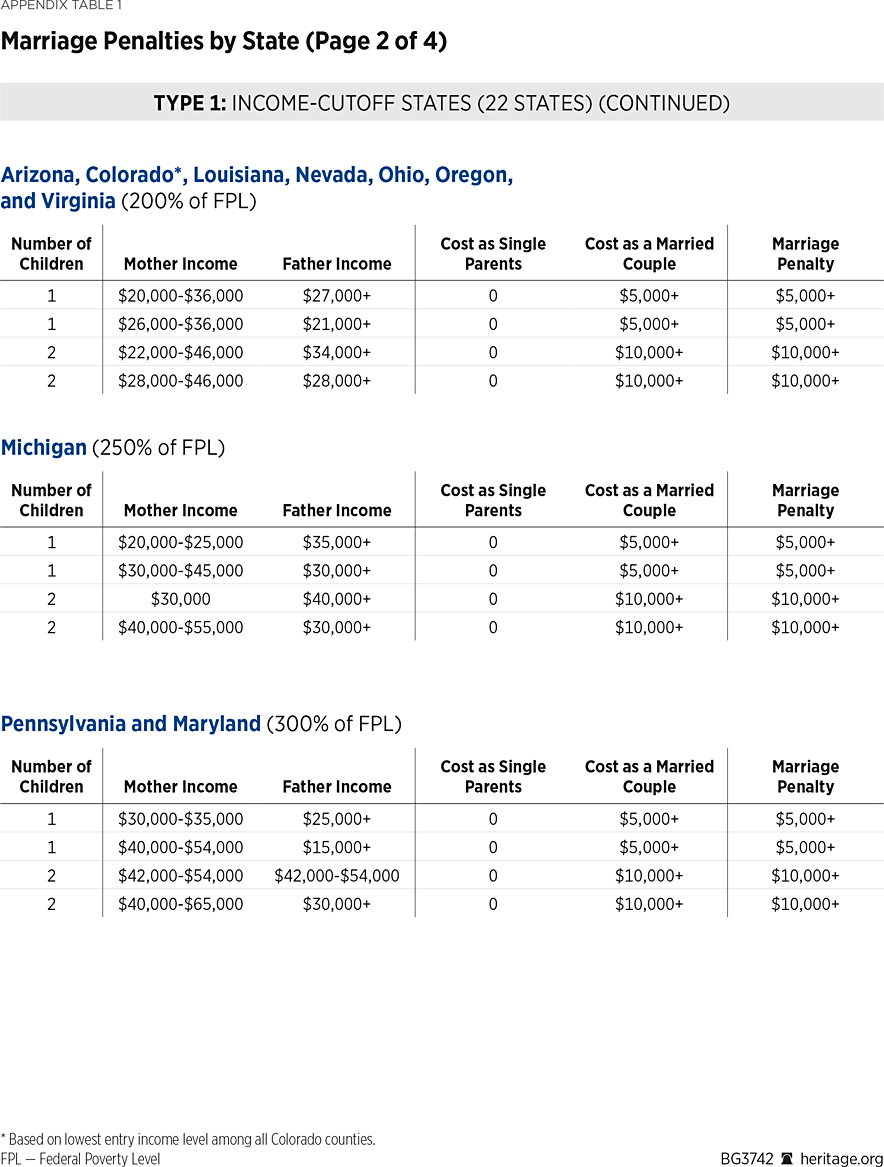
Similar penalties exist in Delaware, where each parent making between $12,000 and $18,000 per year would receive free preschool when single but not as a couple, and in Kentucky and Washington, where the same is true for couples each earning between $18,000 and $25,000 in income.REF In Arizona, Colorado, Louisiana, Nevada, Ohio, Oregon, and Virginia, a single mother of two can earn over $45,000 dollars per year (with an absent father making the same or more) and still receive free pre-K, while a married couple each earning $30,000 does not. (See Table 2.)REF
Michigan, Pennsylvania, and Maryland make subsidies available further up the income scale, meaning that even middle-class families are affected by the marriage penalty.REF
In general, these income-based cutoff designs penalize low-income married couples, discourage prospective couples from marrying, reward those who remain unwed, incentivize earners to keep their income low to keep their benefits, and put taxpayers on the hook for subsidizing single motherhood and the breakdown of the family. Marriage penalties in programs for low-income households mean that an absent father’s children can attend preschool entirely at taxpayer expense, while the average working-class married father has to pay full price. But even if income cutoffs were made fairer for married couples, hardline “benefits cliff” program designs, in which all benefits are removed after a certain income level, create incentives against work and economic mobility.
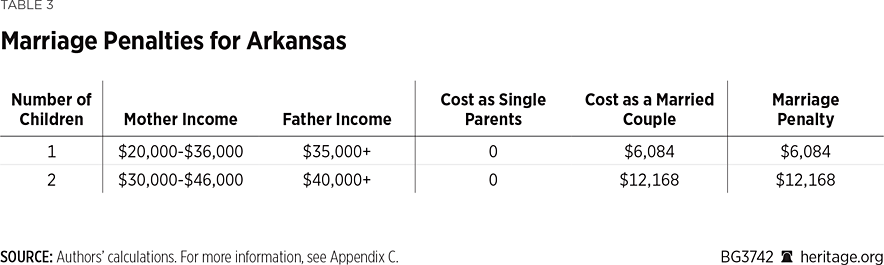
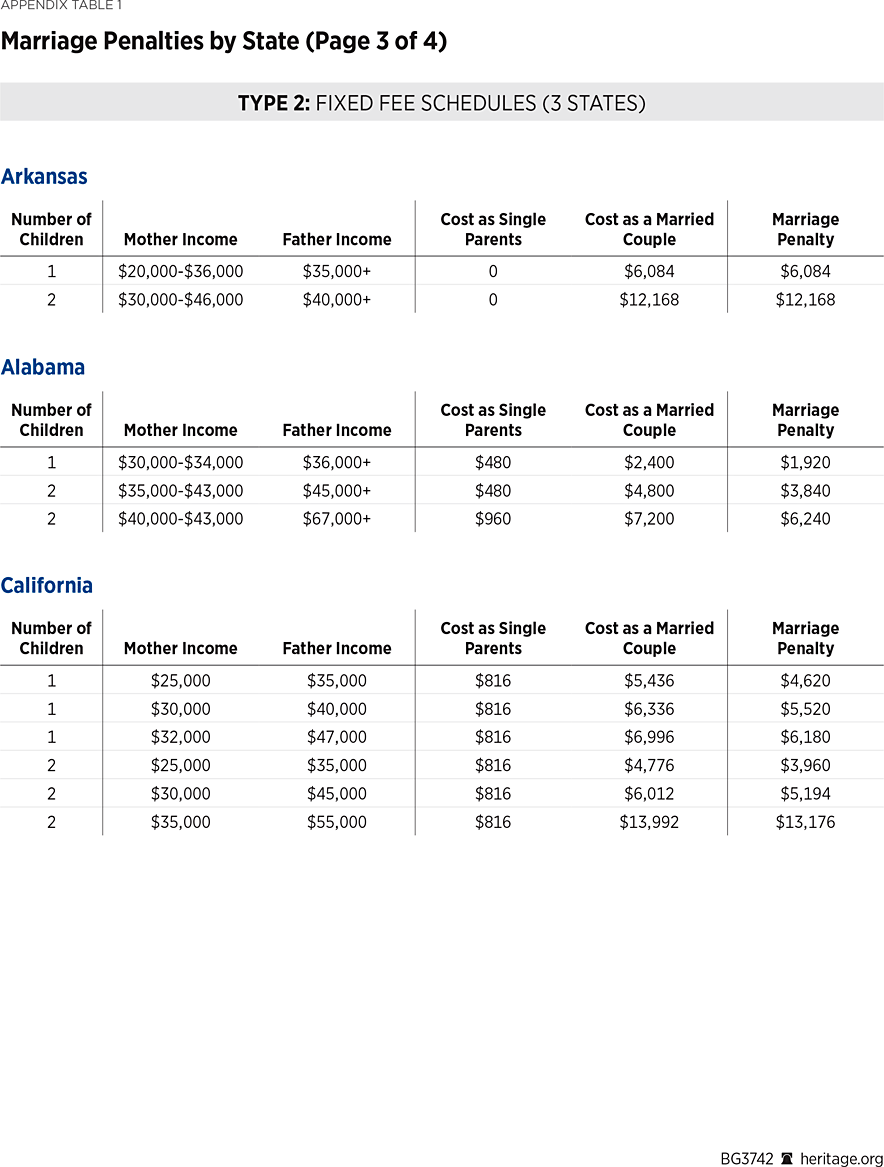
States with Income-Based Co-payments. A handful of states have policies which, on the surface, might seem better than the income-cutoff design discussed above, but which in practice still fall very short. In Arkansas, Alabama, California, and Connecticut, parents contribute some part of the cost of preschool, paying more as their income increases until they pay the full amount.REF Even under this design, however, marriage penalties remain. In Arkansas, a married couple each earning $35,000 would pay $6,084 per child for preschool every year. If instead the couple were to remain unmarried, their children’s pre-K would be entirely free. In other words, the government makes them pay an additional $6,000 per child if they get married. (See Table 3.)
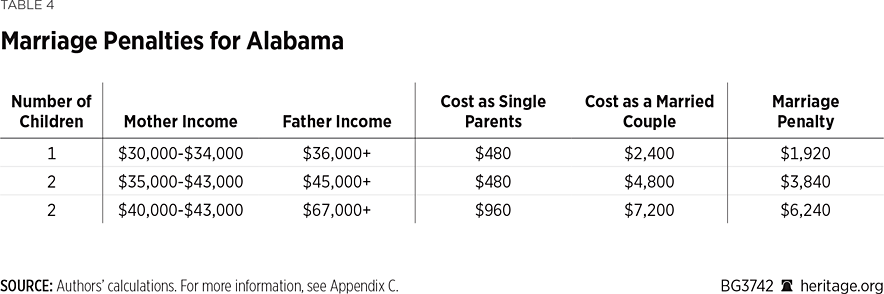
Alabama’s marriage penalty for a typical working-class family, where one parent earns $40,000 and the other parent earns $30,000, is $1,920 per child per year. (See Table 4.)
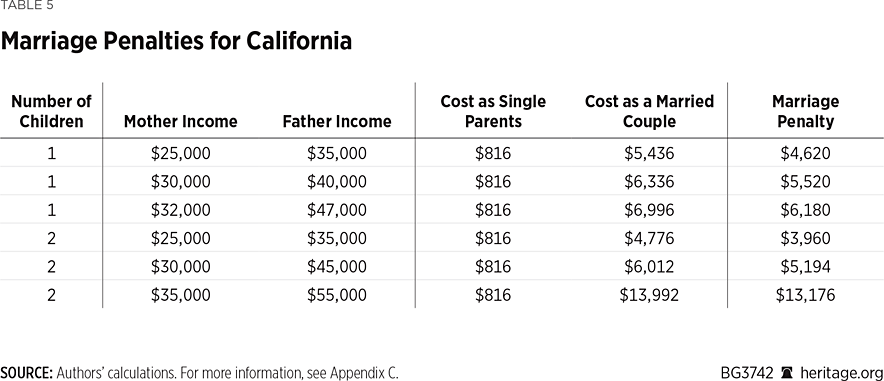
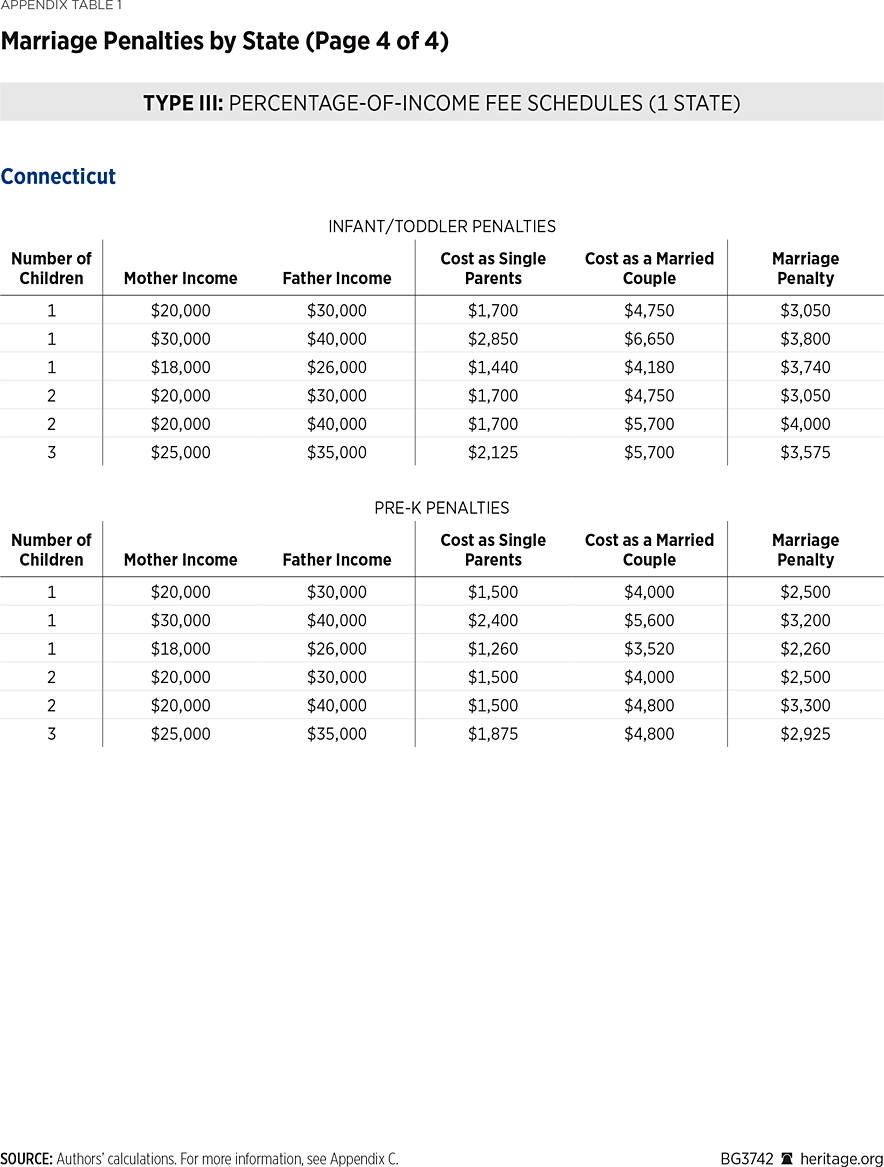
In Connecticut, that same couple would be penalized $3,200 for pre-K and $3,800 for infant and toddler childcare, a total penalty of $7,000 for a typical family. Under California’s labyrinthine fee scale, which extends these subsidies even further up the income scale, the deleterious effects of the marriage penalty are also felt among upper-middle-class families.REF A Californian married couple with one child making $40,000 and $30,000 per year incur a penalty of $5,520, and a married middle-class couple with two children making $55,000 and $35,000 per year (with dubious need for any subsidy at all) are penalized at $6,588 per child. (See Table 5.)
Thus, although these fee-based systems attempt to avoid dilemmas of a single cutoff where benefits are eliminated after a certain dollar amount, these co-payment designs are, in practice, just as anti-marriage and anti-family as most benefits-cliff systems.
The Misuse of the Federal Poverty Level (FPL) in Benefit Formulas. In all but three of these states, these anti-marriage benefit structures originate from state governments’ use of the FPL to calculate benefit cutoffs. Twenty-three states eliminate or decrease pre-K benefits after income exceeds a certain percentage of the FPL, with most states choosing a number greater than the FPL itself (averaging around 185 percent to 200 percent of the FPL).
The problem with using the FPL is that it is only adjusted for family size by a very small amount. If a single mother marries, the eligibility level for the married family will only be slightly higher; this small increase will do little to mitigate the marriage penalty. For example, the 2022 FPL for a family of three is an income of $23,030 (before taxes and in-kind welfare benefits); the level for a family of four is $27,450 ($4,720 higher).REF If a single mother with two children marries, the FPL criterion would be raised by around $4,720 by the addition of one extra family member.REF The Federal Poverty Guidelines that determine FPL-based benefit cutoffs do not distinguish between the addition of a child and the addition of a spouse, meaning that programs with cutoffs based on the FPL view a single mother who marries the same as they do one who has another child.REF An additional adult brings additional income, which means that welfare should expect income to increase more with a marriage than with a child; the increase in costs for an adult further justifies the adjustment.
Even if the state eligibility cutoff is 200 percent of the FPL, the consequent boosting of the program eligibility cutoff by $9,440 ($4,720 times two) per person in the household will do little to avoid a marriage penalty, because the husband will almost certainly bring far more than $9,440 in earnings into the family. Marriage would still make many families ineligible.
How to Lessen or Eliminate Marriage Penalties in Subsidized Pre-K Programs
If states fund preschool at all, they should ensure that their eligibility cutoffs do not penalize marriage, or at least make adjustments to reduce the penalties.REF
State policymakers should avoid an all-or-nothing structure for benefit distribution and instead implement a fee schedule or benefit phaseout that rises with income. This can reduce costs and soften marriage penalties, as benefits will phase out at higher incomes rather than drop off at an arbitrary income level (as occurs in most states’ pre-K programs).
In general, states should phase out welfare benefits gradually, so that for every additional dollar of household income above a certain level, parents pay a number of cents more for their childcare. Most important, to remove marriage penalties, states should ensure that the benefits for a married couple are equal to benefits for a single person with half the income. Marriage penalties in pre-K programs can be reduced with little budgetary cost by using fee schedules while raising the eligibility threshold for married couples. In any welfare program, if the income thresholds are doubled for married couples and the phase-out rate is halved for them, then the penalty is negligible for married couples with similar income.
Federal and state welfare programs cost over $500 billion per year operating over 40 programs providing means-tested aid to low-income families with children. Nearly all these programs have significant marriage penalties. The marriage penalties in state pre-K programs are only one component of this larger problem. Any effort to strengthen marriage in the nation must begin by reducing or removing this wide array of marriage penalties.
Reducing marriage penalties does not mean expanding the already large welfare state.REF The existing welfare system is rife with waste and fraud. Programs are often either ineffective or have harmful outcomes; however, a far worse feature of the current welfare state is that it aggressively penalizes and discourages marriage. State and federal lawmakers should eliminate wasteful and counter-productive spending and redirect the savings toward reducing overall marriage penalties.
The Impact of Removing Marriage Penalties in Government Programs
The removal of government marriage penalties from the welfare system would have an immense impact on the institution of marriage in the country, especially among low-income and working-class Americans. According to one recent study, if marriage penalties were eliminated for very low-income single mothers (those with incomes less than $26,000 per year), their annual marriage rate would increase by nearly 250 percent, rising from 9.4 percent to 23.1 percent per year. Among lower-income single mothers (those with incomes between $26,000 and $40,000 per year), the annual marriage rate would more than double, rising from 11.8 percent to 25.6 percent.REF
That kind of impact has the potential to radically renew and restore the culture of marriage among America’s most vulnerable communities, and, in turn, profoundly improve the lives of poor and working-class Americans. For example, those who marry before having children have, on the whole, a 67 percent chance of obtaining upper-class or middle-income earnings. (The only single factor with a higher associated probability is receiving a college education, at 71 percent.)REF When combined with graduating high school and obtaining full-time employment, this probability becomes 97 percent. Children raised by a single parent, meanwhile, are more likely to be convicted of serious crimes, twice as likely to drop out of high school, and 150 percent as likely to be without education or work upon reaching adulthood.REF
The positive effects of removing marriage penalties would likely be felt most among black Americans: Before the anti-marriage welfare policies of the 1960s, an estimated 78 percent of black children were raised in two-parent families. By the time the welfare reform of 1996 stopped the slide, 66 percent of black children in the United States were being raised by single parents.REF While the 1996 welfare reform stopped the decline of marriage in black communities, further pro-marriage, pro-family, and pro-work welfare reform is needed to rebuild and revitalize the culture of marriage among America’s most vulnerable.
Removing government penalties against marriage would thus strengthen and expand marriage. This would greatly improve the well-being of adults and children; in addition, it would, in all likelihood, significantly strengthen the economy. Strong and widespread marriage bolsters overall economic growth; by contrast, the decline in marriage impedes growth.
Researchers Robert Lerman, Joseph Price, Adam Shumway, and W. Bradford Wilcox have investigated the impact of family structure on economic growth.REF Comparing economic growth among states, they found that states with greater declines in the relative number of intact families had slower growth across their entire economies. Specifically, for every two-percentage-point decline in the share of parents in two-parent families, there was roughly a one-percentage-point decline in state gross domestic product (GDP) per capita. Extrapolating these figures for the U.S. economy as a whole would mean that the decline in two-parent families over the past half century has resulted in a reduction of around 5.5 percent of the 2021 annual GDP.REF This amounts to a reduction of $1.3 trillion, around $3,800 per capita in 2021 alone.
Removing marriage penalties in government programs has great potential to increase and strengthen marriage among families with children and undo much of the social and economic damage done to marriage in prior decades. This, in turn, would increase economic growth and recover at least part of the economic and societal losses generated by decades of family collapse.
Conclusion: The Promotion of Marriage
As the case study of state preschool programs demonstrates, marriage penalties in the welfare state are a hidden but serious problem. The example of government-funded pre-K shows how state policies can (perhaps unwittingly) create marriage penalties that severely discourage marriage. Even a shortcut as small and seemingly innocuous as misusing the FPL to determine income cutoffs ends up encouraging couples not to marry and putting taxpayers on the hook for subsidizing single parenthood.
The widespread existence of these penalties, and their invisibility to many policymakers, is proof that legislators at all levels of government must work to actively promote marriage through policies and consider the potential effects on marriage whenever a new policy is proposed. Policies that penalize couples for marrying subsidize single parenthood, contribute to a culture of fatherlessness, and ultimately foster the higher crime rates, lower educational attainment, aimlessness, and despair associated with children who grow up with a single mother and an absent father.REF A well-functioning welfare system should encourage citizens to work, marry, form families, and run their households as empowered, nurturing parents of the next generation of Americans. In particular, welfare programs should strive to actively support marriage, family formation, and working families with children if they expect to build back the culture of marriage which has become so clearly lost in this country, especially among the poorest and most vulnerable.
The thousands of dollars in early childhood education marriage penalties are just one component of the tens of thousands of dollars of marriage penalties in the welfare state. Virtually all means-tested welfare programs in the United States penalize people for getting married. A couple deciding whether to marry thus has to decide whether they are willing to take on the massive financial punishment that the government will demand of them each year of their marriage. In other words, bad welfare policy has made getting married tens of thousands of dollars more expensive on an annual basis, and over a lifetime couples may stand to lose out on hundreds of thousands of dollars simply because they decide to say, “I do.”
Benjamin Paris is Graduate Fellow in the Center for Health and Welfare Policy at The Heritage Foundation. Jamie Hall is Research Fellow for Quantitative Analysis in the Center for Health and Welfare Policy.
Appendix A: Marriage Penalties by State
Appendix B: Total Spending on Marriage-Penalizing Pre-K Subsidies
Appendix C: Sources for Tables 1–5 and Appendix Tables 1 and 2
Delaware
Author’s calculations, based on Allison H. Friedman-Kraus et al., “The State of Preschool 2021 State Preschool Yearbook,” National Institute for Early Education Research (New Brunswick, New Jersey: Rutgers University, 2022), p. 11 and 54-55, https://nieer.org/wp-content/uploads/2022/09/YB2021_Full_Report.pdf; “2022 Poverty Guidelines: 48 Contiguous States (all states except Alaska and Hawaii),” Office of the Assistant Secretary for Planning and Evaluation (ASPE) (U.S. Department of Health and Human Services, 2022), https://aspe.hhs.gov/sites/default/files/documents/4b515876c4674466423975826ac57583/Guidelines-2022.pdf; Grover J. Whitehurst, “What is the Market Price of Daycare and Preschool?” Brookings Institution Evidence Speaks Reports 2 No. 48 (Washington, DC: Brookings Institution, April 19, 2018), https://www.brookings.edu/research/what-is-the-market-price-of-daycare-and-preschool/; and “ECAP Partners,” Early Learning Resources (Delaware Department of Education, 2022), https://education.delaware.gov/families/birth-age-5/early_resources/ecap_partners/. Note: The Brookings report shows an average cost of preschool above $8,000, but for a couple in the average income range the average is a little over $5,000. We use this number, the amount paid for preschool by an average-income couple, to arrive at our estimate of the approximate cost of preschool; the Brookings estimate for cost is based on the amount paid by parents, so the low number for low-income families is likely a result of subsidies picking up the slack.
Kentucky
Author’s calculations, based on Kraus et al., “The State of the Preschool 2021,” p. 78-79; “2022 Poverty Guidelines,” HHS ASPE; and “Preschool,” Exceptional Children and Early Learning (Kentucky Department of Education, 2022), https://education.ky.gov/specialed/earlylearning/Pages/default.aspx
Washington
Author’s calculations, based on Kraus et al., “The State of the Preschool 2021,” p. 158-161, and “2022 ECEAP Income Eligibility Levels,” (Washington State Department of Children, Youth & Families Early Learning Division, 2022), https://www.dcyf.wa.gov/sites/default/files/pdf/eceap/ECEAPStateMedianIncomeChart.pdf.
Minnesota, Missouri, Nebraska, New Jersey, North Dakota, South Carolina, Tennessee, Texas, and Utah
Author’s calculations. For Missouri, Nebraska, New Jersey, North Dakota, Tennessee, Texas, and Utah, calculations are based on Kraus et al., “The State of the Preschool 2021,” p.103-104, 109-110, 115-118, 126-127, and 148-153; For Minnesota, calculations are based on the MN Department of Education’s “Free and Reduced-Price Economic Status Household Income Guidelines and Forms,” https://education.mn.gov/mdeprod/idcplg?IdcService=GET_FILE&dDocName=056007&RevisionSelectionMethod=latestReleased&Rendition=primary; and for South Carolina, calculations are based on the SC Department of Education’s “CERDEP Guidelines,” https://ed.sc.gov/instruction/early-learning-and-literacy/cerdep/cerdep-guidelines-21-22/.
Arizona, Colorado, Louisiana, Nevada, Ohio, Oregon, and Virginia
Author’s calculations. For Arizona, Louisiana, Nevada, Ohio, Oregon, and Virginia, based on Kraus et al., “The State of the Preschool 2021,” p. 39-40, 80-84, 111-112, 128-129, 132-135, and 156-157; and on “2022 Poverty Guidelines,” HHS ASPE. For Colorado, “Colorado Child Care Assistance Program For Families: Information for Families,” (Colorado Department of Early Childhood, 2022), https://cdec.colorado.gov/colorado-child-care-assistance-program-for-families.
Michigan
Author’s calculations based on Kraus et al., “The State of the Preschool 2021,” p. 93-96.
Pennsylvania and Maryland
Ibid., p. 136-141 and 87-88.
Arkansas
Author’s calculations, based on Kraus et al., “The State of the Preschool 2021,” p. 41-42, and “2022 - 2023 Arkansas Better Chance Sliding Fee Scale,” (Arkansas Department of Education, 2022), https://dese.ade.arkansas.gov/Offices/learning-services/arkansas-better-chance-program-abc/abc-program-forms-and-documents.
Alabama
Author’s calculations, based on Kraus et al., “The State of the Preschool 2021,” p. 35-36, and “Alabama First Class Pre-K Sliding Fee Scale,” (Athens City Schools, 2022), https://www.acs-k12.org/Page/177 (Note: These rules appear to be general but are not publicly promulgated).
California
Author’s calculations based on Kraus et al., “The State of the Preschool 2021,” p. 43-46, and “Family Monthly Fee Schedule,” Fiscal Resources: State Budget Resources Fiscal Year 2021-2022 (California Department of Social Services, 2022), https://www.cdss.ca.gov/inforesources/child-care-and-development/fiscal-resources.
Connecticut
Author’s calculations based on Kraus et al., “The State of the Preschool 2021,” p. 49-53, and “Connecticut Administered State-Funded Program General Policy B-01 Fee Schedule,” (Connecticut Office of Early Childhood, 2022), https://www.ctoec.org/wp-content/uploads/2020/02/GP_B-01_Fee-Schedule_Final-2022.pdf.


