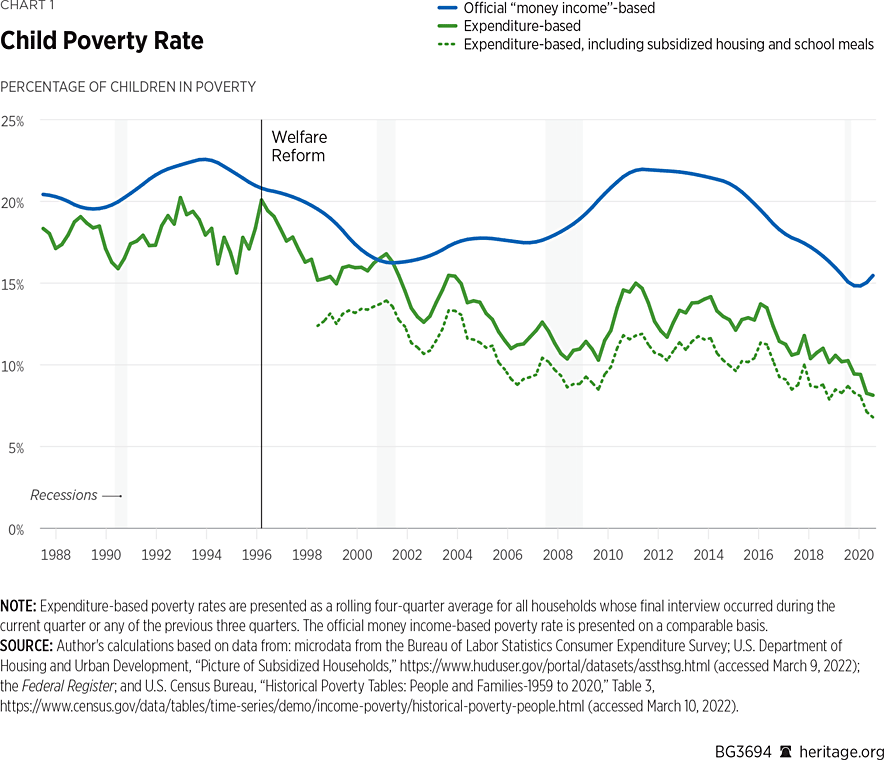
The welfare reform of 1996—officially, the Personal Responsibility and Work Opportunity Reconciliation Act, introduced the principle of reciprocity to the welfare system, requiring beneficiaries to take positive steps toward self-support in exchange for assistance.REF The overall child poverty rate had remained largely frozen for decades before welfare reform—and began to drop dramatically shortly after reform.
Children today are half as likely to live below the official poverty threshold as were children in 1996. Deep child poverty (with resources less than half the official poverty threshold) has been nearly eliminated. Among single-parent families, deep poverty fell from around 5 percent before reform to less than 1 percent today. Policymakers should reject proposals that threaten to erode the tremendous progress that has been made in the fight against child poverty over the past quarter century.
What Is Child Poverty?
Based on its most recent income survey data, the U.S. Census Bureau officially reports that 16.1 percent of children are poor, essentially the same rate as half a century ago.REF However, government surveys also show that the typical child who is identified as poor in official statistics is not poor in the sense in which the term is ordinarily understood. In fact, the average child deemed poor by the government has ample food to eat every day, receives medical care whenever needed, and lives in a heated and air-conditioned home that is neither overcrowded nor in need of repair. The average poor child’s home is replete with modern luxury electronics, such as smart phones, computers with Internet access, and wide-screen televisions with cable or satellite service. This child’s household has at least one vehicle.REF
How is it possible that these children are considered poor? The answer lies in the flawed method by which the government measures poverty. The government defines a family as poor if its “money income” falls below a specified threshold.REF However, in counting “money income” the Census Bureau excludes most cash, food, and housing resources received by the poor.
Undercounting Income. The omission and undercount of economic resources is most severe with respect to government means-tested welfare programs. Since the beginning of the War on Poverty in 1964, only about 8 percent of the combined $34 trillion that federal, state, and local governments have spent on means-tested welfare programs has been counted toward reducing official poverty.REF
The official poverty measure has other substantial problems. When Census Bureau reports on the earnings of the poor are compared to IRS and Social Security tax records for the same families, the Census Bureau is shown to undercount earnings of the poor by roughly 40 percent.REF The Census Bureau also misses “gray market” income that is earned off the books. It excludes the income of cohabiting unmarried parents, even though they clearly contribute to family resources.
Fortunately, the Census Bureau also conducts, on behalf of the Bureau of Labor Statistics, an expenditure survey, in which much of the spending enabled by welfare programs (as well as reported income and underreported or off-the-books earnings) is likely to appear. Expenditure-based poverty figures provide a more accurate and encouraging picture of child poverty trends in America. The concept of an expenditure-based poverty measure has been well developed by Bruce Meyer of the University of Chicago and his co-authors.REF The differences between the official poverty measure and the expenditure-based poverty measure presented in this report are discussed more fully in the appendix.
Child Poverty After Welfare Reform
The Personal Responsibility and Work Opportunity Reconciliation Act introduced the principle of reciprocity to the welfare system, requiring beneficiaries to take positive steps toward self-support in exchange for assistance.REF
According to the official “money income”–based poverty measure, welfare reform had little discernable effect on child poverty. Both before and after reform, the official child poverty rate was largely flat with modest fluctuations according to the business cycle. Overall, the official child poverty rate has hovered in a range between 14.0 percent and 22.7 percent since the late 1960s, generally increasing during economic downturns and for some time afterwards but eventually recovering as during the later stages of economic expansions. (See Chart 1.)

By contrast, the more accurate expenditure-based poverty measure shows that welfare reform marked the beginning of a period of substantial reduction in child poverty. Before reform, the rate is largely flat; after reform, it generally moves down. Children today are half as likely to reside in families with reported spending below the official poverty threshold as were children in 1996.
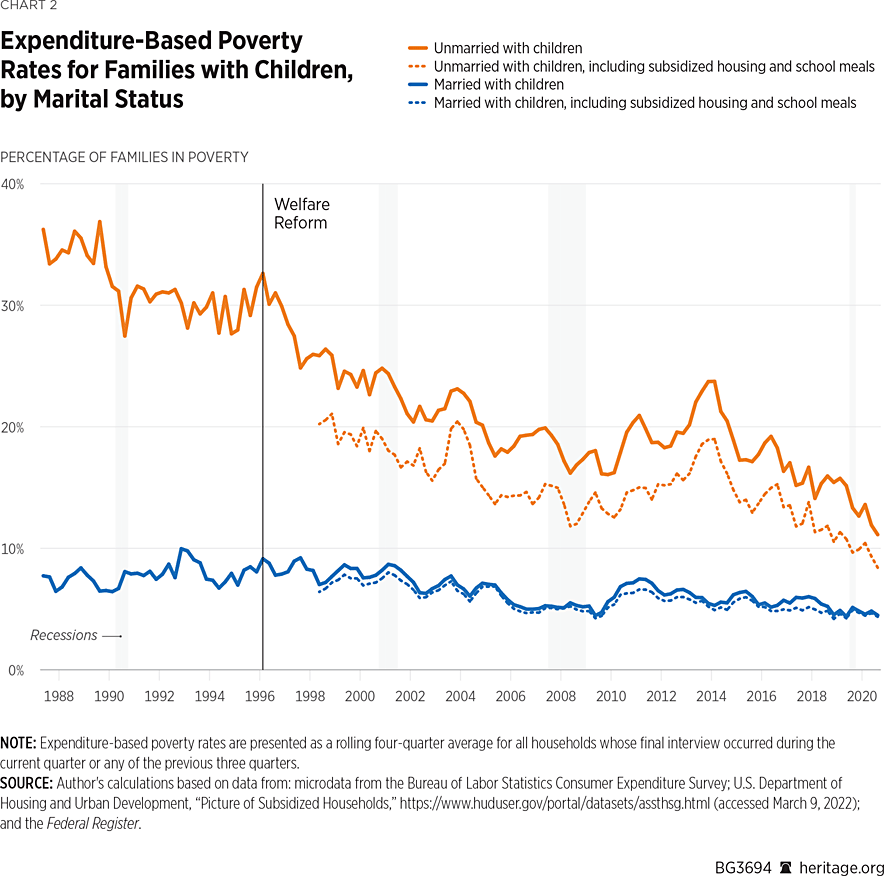
Poverty Among Single-Parent Families After Welfare Reform. The 1996 welfare reform eliminated the Aid to Families with Dependent Children (AFDC) program and replaced it with a new work-based program called Temporary Assistance for Needy Families (TANF). Some 90 percent of families in both programs were single-parent families. Therefore, the impact of welfare reform on poverty can be best assessed by examining poverty trends for these families.
Based on self-reported spending, the poverty rate among single-parent families was relatively flat before welfare reform. Immediately after reform, poverty among these families began to decline sharply, falling from 33 percent in 1996 to 11 percent today.REF If the value of subsidized housing and school meals is counted, only around 8 percent of such families are poor today. Married-parent families (who were less affected by reform) experienced smaller reductions, starting from a lower initial poverty rate. (See Chart 2.)

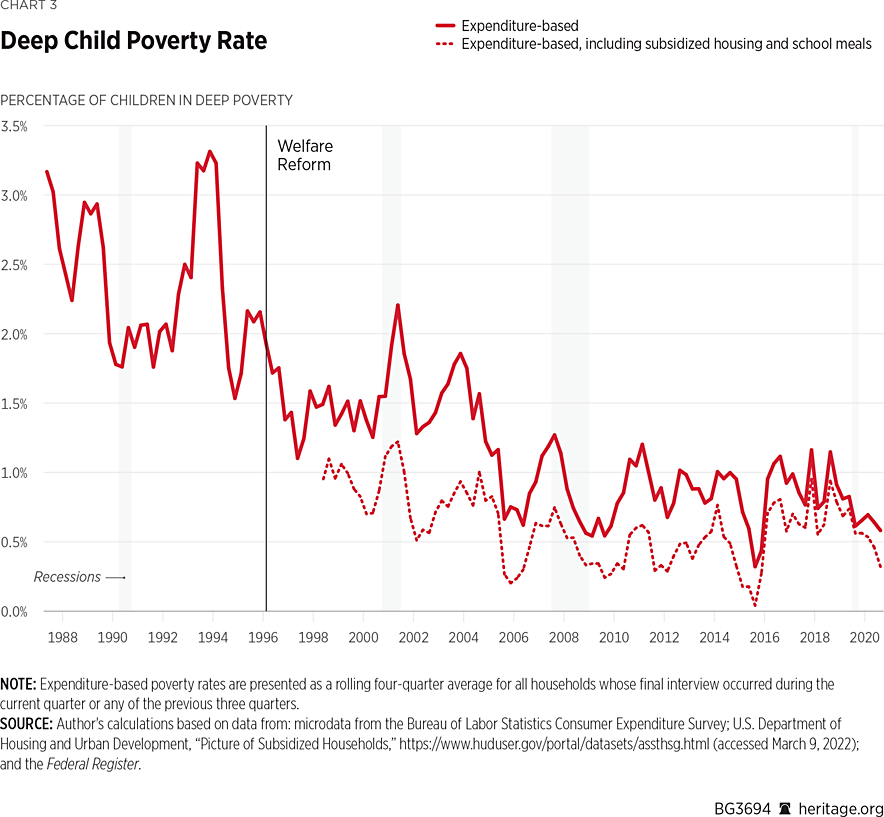
Deep Child Poverty After Welfare Reform. Some researchers who rely on income surveys have argued that, regardless of whether welfare reform reduced child poverty, the elimination of cash entitlements for nonworking parents increased the proportion of families with resources far below the poverty official threshold.REF This claim of increased deep poverty (defined as resources less than half the official poverty threshold) is refuted by families’ reported spending.
In reality, deep child poverty has been rare for a quarter of a century. It averaged 2.4 percent in the decade before welfare reform for all children and dropped sharply during the welfare reform period. Today less than 1 percent of children reside in families with reported spending below half of the official poverty threshold. (See Chart 3.)

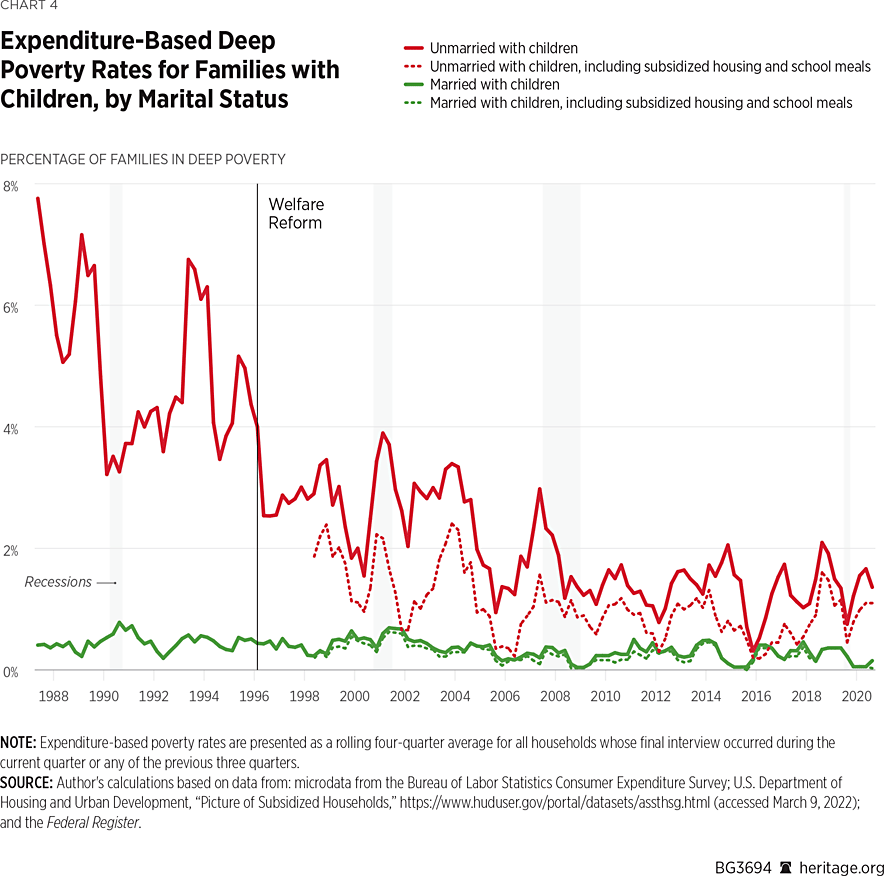
Deep Poverty Among Single-Parent Families After Welfare Reform. When considering differences by family structure, the absurdity of the claim that welfare reform harmed the poorest children becomes even clearer. The trend in deep poverty among single-parent families was relatively flat and averaged 5.1 percent in the decade prior to welfare reform. In the decade after reform, it dropped substantially and is less than 1 percent today. Among married-parent families, the deep poverty rate was already miniscule. (See Chart 4.)

Conclusion
The 1996 welfare reform introduced the principle of reciprocity into the welfare system, requiring beneficiaries to take positive steps toward self-support in exchange for assistance. The reform marked the beginning of a period of substantial reduction in child poverty, such that children today are only about half as likely to live in families with resources below the official poverty threshold as were children in 1996. Furthermore, despite the elimination of cash entitlements, there was no increase in the share of children in deep poverty.
Policymakers should reject policies that threaten to erode the tremendous progress that has been made in the fight against child poverty over the past quarter century. Recent Biden Administration proposals for a permanent child allowance, which violate the principle of reciprocity, would enable long-term dependence, undermine work and marriage, and ultimately harm poor families.REF
Jamie Bryan Hall is Research Fellow for Quantitative Analysis in Domestic Policy Studies, of the Institute for Family, Community, and Opportunity, at The Heritage Foundation.
Appendix: Methodology
Contrasting the Official and Expenditure-Based Poverty Measures
There are five major problems with the Census Bureau’s official poverty measure:
- Means-tested welfare is almost entirely ignored;
- Extensive informal or gray-market income in lower-income households is omitted;
- Even income that is reported to the IRS often is not reported to the Census Bureau;
- An arbitrary definition of the family excludes cohabiting partners and their income; and
- Annual income fluctuates and may not correspond to actual living conditions.
The expenditure-based poverty measure presented in this Backgrounder addresses each of these problems with a corresponding improvement, giving this measure five major advantages:
- Means-tested welfare may increase spending and, most likely, reported spending;
- Informal or gray-market income may increase spending and, most likely, reported spending;
- Unreported income may increase spending and, most likely, reported spending;
- Cohabiting partners and their spending are included in the family; and
- Expenditures correspond to actual living conditions better than does income.
Five Problems with the Official Poverty Measure
The Census Bureau calculates the official poverty statistics for the federal government based on responses to the “Annual Social and Economic Supplement” to its Current Population Survey (CPS ASEC).REF A nationally representative sample of households is selected to be interviewed in March each year. Individuals 15 years and older report their total annual income for the previous calendar year for each of several categories that mostly correspond to lines on IRS Form 1040. A family is deemed to be “poor” if its reported “money income” falls short of an official poverty threshold that is based on family size and structure (for example, $26,246 for a two-parent, two-child family in 2020).REF
Problem #1: Means-Tested Welfare Is Almost Entirely Ignored.REF The means-tested welfare system consists of 89 separate federal programs providing cash, food, housing, medical care, and social services to poor and lower-income people. Of the $1.16 trillion in total means-tested welfare spending in 2018, $527.5 billion was spent on families with children. Of this sum, $216.9 billion (41.1 percent) was for cash, food, and housing benefits; $254.5 billion (48.2 percent) was for medical care; and $56.1 billion (10.6 percent) was for social services. (Social Security and Medicare are not part of the means-tested welfare system and are not included in these figures.)
Official government reports consistently show high levels of poverty primarily because their statistics, for purposes of calculating poverty, omit around 92 percent of welfare spending. The Census Bureau defines a family as “poor” based on its reported “money income,” but the definition of “money income” excludes most widely available welfare benefits, such as:
- The refundable Earned Income Tax Credit (EITC);
- The refundable Additional Child Tax Credit (ACTC);
- The Supplemental Nutrition Assistance Program (SNAP, formerly the Food Stamp Program);
- The Special Supplemental Nutrition Program for Women, Infants, and Children (WIC);
- Free or reduced-price school breakfasts and lunches;
- Subsidized housing;
- The Low-Income Home Energy Assistance Program (LIHEAP); and
- Medicaid, the Children’s Health Insurance Program (CHIP), and premium assistance provided under the Affordable Care Act.REF
In addition, even in programs that are included in the concept of money income, such as TANF and Supplemental Security Income (SSI), actual benefits are substantially undercounted. Because the government excludes almost the entire welfare state when measuring poverty, it continually reports high levels of poverty.
Problem #2: Extensive Informal or Gray-Market Income in Lower-Income Households Is Omitted. Off-the-books earnings are common among low-income persons and welfare recipients. For example, an analysis conducted in the early 1990s of single mothers receiving AFDC benefits found that each month around 40 percent of mothers had off-the-books income that they did not report to the welfare office.REF Those with off-the-books income reported around $550 per month (in 2022 dollars) in hidden income.REF
The Fragile Families and Child Wellbeing Survey is a nationally representative sample of urban parents who had a child born between 1998 and 2000. The survey gives a representative cross-section of young urban fathers and mothers, both married and non-married, at all income levels. Informal employment and earnings were common.REF Between 19 percent and 32 percent of urban fathers reported informal or off-the-books earnings during a year; those with informal earnings gained an average of $11,000 in off-the-books income per year at an average effective wage rate of more than $22 per hour. Between 12 percent and 16 percent of urban mothers reported informal or off-the-books earnings during a year; those with informal earnings appear to have gained an average of $4,300 per year in off-the-books income at an average effective wage rate of $14 per hour.REF Lower-income mothers—particularly those who receive TANF—are significantly more likely to report off-the-books employment.REF
Problem #3: Even Income Reported to the IRS Often Is Not Reported to the Census Bureau. The earned income of low-income families is significantly undercounted in the CPS ASEC dataset. The Comprehensive Income Dataset Project (CID), founded by Bruce Meyer of the University of Chicago, links survey data from the CPS ASEC to administrative records at the individual level.REF Within the bottom fifth of the reported income distribution, CPS ASEC reported earnings are 32 percent lower than official tax records from the Social Security Administration (SSA) and IRS show.REF Using the CID to correct for underreported “money income,” Meyer demonstrates that one in five individuals officially classified as poor is classified as such erroneously.REF
Problem #4: An Arbitrary Definition of the Family Excludes Cohabiting Partners and Their Income. According to the Census Bureau’s official definition, “A family is a group of two people or more (one of whom is the householder) related by birth, marriage, or adoption and residing together.”REF This definition excludes cohabiting partners and parents, foster children, and others from the family and from the calculation of the family’s poverty status, regardless of how closely their finances are intertwined with other members of their household.
The Census Bureau’s narrow definition of the family is most perplexing for cohabiting parents with a common biological child. In this case, the child is a member of the family of whichever parent is designated as the householder, and the other biological parent is not even considered to be a member of the family of his or her own child, despite living in the same household. The cohabiting parent’s income is considered irrelevant to the family’s living standard and is not counted toward raising the family’s income above the federal poverty threshold.REF
Problem #5: Annual Income Fluctuates and May Not Correspond to Actual Living Conditions. Family incomes may fluctuate from year to year. If a family experiences a temporary downturn in income, it may compensate by drawing down assets or borrowing. Consequently, some families that appear to have very low incomes in a year do not appear to have very low standards of living as measured by housing, ownership of cars and other amenities, food consumption, and other variables. Official poverty statistics lump together Americans who are truly impoverished with those who are experiencing a temporary reduction in income with little or no effect on their long-term standard of living.
Five Advantages of an Expenditure-Based Poverty Measure
The Census Bureau also collects, on behalf of the Bureau of Labor Statistics, data on the spending patterns of American households via the Consumer Expenditure Survey (CEX). A nationally representative sample of households is selected to be interviewed for four consecutive quarters and asked, among other things, to report all spending by any member of the household for each month within every one of a comprehensive set of spending categories needed to calculate weights for the Consumer Price Index.REF The survey is extremely detailed and includes information on up to 484 non-overlapping categories of expenditures.REF Although the survey is conducted on an ongoing basis throughout the year, the results of all surveys pertaining to the prior calendar year are released once a year, usually in late summer.REF
An expenditure-based poverty measure based on the CEX, as presented in this Backgrounder, has advantages over the Census Bureau’s official poverty statistics in each of the five problem areas identified:
Advantage #1: Means-Tested Welfare May Increase Spending and, Most Likely, Reported Spending. Taxpayers deserve to receive credit for their contribution to poverty reduction. Yet the welfare state has largely transitioned from a system of cash payments to a system of in-kind benefits and refundable tax credits that the Census Bureau does not count as income for official poverty purposes. By contrast, the CEX counts the money that the household reports spending regardless of the source of that income, so the additional purchasing power that welfare aid provides to the family is reflected more accurately.
Advantage #2: Informal or Gray-Market Income May Increase Spending and, Most Likely, Reported Spending. The recipients of off-the-books income are unlikely to report it on government surveys. However, this off-the-books income is likely to show up if the family reports its spending accurately, so the CEX better captures off-the-books income than does a simple survey of self-reported income.
Advantage #3: Unreported Income May Increase Spending and, Most Likely, Reported Spending. Those who omit income from the CPS ASEC that is reported to the SSA and IRS may simply have inadvertently provided an incorrect response to a survey question, with no ill intent. When such a family receives a large portion of its income from a single source, it is likely that its omission would result in the family being erroneously classified as poor. However, a similarly well-intentioned CEX survey respondent, attempting to report spending accurately across a multitude of categories, is less likely to omit a substantial share of total expenditures and therefore is unlikely to report so little spending that the family is incorrectly classified as poor.
Advantage #4: Cohabiting Partners and Their Spending Are Included in the Family. The Census Bureau ignores the incomes of cohabiting partners for purposes of calculating poverty. By contrast, the CEX generally counts cohabiting adults as part of the same “consumer unit.” The Bureau of Labor Statistics considers how members of the household share their housing, food, and other expenses when classifying cohabiting couples and other relationships that are not based on blood, marriage, adoption, or other legal arrangements. People who pool their income to make joint spending decisions are considered to be a part of the same consumer unit.
Advantage #5: Expenditures Correspond to Living Conditions More Accurately than Does Income. Bruce Meyer of the University of Chicago and James Sullivan of the University of Notre Dame present a compelling case that if the goal of a poverty measure is “to identify the most disadvantaged and to assess changes over time in disadvantage,” the Census Bureau’s official money income–based poverty measure is less accurate than a consumption-based measure.REF For a given number of “poor” persons, those defined as poor by a consumption/expenditure measure are far more likely to have lower standards of living than are members of the similar-size group defined as poor by an income measure. For example, compared to the income-based poor, the expenditure-based poor tend to live in smaller homes, are less likely to own their homes, drive less expensive cars, are less likely to have health insurance, and are less likely to have a college degree. Overall, the expenditure-based poor appear to be worse off than the income-based poor on 21 of 25 indicators, providing strong evidence that the expenditure-based poverty measure captures the real standard of living more accurately.


