Abstract: North Carolina has a long record of support for open markets, and recent trade agreements have benefited its citizens. Foreign trade—exports and imports—is responsible for more jobs in the state than the textile, apparel, and furniture industries combined. Despite these facts, North Carolina’s congressional delegation seems to be rejecting its free-trade heritage. (In 2011, all but one member of the state’s congressional delegation voted against the U.S.–South Korea Free Trade Agreement.) Primarily, this is due to the influence of the state’s large textile and apparel industry seeking protection from lower-cost imports. Every Member of Congress who is facing a vote on trade-related legislation should consider the impact of that legislation on every worker and family in his state, not just on a limited sector. Everyone benefits from less-expensive goods and more jobs. North Carolina can best represent the interests of its citizens by rejecting protectionist policies and returning to its free-trade roots.
Economist Walter Williams once described the primary challenge facing free-traders: It is unreasonable to expect even principled politicians to vote for good economic policies if those votes amount to political suicide.[1] Opponents of increased trade have often successfully convinced politicians that votes for free trade are career killers. But even in states where opposition to free trade has been the strongest, the benefits of trade more than compensate for the costs. One such case is North Carolina.
North Carolina has a long and honorable record of support for open markets, which has resulted in hundreds of thousands of jobs for its citizens. But more recently, when it comes to significant trade policy, North Carolina’s congressional delegation seems to be rejecting that heritage. Last year, all but one member of the state’s congressional delegation voted against the U.S.–South Korea Free Trade Agreement (KORUS). In explaining his “no” vote, Representative Howard Coble (R) said the following:
When I was first elected, my bread-and-butter issues were tobacco, furniture and textiles. Well, all three are beleaguered now. I had to vote “no” because my textile folks were opposed to it. My mama was a textile worker. So when I talk about textile legislation, I’m thinking about my mama. And the textile people have been mighty good to me.[2]
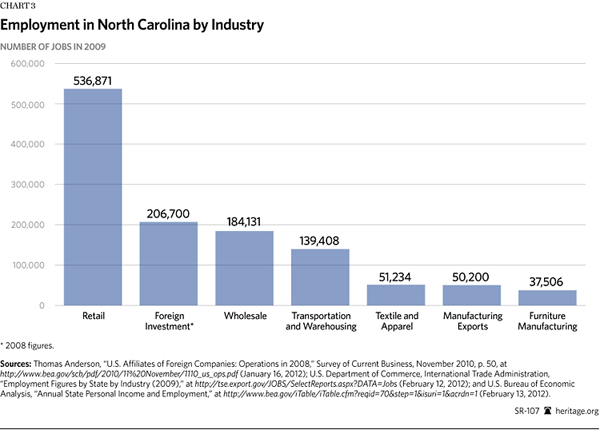
All politics, it is often said, is local, so Coble’s decision may seem like the right one for one group of workers. Yet many more of his constituents will benefit from the increased opportunities that greater openness to trade and investment will create. Already, according to state and federal statistics, some 200,000 North Carolinians owe their jobs to foreign direct investment; 50,000 people manufacture goods destined for foreign markets; 40,000 people work at the state's ports; and 530,000 people work at places where foreign goods are sold.[3]
The recently enacted U.S. free-trade agreements with Colombia, Panama, and South Korea will benefit North Carolina’s workers and economy even more. Between 2009 and 2010, North Carolina’s exports to these three countries grew over 22 percent. The Business Roundtable reports that over 1,500 North Carolina jobs depend on exports to South Korea alone.[4] The U.S.–Korea Business Council estimates that implementing KORUS will generate 8,000 more jobs.[5]
North Carolina’s congressional representatives can best represent the interests of all their constituents by rejecting protectionist policies and returning to the state’s free-trade roots.
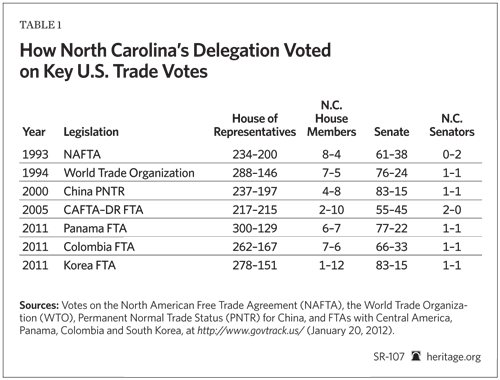
North Carolina’s (Un)Free-Trade Votes
In 2011, Congress overwhelmingly approved free-trade agreements (FTAs) with Colombia, Panama, and South Korea. On average, the FTAs received support from 76 percent of the Senate, and from 65 percent of the House. Yet, support from the North Carolina delegation was much weaker. While Senator Richard Burr (R) supported all three agreements, Senator Kay Hagan (D) voted against all three, for a 50/50 split.[6] In the House of Representatives, North Carolina’s legislators voted “yes” just 36 percent of the time. Representative David Price (D) was alone in supporting all three FTAs. Six of North Carolina’s Representatives voted against all three agreements.
This weak support for trade was not a complete surprise. Heritage Foundation analysis of recent congressional votes on trade legislation shows that North Carolina’s delegation has been among the most protectionist in the country.[7] Heritage staff used Members’ trade votes from 1997 to 2008, as reported by the Cato Institute, and calculated an average score for each state. North Carolina’s Representatives and Senators averaged free-trade scores 25 percent and 39 percent lower than the national average, respectively. During this same time frame, North Carolina ranked among the 10 most protectionist delegations in both the Senate and the House.[8]
North Carolina’s Free-Trade Roots
The anti-trade posture of North Carolina’s legislators in recent years stands in contrast to the state’s free-trade roots.
Early Trade Policy. In the early days of the United States, the state of North Carolina strongly supported free trade. It relied on foreign markets to sell its agricultural products. At that time, cotton, tobacco, and rice from North Carolina, South Carolina, and Virginia accounted for about two-thirds of all U.S. exports.[9] In addition to providing products for overseas markets, free trade allowed Southerners to buy low-cost imports.
As a result, North Carolina’s legislators usually opposed high tariffs. The peak of North Carolina’s opposition to protectionist policies occurred in 1828, when Congress passed the Tariff of Abominations, raising tariffs to unprecedented levels. Every Member of Congress from North Carolina voted against the tariff. The Tariff of Abominations was widely viewed as an unconstitutional abuse of federal power, because it was intended not just to raise revenue for the federal government, but to protect certain industries from international competition.[10]
Growing Competition. Following the Civil War, textile manufacturers based in New England migrated to Southern states to take advantage of lower labor costs.[11] This trend continued even after World War II. Northern textile factories lost nearly 300,000 jobs between 1950 and 1970. By that time, one-third of all U.S. textile employment was based in North Carolina, with some 280,000 North Carolinians working in its textile mills.[12]
Over time, textile and apparel manufacturers in the state faced growing competition from overseas imports, and adopted new technologies enabling their workers to be more productive. But, just as these industries had once moved from New England to the South, where wages were lower, the state’s textile and apparel manufacturers also increasingly moved jobs overseas. From 1970 to 1985, increasing imports and the productivity gains from technological changes reduced the number of textile jobs by 155,000 nationwide—one-fourth of total textile employment.[13] This trend continues.
But in other sectors, international trade has fueled North Carolina businesses from pork producers to biotech firms. Imports include sugar for Krispy Kreme doughnuts and products that support jobs in the transportation, retail, and wholesale industries. Foreign investment from companies like Daimler Trucks, Electrolux, and Syngenta also supports thousands of North Carolina jobs.
Trade Benefits North Carolina Businesses. Recently implemented trade agreements have benefited North Carolina. For example, since the U.S.–Chile trade agreement entered into force in 2004, North Carolina’s exports to Chile have grown by 170 percent. Since the U.S.–Singapore trade agreement entered into force in 2004, North Carolina’s exports to Singapore have grown by 88 percent.[14] According to the U.S. Chamber of Commerce, total U.S. exports to countries with which the U.S. has FTAs grew three times faster than exports to non-FTA countries from 1998 to 2008.[15]
Flow Sciences, Inc., a 17-year-old manufacturing company in Leland, North Carolina, founded by Vietnam veteran Ray Ryan, is a good example of the benefits of openness to trade. Flow Sciences, which received the 2009 U.S. Department of Commerce Export Achievement Award, employs about 30 people. For years, it focused primarily on the U.S. market; but in 2001, it began to look for customers overseas. Its exports rose from less than 5 percent of its business that year to over 20 percent in 2010.
Flow Sciences vice president Steve Janz was asked how the recent recession had affected the company’s business. “From 2008 into 2009,” he replied,
most companies in our industry were looking at sales that were down as much as 15 percent. We were slightly up in the same time period and then were hit by the recession in late 2009. Early in 2010 we had to reduce work days and lay off workers. If we were not able to export our goods, things would have been even uglier.
Janz also commented on the need to compete globally:
There’s no owner’s manual for this. But we weren’t going to grow in California or the East Coast, so the only thing to do was grow in the rest of the world. Small businesses with some elbow grease can in fact be successful overseas.[16]
Today, exports are responsible for more jobs in North Carolina than ever. As of 2009, North Carolina’s exports amounted to $21.8 billion—including $1.9 billion in textile and apparel exports. That is six times greater than all textile and apparel production in the state.[17] During the past 10 years, North Carolina’s level of exports has increased by nearly 50 percent.[18]
Trade Benefits North Carolina Ports and Shippers. More than $67 billion was imported to or exported from North Carolina in 2010, and someone had to load, unload, and deliver this cargo. From 2002 to 2011, the volume of shipments passing through the ports of Wilmington and Morehead City increased by 52.5 percent, from 3.6 million tons to 5.5 million tons. Many people might be surprised to learn that the volume of goods exported to China through these ports is much larger than the volume of goods imported from China.[19]
Port activity directly supports 41,100 jobs for longshoremen, dockworkers, warehouse operators, and others.[20] The people working at these ports are not just unloading imported products. In 2011, exports to the ports’ top-10 trading partners were two-thirds higher than imports.[21]
U.S. trade agreements helped create these jobs. According to a report prepared for the North Carolina State Ports Authority, “The role of trade barriers is worthy of mention because the signing of free-trade agreements help[s] to generate more cargo potential overall.”[22]
Trade Benefits North Carolina Agriculture Industries. U.S. agricultural exports have doubled since 2001.[23] In 2011, agricultural exports were the highest in U.S. history.[24] In North Carolina, agricultural exports increased by 79.4 percent between 2001 and 2010. As of 2009, over 30 percent of the state’s agricultural production was purchased by customers in other countries.[25]
Economic growth in developing countries like India and China offers increasing opportunities for the livestock and poultry producers of North Carolina. According to Agriculture Commissioner Steve Troxler:
The Chinese market is among the fastest-growing in the world, and our farmers produce many commodities that the Chinese are looking to buy. This is an excellent opportunity for North Carolina growers to gain new contracts in a marketplace with tremendous potential for growth.[26]
North Carolina is the country’s second-largest pork-producing state. In the pork industry alone, 4,925 jobs are supported by exports.[27] Overseas markets also welcome the state’s poultry, sweet potatoes, and specialty products, such as Raleigh-based Bone Suckin’ [Barbecue] Sauce, which is exported to 60 countries.[28]
As in the 1800s, cotton is one of North Carolina’s biggest agricultural exports. The United States is the world’s leading cotton exporter, with foreign textile and apparel manufacturers buying nearly half of U.S.-grown cotton.[29] In 2007, North Carolina farmers produced $211.1 million worth of cotton, of which $171.6 million—81 percent of total cotton production—was exported.[30]
Foreign Direct Investment Benefits North Carolina’s Workforce. In 2009, foreign direct investment was responsible for 5.9 percent of jobs in the state[31]—25.5 percent higher than the national average. North Carolina ranks in the top 10 states both for the total number of jobs created by foreign direct investment and the percentage of the population who work for foreign companies.[32] Over 206,000 people are employed by companies ranging from Aegon USA to Zurich North America, and nearly 97,000 of these jobs are in manufacturing.[33]
Swedish appliance manufacturer Electrolux, for example, is bringing at least 738 jobs to Charlotte, its North American headquarters.[34] In January 2012, Germany’s Daimler Trucks announced plans to add 1,101 jobs in Rowan County, another 100 jobs in Gastonia, and the company recently added a second shift at its 1,400-employee Mount Holly location.[35] Switzerland’s Syngenta Biotechnology, Inc., which employs over 400 people, is pouring $71 million into a new biotech facility in Research Triangle Park in the Raleigh-Durham–Chapel Hill region.[36]
Trade Barriers Raise Prices and Destroy Jobs. The U.S. sugar program illustrates how trade barriers benefit special interests at the expense of consumers and productive companies. A relative handful of U.S. sugar producers have convinced Congress to impose high tariffs on imported sugar under a complex tariff-quota program. As a result, companies, such as Winston–Salem-based Krispy Kreme and Charlotte-based Carolina Foods and Snyder’s–Lance, are forced to pay significantly inflated prices for sugar. In 2011, refined sugar cost 56.2 cents per pound in the United States; it cost 31.7 cents per pound in the rest of the world.[37]
For industries that use sugar as an input, high sugar prices are job-killers. According to the U.S. International Trade Commission, many U.S. manufacturers of products that contain sugar have relocated to Canada or Mexico in order to avoid U.S. restrictions on sugar imports.[38] Over 10,000 people in North Carolina work in bakeries and other businesses that are less competitive because U.S. trade barriers force them to pay inflated prices for sugar.[39]
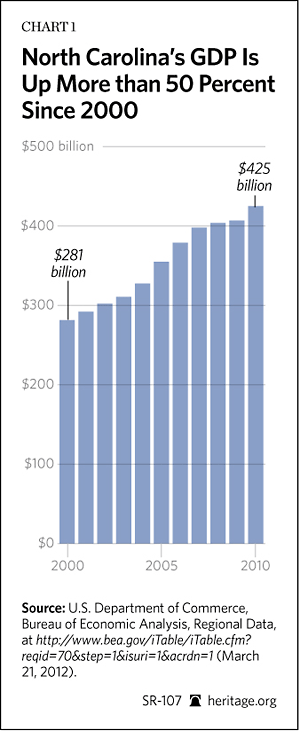
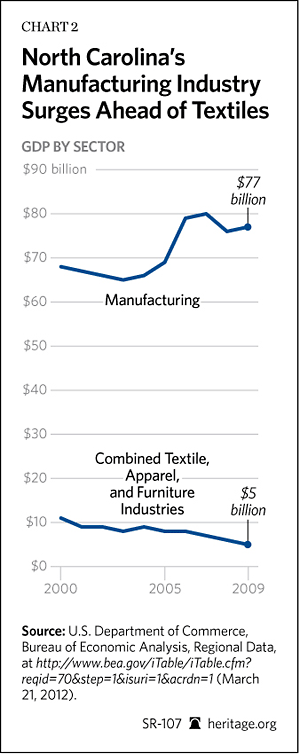
North Carolina’s Economy. In 2009, textile, apparel, and furniture industries contributed $5.2 billion to North Carolina’s gross domestic product (GDP), down 50 percent from 2000, and representing just 1.3 percent of the state’s economic output. However, as these industries were declining, others prospered. North Carolina GDP in 2009 was 44.6 percent higher than it was in 2000 (16.3 percent higher after accounting for inflation).[40]
Yet Senator Kay Hagan attributes her vote against the free-trade agreements with Colombia, Panama, and South Korea to previous “unfair” trade agreements that allegedly cost North Carolina hundreds of thousands of manufacturing jobs:
Unfair trade agreements have contributed to the loss of more than 286,000 North Carolina manufacturing jobs in the last decade—the fourth-largest decline in the nation. It is time we start protecting jobs here at home.[41]
But the fact is that manufacturing output in North Carolina was 21 percent higher in 2007 than in 2000, after adjusting for inflation. Even after the recession hit, the state’s inflation-adjusted manufacturing GDP remained higher than it was in 2000. According to the U.S. Department of Commerce, 50,200 people in North Carolina are directly employed making products to be exported to other countries.[42] Overall, state officials estimate that exports support nearly 350,000 North Carolina jobs.[43]
It would be a mistake for North Carolina’s elected officials in Washington, D.C., to focus their policy decisions solely on the relatively small sectors of textile, apparel, and furniture manufacturing at the expense of an increasingly high-tech, export-oriented manufacturing sector. The state’s biotechnology industry, for example, employs more people than do the textile and apparel industries combined, and it pays on average about $75,000 per year.[44]
More Trade Means More Jobs. International commerce supports hundreds of thousands of North Carolina jobs, including jobs in industries that export to foreign markets, those that rely on imported inputs, and in the retail, wholesale, and transportation industries. Employment in these industries has been aided by lower transportation costs, new technologies, and trade agreements that lowered U.S. and foreign trade barriers.
Even after accounting for lost textile, apparel, and furniture jobs, nearly 315,000 more people were working in North Carolina in 2009 than in 2000.[45] As of 2009, 98.3 percent of people working in North Carolina were employed in industries other than textile, apparel, or furniture manufacturing.
But the most recent data suggest that foreign markets are increasingly important even to those textile, apparel, and furniture industries. From 1999 to 2007, before the global economic downturn, exports of North Carolina textiles, apparel, and furniture increased by 25.5 percent. By 2009, exports of North Carolina textiles, apparel, and furniture totaled $2 billion.[46]
In fact, after adjusting for inflation, output per worker in North Carolina’s textile and apparel industries increased by more than 60 percent between 2000 and 2009.[47] As the president of Glen Raven textile mills, Allen Gant, observed, “If somebody can do it cheaper somewhere else, then for gosh sakes, let them have the business…. Costs are important—don’t get me wrong, we work hard on our costs—but it’s really the innovation that makes a difference.”[48] Bruce Cochrane, the president of Lincolnton Furniture, recently recognized by President Obama for his imminent plans to hire 130 new employees, believes that a variety of factors make North Carolina furniture manufacturing a good investment. These include rising wages in China, the high productivity of U.S. workers, and the lower cost of shipping furniture from Lincolnton instead of from China.[49]
Protectionism: An Outdated and Failed Strategy
The textile and apparel industries are two of the few sectors of U.S. manufacturing that receive significant ongoing protection from foreign competition. Together, they account for less than half of 1 percent of U.S. GDP and employment, yet duties on textiles, apparel, and shoes account for nearly half of U.S. tariff revenue.
The average U.S. tariff rate for textile and apparel products is 8.5 percent, while the average tariff for all other products is just 1 percent.[50] In 2010, Americans paid $10.6 billion in tariffs on textile and apparel products, the equivalent of about $23,000 for every textile and apparel job. North Carolina’s share of import duties in 2010 was $326 million, more than $6,400 for each North Carolina textile and apparel employee.[51]
These tariffs are especially harmful to poor consumers in North Carolina and across the country. Ed Gresser at Progressive Economy calls the U.S. tariff system “easily America’s most regressive tax.”[52] Americans are routinely penalized by higher prices resulting from double-digit tariffs on products like shoes and T-shirts.
As a University of North Carolina report on the state’s textile industry concluded, lawmakers should not attempt to pick winners and losers through protectionist trade policies:
We are skeptical that demands for trade barriers hold substantial long-term promise…. The long-run consequences of competition, whether from domestic or foreign-owned companies, are very positive, and inhibiting the adjustments occasioned by competition should be undertaken with great caution. There is fairly clear evidence that competition in well-functioning markets produces stronger companies, better products, and great benefits to consumers, principally through lower prices. Anti-competitive behavior is anathema to society, whether it involves domestic or foreign-owned companies, and it calls for appropriate responses from elected and appointed government officials. In the end, we think it is better to bet on the skill, flexibility, and adjustment of U.S. companies to a new business environment.[53]
That philosophy of flexibility and the ability to innovate in a “new business environment” is reflected in the state’s public–private partnership to revitalize the old Pillowtex manufacturing plant in Kannapolis. Five years after it shut down and forced 4,800 people to look for new work, it has re-opened as the $1.5 billion North Carolina Research Campus (NCRC).[54] The plant now houses “a world class research hub where collaborative science will lead the charge for great discoveries in nutrition, health and biotechnology research.”[55] Monsanto, General Mills, and Dole Food Company are some of the companies located on its campus to take advantage of the latest technologies.
Recovering NC’s Free Trade Roots
In recent decades, North Carolina’s representatives in the U.S. Congress have been relatively hostile to U.S. trade liberalization. Primarily, this is due to the influence of the state’s large textile and apparel industries seeking protection from lower-cost imports. Yet even as these politicians have been seeking to block markets from competition, some sectors of the state’s economy have been thriving in the global marketplace. Every Member of Congress who is facing a vote on trade-related legislation should consider the impact of that legislation on every worker and family in his state, not just on one sector. Everyone benefits from the lower-priced goods and the increased number of jobs that go hand in hand with free trade agreements. In the 1800s, North Carolina’s congressional delegation strongly opposed protective tariffs as unconstitutional. Today, their successors should return to their state’s free-trade roots and champion trade policies that will help bring greater prosperity to all the citizens of that great state.
— Bryan Riley is Jay Van Andel Senior Analyst in Trade Policy in the Center for International Trade and Economics at The Heritage Foundation.


