Chairman Nass, Vice-Chairman Wanggaard, and members of the Committee on Labor and Government Reform, thank you for inviting me to testify. My name is James Sherk. I am a Senior Policy Analyst in Labor Economics at The Heritage Foundation. The views I express in this testimony are my own, and should not be construed as representing any official position of The Heritage Foundation.
Wisconsin is considering a right-to-work (RTW) law. RTW prevents unions from forcing workers to pay dues as a condition of holding their job. Liberals contend RTW would lower wages in Wisconsin. Today I would like to explain to you why they are wrong.
Economic theory holds that unions operate as labor cartels. Unions only raise wages for their members by raising prices and reducing job opportunities for non-union workers. Few economists believe unions increase overall living standards.
Unions have responded with empirical research finding right-to-work states have lower wages. However, this research used statistically biased methods to control for costs of living. Correcting this reveals right-to-work laws have little effect on private-sector wages. Controlling for other factors, right-to-work states also have 1.3 percentage point lower unemployment rates than non-right-to-work states. Unions do not provide economic benefits that justify forcing workers to pay their dues.
Right-to-Work Law
The National Labor Relations Act (NLRA) authorizes unions to act as workers’ “exclusive bargaining representatives.”[1] This requires all of a unionized firm’s employees to accept the union contract. Individuals may not negotiate separately, whether or not they belong to the union. Shortly after Congress passed the NLRA unions started negotiating contracts that made paying their dues a condition of employment. In response many states passed “right-to-work” laws that prohibit these provisions.[2] Under RTW, unions cannot make dues compulsory if they elect to bargain on behalf of non-members.
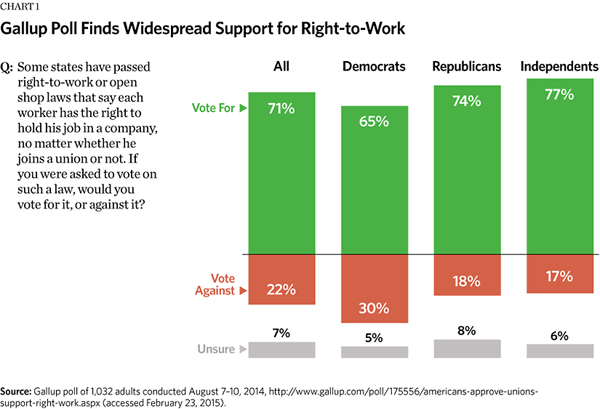
Large majorities of Americans across the political spectrum support RTW. A recent Gallup poll asked Americans their views on the subject. Respondents said they support RTW by a 71 percent to 22 percent margin. Self-identified Democrats supported RTW by a 2 to 1 margin. Independents and Republicans supported RTW by better than 4 to 1 margins. Now the right-to-work debate has come to Wisconsin.
Protects Workers Freedom. Right-to-work laws protect workers freedom. In the absence of RTW unions force workers to purchase their representation—whether or not they see any benefit from it. For example, Michael Romachock began working at a Pepsi Bottling plant in Ebensburg, Pennsylvania, in June 2013. He worked nine months without realizing the Teamsters had organized his workplace. He only learned of his union representation when the union sent him a letter demanding full dues. When he refused to pay for services he had not even noticed, the Teamsters had him fired.[3]
Such compulsory dues allow unions to take workers for granted. They collect dues no matter how well they represent them. As Gary Casteel, Secretary-Treasurer of the United Auto Workers, told the press last year:
This is something I’ve never understood, that people think right to work hurts unions. To me, it helps them. You don’t have to belong if you don’t want to. So if I go to an organizing drive, I can tell these workers, “If you don’t like this arrangement, you don’t have to belong.” Versus, “If we get 50 percent of you, then all of you have to belong, whether you like to or not.” I don’t even like the way that sounds, because it’s a voluntary system, and if you don’t think the system’s earning its keep, then you don’t have to pay.[4]
Research confirms that unions pay more attention to their members in right-to-work states. Union officers earn substantially greater salaries in states with compulsory dues, even after adjusting for costs of living. When union officers must earn workers’ support they spend less money on themselves.[5]
Forced dues also compel Wisconsin workers to support highly politicized organizations. At the AFL-CIO’s 2013 convention delegates declared that the labor federation had “as a founding ideal the assembling of a broad progressive coalition for social and economic justice.”[6] Workers with moderate and conservative views do not share this ideal. RTW ensures such workers do not have to give their money to groups whose agenda they oppose.[7]
Attracts Business and Jobs. Right-to-work laws have economic benefits that go beyond protecting workers’ freedom. Union contracts make businesses less competitive.[8] One recent study compared companies whose workers narrowly voted to unionize with those who narrowly voted against unionizing. It found the unionized firms were 10 percentage points more likely to go out of businesses within seven years.[9]
Consequently, most companies want to avoid getting unionized. Workers in right-to-work states can still unionize. However, RTW reduces the financial incentives for unions to organize aggressively: they have less money on the line when workers can opt out. Consequently, RTW causes them to focus their energies on companies with dissatisfied workers. Workers in these workplaces are both easier to organize and more likely to pay dues if the union wins. In RTW states unions put far less effort into organizing workplaces where they have lukewarm support.[10] This reticence attracts business investment and jobs.
Academic studies find businesses make RTW laws a major consideration when deciding where to locate.[11] Businesses development consultants also report that roughly half of their clients will not consider locating in a non-RTW state.[12] David Brandon, President of the Pathfinders, an economic development consulting firm, explains:
About 35-to-40 percent of manufacturing enterprises in the automotive industry insist on operating in a right-to-work state. Another 20-to-25 percent say it is a very important factor and will be used as a second- or third-tier factor in site selection. More than half of our companies either make it a threshold or a very important factor in making a decision on where to locate a factory and other operations.[13]
As long as Wisconsin lacks a right-to-work law it takes itself out of consideration for these jobs. Within a month and a half of Warren County, Kentucky, passing a local right-to-work ordinance it came under consideration for 16 new business development projects. These projects represented $184 million in potential new investment in Warren County.[14] Unsurprisingly, states with right-to-work laws enjoy considerably faster employment growth than those without them.[15]
Members-Only Unions Permissible. Unions often object that RTW forces them to represent non-members free of charge. However, federal law allows unions with majority support in the workplace to negotiate “members-only contracts,” whose terms apply only to dues-paying members. Shortly after Congress passed the NLRA the Supreme Court ruled on a case in which the International Brotherhood of Electrical Workers formed a union representing 80 percent of the workers at a New York electrical utility. The National Labor Relations Board challenged its legality. The Supreme Court rejected the Boards’ challenge, holding the NLRA permits non-exclusive contracts covering only union members.[16] This decision remains good law and the Supreme Court subsequently upheld its validity after the Taft–Hartley amendments to the NLRA.[17]
Unions almost always choose to negotiate as exclusive representatives. They do this in part because union contracts benefit some workers at the expense of others. For example, seniority-based layoffs give incredible job security to senior union members: the contract requires junior employees to get laid off first. With a members-only union, recent hires could negotiate performance-based layoffs for themselves. This would improve their job security but require senior members to share in the risk of getting laid off. Unions negotiate as exclusive representatives to prevent the workers they hurt from opting out. Research finds that in RTW states the workers disadvantaged by union contracts disproportionately stop paying dues.[18]
Unions and Living Standards
Right-to-work laws protect workers’ freedom and attract business investment. In response unions counter that it lowers wages. They contend that unions pressure employers to pay workers more; by reducing union organizing RTW reduces this pressure. They claim workers in states with compulsory dues enjoy higher living standards than they would in RTW states.[19] Union-allied organizations, like the liberal Economic Policy Institute (EPI), make similar claims.[20]
This argument flies in the face of economic theory. Labor unions function as labor cartels: They try to control the supply of labor in an industry so as to drive up its price—wages. Like all cartels these gains come at the cost of greater losses to the rest of society.[21]
To see how this works, consider the United Auto Workers (UAW). The UAW organized the Detroit automakers—General Motors, Ford, and Chrysler—which once comprised nearly the entire U.S. auto market. This gave it a monopoly on hourly labor in the auto industry. The union used this leverage to insist on very generous compensation packages for all three automakers. In the face of strikes the automakers repeatedly caved to union demands. Until the financial crisis, UAW members received more than $70 an hour in wages and benefits.[22]
At the same time the UAW made every American driver poorer. The union’s premium pay and inefficient work rules added about $800 to the cost of every Detroit vehicle.[23] The automakers passed these costs on to consumers. This left most consumers with less money to spend on other goods and services—and priced a new vehicle out of reach for some families. Consequently the automakers sold fewer cars and needed fewer workers, as did their (potentially non-union) suppliers in the steel, plastic, and other industries. The workers who would have been employed in the auto industry and its suppliers worked elsewhere, slightly reducing wages in those sectors.[24] The UAW’s monopoly on auto labor meant higher wages for its members, but higher prices and fewer jobs in the auto industry and lower wages outside it.
On the whole economists find the harm to non-union workers outweighs the economic gains to union members.[25] As one academic literature summary concluded: “[M]ost economists believe, as a generalization, that the negative side of unions outweighs the positive side, at least with respect to resource allocation and efficiency.”[26 ]
Further, unions do not—and cannot—simply redistribute from “the rich.” While unions harm businesses’ profitability, they also hurt low-income and middle-income workers. The higher prices imposed by unions hurt rich, poor, and middle-class consumers alike, but lower-income workers feel the sting of price increases more acutely. Restricting jobs in unionized companies reduces demand in related industries and pushes more workers into the non-union sector. Both effects depress the pay of non-union employees.[27] Most of the income that unions redistribute comes from other workers, not stockowners. To the extent RTW weakens unions, economists would expect it to slightly increase overall living standards.[28]
Union Strength and the Middle Class. Unions and their supporters frequently claim the opposite: that unions helped build the middle class and weaker unions hurt all workers—not just union members. To make this point they often juxtapose the decline of union membership since the late 1960s with the share of income going to the middle class. The Economic Policy Institute did exactly this when criticizing the possibility of RTW in Wisconsin.[29] These comparisons suffer from two problems. First, the absolute standards of living for middle-class workers have risen substantially over the past generation. Inflation-adjusted market earnings rose by one-fifth for middle-class workers between 1979 and 2011. After-tax incomes rose at an even faster pace.[30] Middle-class workers today enjoy substantially higher standards of living than their counterparts in the 1970s.
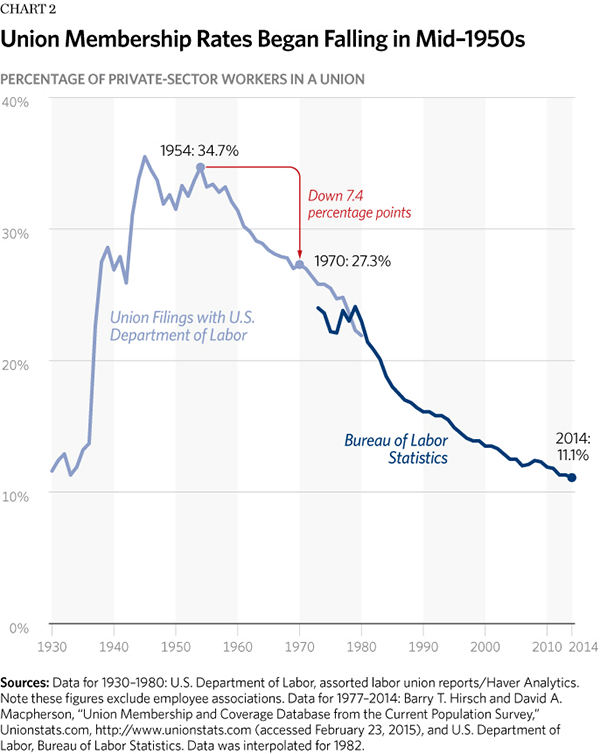
Secondly, these figures conflate correlation with causation. During the time period EPI examined union membership correlates well with their measure of middle-class income shares. Extending the graph back another two decades eliminates this correlation. U.S. union density surged in the late 1930s and during World War II. It peaked at about a third of the overall economy and private-sector workforce in the mid-1950s. During this time period America had few global competitors.[31] From the mid-1950s onward global competition increased and U.S. union membership steadily declined. Between 1954 and 1970 union density dropped from 34.7 percent to 27.3 percent. Unions lost over a fifth of their support in just over a decade and a half.
During this period middle-class income and living standards grew rapidly. No one remembers the 1950s and 1960s as bad for the middle class, despite the substantial de-unionization that occurred. Over a longer historical period changes in U.S. union strength show little correlation with middle-class income shares. Liberal analysts come to their conclusion by looking only at the historical period in which the two trends align.
Unions Argue RTW Hurts Wages. In the same vein, unions argue that RTW laws lower wages. As the Wisconsin AFL-CIO recently claimed:
These anti-worker Right To Work laws just force all working families to work harder for lower pay and less benefits, whether they’re in a union or not. The average worker makes about $5,000 less and pensions are lower and less secure in Right to Work states.[32]
This statement contains a degree of truth: average wages in right-to-work states are approximately that much lower than in non-RTW states. This happens because right-to-work states also have below-average costs of living (COL). Virtually the entire South has passed RTW, but no Northeastern states have passed an RTW law. The Northeast has higher COL and higher average wages; the South has lower living costs and lower wages.
Chart 3 shows this visually. It presents Bureau of Economic Analysis (BEA) living cost data for U.S. states over 2008 to 2012. The values show how much more or less goods and services cost in particular states relative to the U.S. average. For example, New Yorkers pay 15 percent more than the average American and Wisconsinites pay 7 percent less.
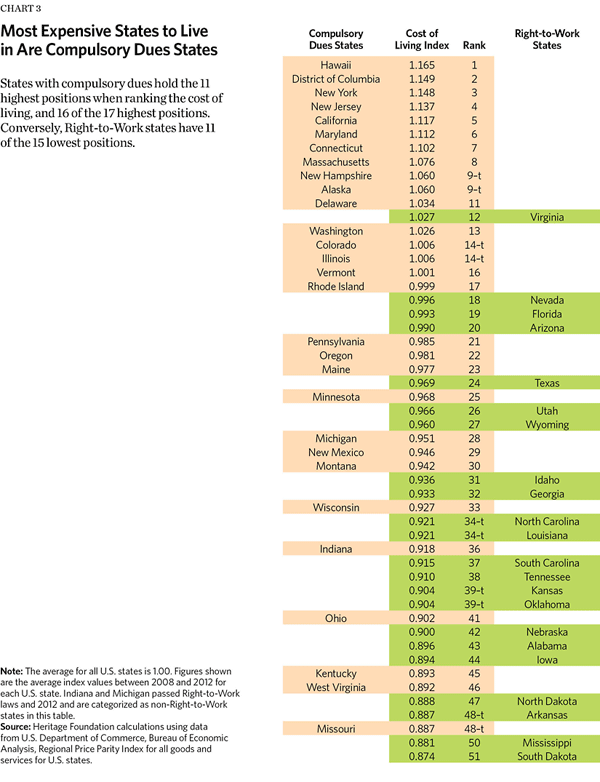
All but one right-to-work state has living costs at or below the national average. All ten of the states with the highest COL have compulsory union dues. Analyses that control for these COL differences have historically found that RTW has no deleterious effects on workers’ real purchasing power.[33]
Recently the Economic Policy Institute has claimed that workers in RTW states make 3 percent less than workers without RTW protection, even after controlling for living costs. Heritage replicated this analysis and found that EPI made two major mistakes: it included improper control variables and did not account for measurement error in their COL variables. These mistakes drive their results. Correcting these mistakes shows that private-sector wages have no statistically detectable correlation with RTW laws. The supplement and the appendices to this testimony explain the technical details of this replication. Properly measured, RTW laws have no effect on wages in the private sector.
RTW and Non-Wage Benefits
EPI also examined the effect of RTW laws on two major non-wage benefits: employer sponsored health coverage and pensions. They conclude that RTW considerably reduces the likelihood workers enjoy these benefits. Unfortunately, this analysis provides little insight into what will happen in Wisconsin. In 2010 President Obama signed the Affordable Care Act (Obamacare) into law. This law imposes a “Cadillac tax” on expensive health insurance policies, requires employers to provide health insurance or pay a fine, and provides taxpayer subsidies to individuals without employer sponsored coverage. Analysis of pre-Obamacare health care markets provide little insight into how people and firms will respond to the law. It is simply too soon to determine what effect RTW laws have on the availability of health insurance in the post-Obamacare world.
The EPI analysis of pension coverage suffers also from two major problems. First, it uses data from the March Current Population Survey (CPS) supplement. The March CPS asks respondents about whether they are covered by a pension or other retirement plan at work. However, many Americans who have pensions or 401(k)s do not mention them when interviewed by the CPS. Census Bureau researchers have found that two-thirds of March CPS respondents who report pension income on their tax forms do not report pension income on the CPS survey.[34] Workers with defined-benefit pensions—those most unions prefer—probably report them in the CPS more often than workers with defined-contribution plans. The March CPS data regrettably provides only limited insight into the availability of employer-sponsored retirement plans.
Second, Gould and Shierholz assume that all union members who report having pensions will collect them. Many will not. Large numbers of union multiemployer pensions have become critically underfunded. Multiemployer pensions covering 1.5 million workers have less than 40 percent of the assets necessary to pay promised benefits. In theory the Pension Benefit Guarantee Corporation (PBGC) backstops these pension plans. But the PBGC itself faces steep financial shortfalls. Last year it estimated its multiemployer pension fund would run out of money within eight years.[35]
If that happens many union members will collect nothing or almost nothing of their promised benefits.[36] Many multiemployer pensions have become legally sanctioned Ponzi schemes. Younger union workers currently paying into these pensions fund benefits for existing retirees, with nothing set aside for their retirement. Treating them as having meaningful retirement security is simply inaccurate. Researchers cannot use CPS pension data to estimate the effects of RTW laws on pension coverage.
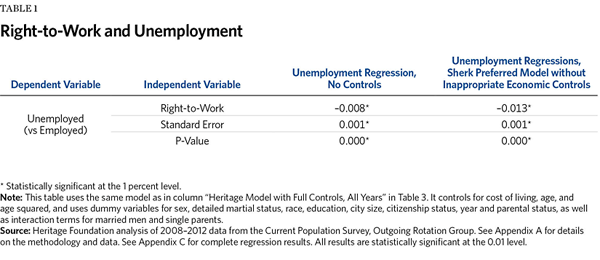
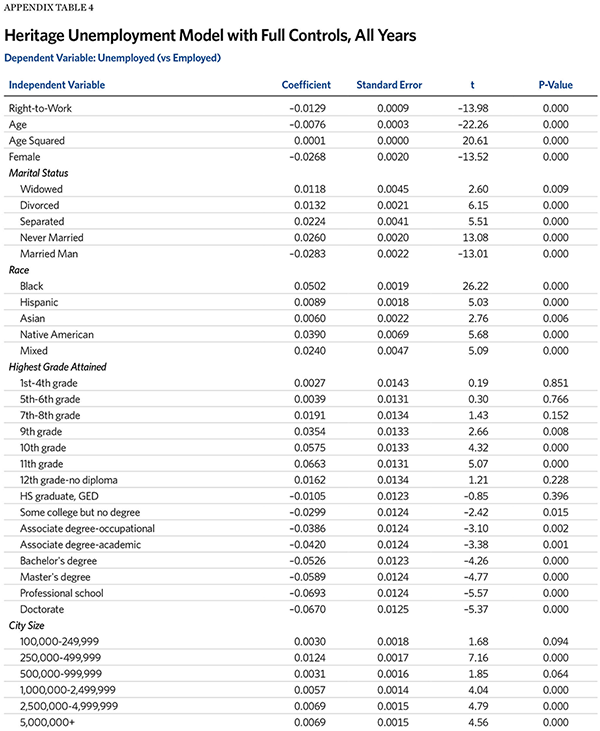
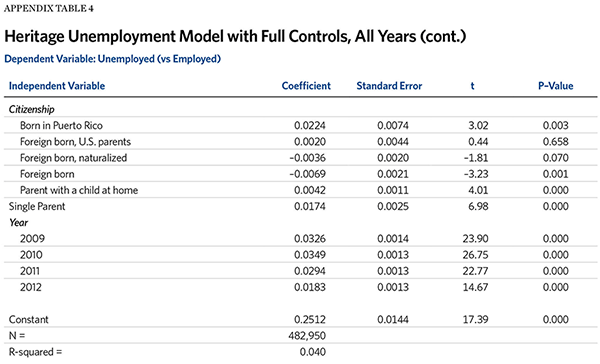
Lower Unemployment in RTW States. Opponents of RTW often ignore one conspicuous economic measure it affects: unemployment. While the EPI researchers thoroughly examined the effect of RTW on pay they did not look at its effect on jobs. Applying the same methodology the EPI used to analyze compensation to analyze unemployment—correcting for their mistakes—shows that RTW significantly reduces unemployment.[37] Without any controls for demographics workers in RTW states are 0.8 percentage points less likely to be unemployed. Controlling for relevant factors shows that workers in right-to-work states are 1.3 percentage points less likely to be unemployed than workers in states with forced dues. Appendix C shows these results in greater detail.
Conclusion
A right-to-work law would prevent Wisconsin workers from being forced to pay union dues. Unions strongly oppose RTW, arguing the benefits of strong unions justify their coercion. However, the facts do not back up their claims. Unions operate as labor cartels. When they win higher wages for their members, they do so at the expense of higher prices and lower wages for non-union members. Labor economists generally agree that unions reduce overall living standards.
Against this unions and their allies contend that RTW would lower wages in Wisconsin—even after controlling for living costs. Heritage replicated this research and found that it made two analytical mistakes: (1) it held constant the mechanisms through which right-to-work laws increase wages, effectively ignoring their economic benefits and (2) used statistically biased methods to control for costs of living. Correcting these mistakes shows right-to-work laws have no statistically detectable relationship with wages. Workers in right-to-work states do have unemployment rates averaging over a percentage point less than comparable workers in non-RTW states. Wisconsin policymakers should know that unions do not provide public economic benefits that justify forcing workers to pay their dues.
Supplement: Econometric Analysis of RTW and Wages
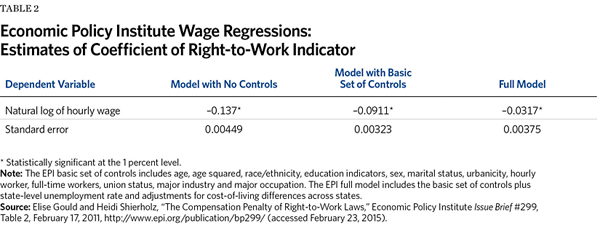
Recently unions and union-allied groups have begun arguing that RTW lowers workers’ wages even after controlling for cost of living differences. In 2011 the Economic Policy Institute released a report by Elise Gould and Heidi Shierholz entitled, “The Compensation Penalty of Right-to-Work Laws” (hereafter, Gould and Shierholz).[38] The report analyzed the effect of right-to-work laws on wages in 2009, controlling for factors like as demographics and costs of living that affect pay. Table 2 reproduces their main findings.
The first column shows the relationship between right-to-work laws and wages without controlling for any other factors. It shows RTW is correlated with approximately 13 percent lower wages.[39] The second column shows the results after controlling for other factors that would affect wages: demographics, urban status, union status, full-time and salaried status, and industry and occupation. This reduces the correlation to about 9 percent lower wages in RTW states. The third column shows the EPI’s preferred specification, which also includes controls for the unemployment rate and costs of living. Gould and Shierholz find that even after controlling for these factors workers make about 3 percent less in RTW states.
On the basis of this finding the Economic Policy Institute recently released a report arguing RTW would hurt Wisconsin.[40] This report estimated the consequences of a 3 percent wage reduction on Wisconsin’s economy. Unsurprisingly it found large negative effects. Unions and their supporters have used this study to argue for compulsory dues.
The Heritage Foundation replicated the EPI analysis. This replication revealed that EPI made several methodological mistakes. These mistakes drive their finding that right-to-work laws lower wages and thus hurt the economy. Correcting these errors changes their conclusion: right-to-work laws have no association with COL-adjusted wages across the overall economy.
Replication of EPI Analysis
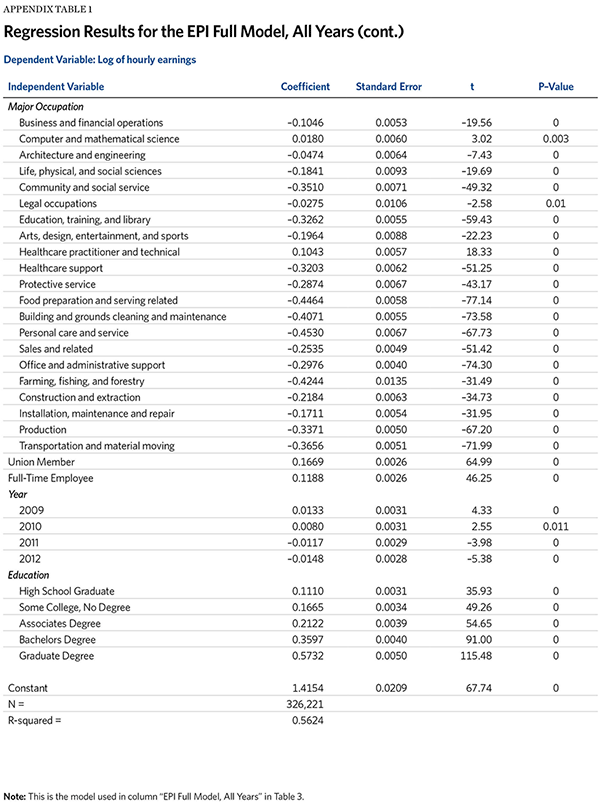
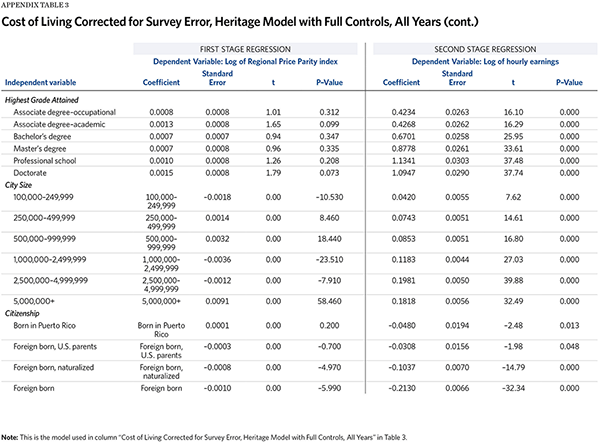
To replicate Gould and Shierholz, The Heritage Foundation used Current Population Survey data and Bureau of Economic Analysis Regional Price Parity (RPP) data for 2008 through 2012.[41] Appendix A to this supplement explains the data and methods used in detail. Appendix C presents detailed regression results. Table 3 shows the results of regressing the natural log of hourly pay on a variable for RTW status and other control variables. This coefficient approximately equals the percentage change in average wages for workers in RTW states.[42]
The first three columns of Table 3 repeat the EPI analysis in Table 2. Using the same data and methodology Heritage found results very similar—but not identical—results to those EPI reported. In the EPI’s preferred specification Heritage estimated 2.8 percent lower wages, while EPI estimated 3.2 percent lower wages. Column (4) reproduces EPI’s preferred model for the years 2008–2012. Expanding the sample does not change the results.
Bad Statistical Controls. The estimates change markedly in column (5). That column reports the association between RTW and wages using slightly different control variables. Researchers need to carefully consider what they control for in their analysis. They need to make sure they do not factor out the channels through which one variable influences another. For example, researchers examining how education affects wages might control for factors like age, gender, or state of residence. However, they should not control for occupation. Education often gives workers access to more highly paid occupations.[43]
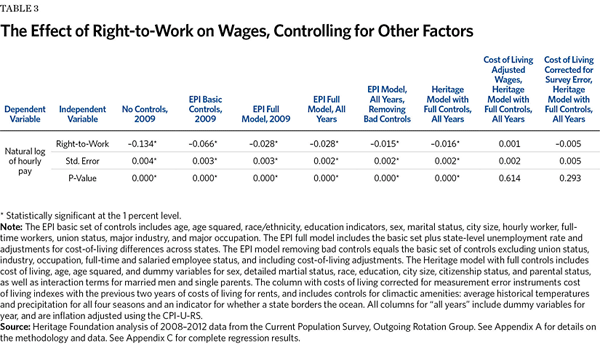
Controlling for occupation removes an important factor through which education raises earnings. Including it in the analysis would make it appear education boosts earnings less than it actually does. Such “bad controls” produce biased results.[44]
EPI used several such improper controls in its analysis. Right-to-work laws benefit local economies precisely by attracting jobs and industries that would not otherwise locate there. Tuscaloosa, Alabama, has more well-paid manufacturing jobs because its right-to-work law helped attract a Mercedes-Benz plant. Similarly, by attracting employers RTW laws reduce unemployment. Lower unemployment and a tighter labor market puts upward pressure on wages. Tighter labor markets also make companies more responsive to workers’ desires for full-time schedules. By controlling for industrial mix and labor market conditions EPI removed the main channels through which RTW laws put upward pressure wages. This biases their estimates toward finding negative effects.
Operating in the other direction, EPI included controls for union membership. States with compulsory dues have more union members than states with voluntary dues. To the extent that unions succeed in raising wages for their members, and RTW laws reduce union membership, the EPI analysis removes one of the channels through which unions raise wages. This biases their estimates of the effect of RTW on wages upward.
Column (5) shows the results of the EPI analysis after removing controls for union membership and labor-market conditions: the unemployment rate, industry, occupation, and hourly and full-time status.[45] Removing these bad controls has a large effect. The estimated negative effect of RTW laws on wages falls almost in half, from –2.8 percent to –1.5 percent.
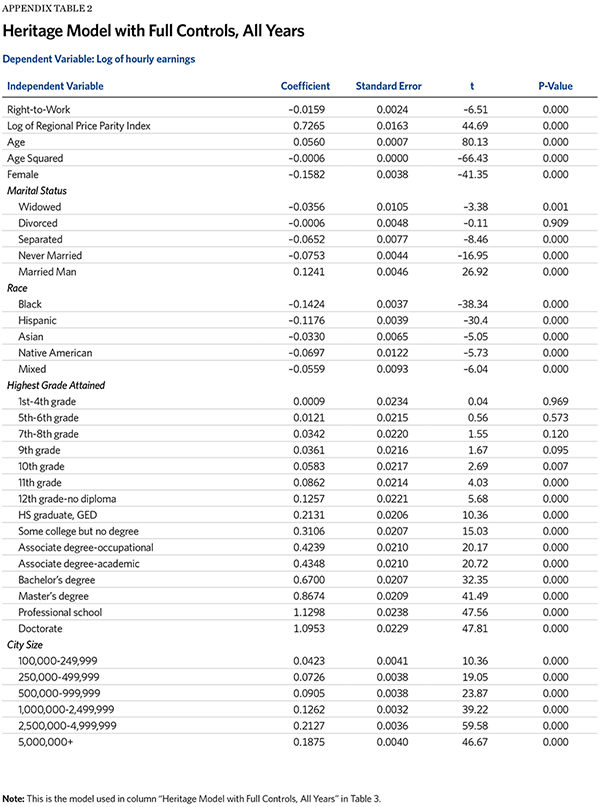
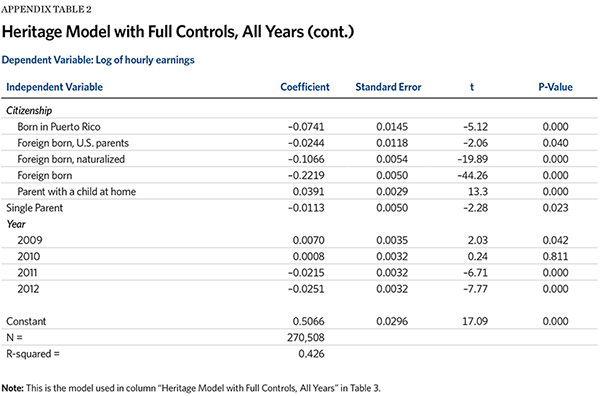
Column (6) shows The Heritage Foundation preferred model which controls for several more variables than EPI included in its analysis—citizenship status, parental status, and single-parent status. The estimates in column (6) also use more detailed measures of marital status and educational attainment. These new variables have only a small effect on the overall results, changing the coefficient on RTW to –1.6 percent.[46]
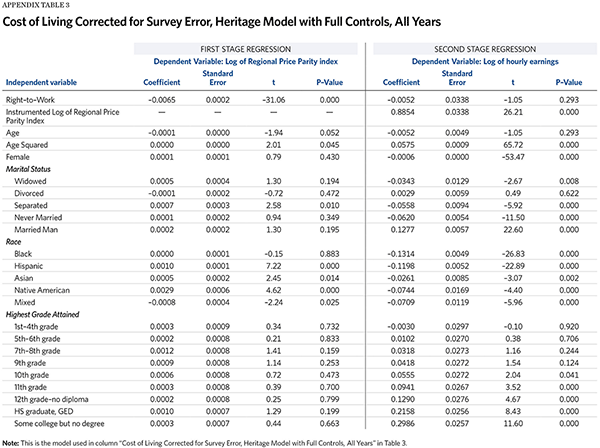
Correctly Accounting for Costs of Living. A larger problem with the EPI analysis comes in how it adjusts for costs of living.[47] Gould and Shierholz included measures of states’ living costs as control variables in their preferred specification.[48] However, this specification only accounts for about 70 percent of the differences in COL between states.[49] In other words, it does not fully account for how workers in states with lower costs of living need less money to purchase the same goods and services as workers in other states. Column (7) shows how directly adjusting wages for living costs and then running the analysis changes the results. It completely eliminates the estimated negative effect of RTW laws on wages. Under this specification RTW laws are associated with (statistically insignificant) 0.1 percent higher wages for all workers.
Some economists argue against directly adjusting pay for cost of living. They believe that costs of living partly reflect desirable (or undesirable) amenities in an area that data on local prices do not capture. For example, New Yorkers pay 15 percent more for goods and services than Nevadans do. Many New Yorkers also live in the largest city in America with perhaps the best restaurant, cultural, and entertainment options in the country. A New Yorker making $57,500 arguably has a higher standard of living than a Nevadan making $50,000. Those incomes buy them the same amount of goods and services, but the New Yorker has the option of watching shows on Broadway, visiting the Metropolitan Museum of Art, or attending events in Madison Square Garden.
In the late 1990s researchers examining this issue recommended controlling for costs of living using the method Gould and Shierholz employed—including it as a control variable that only partially adjusts for differences in prices across states.[50] Subsequent research identified a problem with this technique: measurement error. As with any survey, cost of living surveys have measurement error. This introduces biases into the analysis. In essence, measurement error has no correlation with wages. Costs of living are strongly correlated with wages. Sampled costs of living—which combine the two—are thus less strongly correlated with wages than the true cost of living. Researchers should use a statistical technique (instrumental variables) to correct for this bias.[51] Not doing so produces inaccurate estimates.
This bias becomes particularly problematic when analyzing the effect of RTW because right-to-work laws are strongly correlated with lower living costs. Measurement error causes Gould and Shierholz’s analysis estimates to under-compensate for the effect of living costs on wages. Their regression attributes part of its remaining effect to variables (like RTW) correlated with true living costs.[52] Consequently, their estimates partly conflate the (downward) effect of lower living costs on wages with the effect of right-to-work laws. This biases their estimates toward finding negative effects of RTW on pay. Appendix B explains these problems and the solution in greater detail.
Column (8) uses the same model as in column (7)—corrected for measurement error. Doing so eliminates the estimated negative effect of RTW laws on wages. The coefficient falls to –0.5 percent and becomes statistically insignificant. Using appropriate control variables and adjusting for costs of living correctly reverses Gould and Shierholz’s finding. Proper analysis shows that right-to-work laws have little correlation with wage rates.
This fact casts serious doubt on the claims that unions benefit workers overall. Right-to-work states generally (although not always) have lower union membership than states with compulsory dues. Nonetheless, overall wage rates are not statistically distinguishable between these states, after properly controlling for factors like costs of living. Unions do not provide broad-based economic benefits.
Effects on Different Groups. Gould and Shierholz also analyzed the effect of RTW laws on various subsets of the population. They concluded that RTW laws had particularly negative effects on women, African Americans, and Hispanics. Table 4 shows the results of using the measurement error corrected model to analyze how RTW affects these workers. It shows that removing the bad controls and correcting for measurement error eliminates the estimated negative effects. RTW has no statistically significant effect on wages for any of these subpopulations. EPI concluded otherwise because it used statistically biased methods.
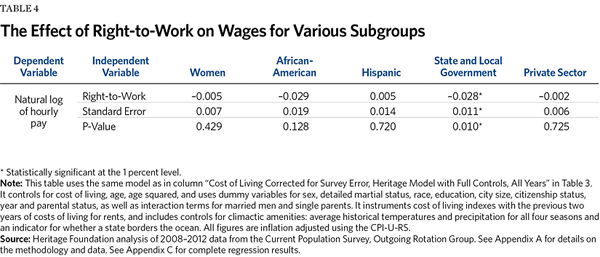
The table also breaks down the effect of RTW laws on two groups of the population Gould and Shierholz did not consider: private-sector workers and state and local government employees.[53] By attracting investment and jobs right-to-work laws can put upward pressure on private-sector pay. Conversely, voluntary dues reduce the resources available to government unions to “elect their own boss” and win inflated contracts. This would tend to reduce government compensation.
Wisconsin Act 10 already gave right-to-work protections to most government employees while restructuring government compensation. Only private-sector wages are relevant for Wisconsin policymakers to consider when evaluating RTW.
Table 4 shows RTW does reduce government pay, but has virtually no effect on private-sector compensation. The coefficient on RTW in the private sector is a statistically insignificant –0.2 percent. Wisconsin policymakers should evaluate the benefits of RTW knowing it will neither increase nor decrease wages in the Badger state.
Appendix A: Data and Methodology
The Heritage Foundation Center for Data Analysis (CDA) conducted this analysis using data from the outgoing rotation groups of the 2008 through 2012 Current Population Survey (CPS). The CDA was not able to exactly replicate the results presented in Gould and Shierholz (2011). In e-mail correspondence Dr. Gould directed The Heritage Foundation to the adjustments the Economic Policy Institute makes to the CPS data to correct for top coding, workers who do not report their usual weekly hours, and other data quality issues.[54] This methodology is substantially similar to that the Center for Economic Policy Research (CEPR) uses and makes publicly available online.[55] To avoid any impression that Heritage data adjustments drove the disparity between EPI’s and Heritage’s results, the CDA used the publicly available CEPR adjusted CPS outgoing rotation group data. The CEPR is a prominent liberal policy organization. The use of CEPR data in this replication does not imply CDA endorsement of every data correction CEPR made. For example, along with the Congressional Budget Office and the Federal Reserve, Heritage’s CDA considers the Personal Consumption Expenditures (PCE) price index a better measure of inflation than the Consumer Price Index Research Series (CPI-U-RS). The CEPR used the CPI-U-RS to adjust for inflation. Had this not been a replication exercise Heritage would have used the PCE.[56]
Heritage used the CEPR hourly wage estimates that matched the adjustments EPI indicated it made: hourly pay variable rw_p8_no. The CEPR constructed this using reported wages for hourly employees and estimating hourly earnings for salaried workers by dividing usual weekly earnings by usual weekly hours. This variable makes no adjustment for overtime or tips earned by hourly employees. It imputes the estimated hours worked for salaried employees who report their “hours vary” and imputes the pay of workers with top-coded earnings using the Pareto distribution workers with earnings above the 80th percentile. Following the EPI, Heritage dropped observations with CPS-imputed earnings and restricted attention to workers between the ages of 18 and 64. For analysis covering more than one year, Heritage only included workers the first year they appeared in the Outgoing Rotation Group (ORG) data, with the exception of workers in their second ORG interview in 2008.
To the CPS data Heritage added data from the Bureau of Labor Statistics on state unemployment rates for the years 2008 to 2012 and Bureau of Economic Analysis (BEA) Regional Price Parity (RPP) data on state costs of living. The CDA chose these years because they are the only years for which the BEA currently provides RPP data. Heritage also added Climate Normals data on 1971–2000 average seasonal (winter, spring, summer, and fall) temperatures and precipitation by state from the National Climactic Data Center data.
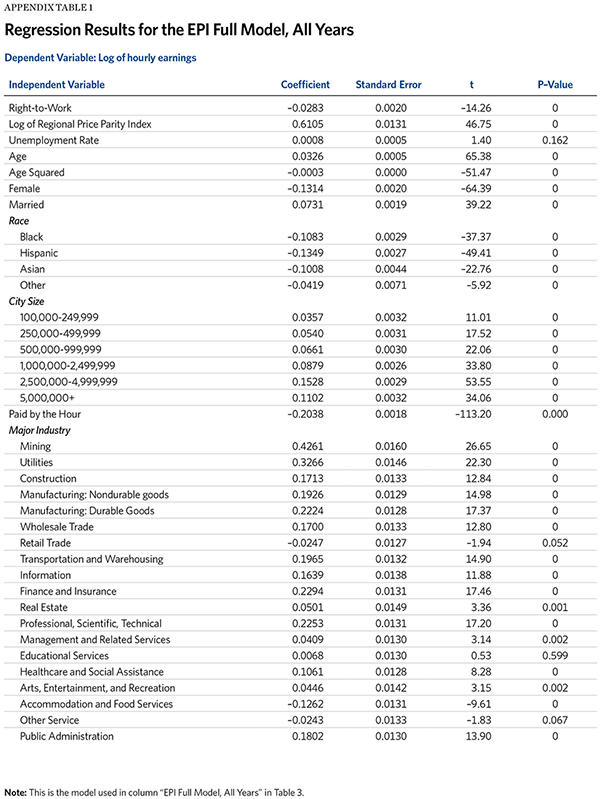
The CDA regressed the log of hourly wages on a variable indicting whether employees resided in a right-to-work state and various control variables. The CDA used robust standard errors throughout. In the EPI full model reported in column (3) of Table 3 Heritage included controls for age, age squared, race/ethnicity, highest degree attained, sex, marital status, city size, hourly worker status, full-time worker status, union status, major industry and major occupation, state-level unemployment rate, and the log of state RPP for all goods and services. The column (5) estimates removing bad controls include the same control variables as column (3), excluding union membership, industry, occupation, full-time and salaried employee status, and state unemployment rate.
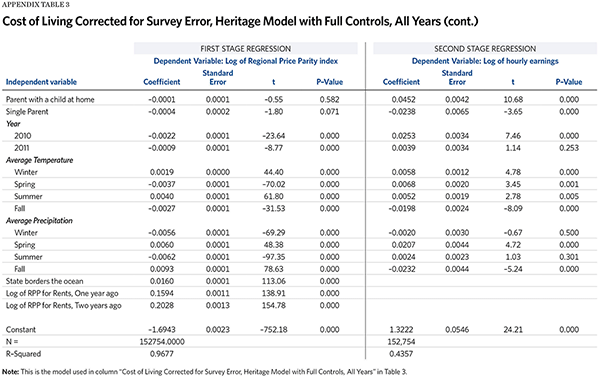
The Heritage model with full controls in column (6) includes cost of living, age, age squared, and dummy variables for sex, detailed marital status, race,[57] detailed education, city size, citizenship status, and parental status, as well as interaction terms for married men and single parents. Column (8) with costs of living corrected for measurement error uses two stage least squares to instrument cost of living for all goods in services with data on the previous two years of costs of living for housing. The instrumental variable specification uses CPS data from 2010–2013 because RPP data for years prior to 2008 was not available. The specification in column (8) also includes controls for climactic amenities: average historical temperatures and precipitation for all four seasons and an indicator for whether a state borders the ocean. The estimates in Table 4 use the same specification as in column (8) of Table 3 restricted to various subgroups of the workforce. All columns for “all years” in Table 3 and Table 4 include dummy variables for year and are inflation-adjusted using the CPI-U-RS.
The cost-of-living adjusted wages in column (7) of Table 3 were estimated by dividing wages by the RPP index and then estimating the model in column (6).[58] The estimates in column (2) of Table 1 use the same control variables as in column (6) of Table 3, excepting the logged RPP index.
Workers residing in Indiana after March 2012 were classified as living in a RTW state; for previous months they were classified as being non-RTW.
Appendix B: Controlling for Cost of Living
Properly controlling for COL differences is a critical factor in making comparisons between RTW and non-RTW states. Most right-to-work states have below-average costs of living. A dollar buys more goods and services in states with RTW laws than it does in states without RTW laws. The higher nominal wages in non-RTW states do not necessarily translate into greater real purchasing power.
The CDA used the BEA Regional Price Parity index for all goods and services by state and year to calculate differences in costs of living. The RPP uses price data on goods and services compiled by the Bureau of Labor Statistics for constructing the Consumer Price Index, disaggregated by state. The RPP estimates shelter costs using survey data from the American Community Survey (ACS). The BEA released its first official RPP estimates in April of 2014. They were not available for the Economic Policy Institute to use in its 2011 report. The EPI used data on the cost of fair market rents across states and years estimated by the Political Economic Research Institute at the University of Massachusetts-Amherst. The EPI also used Council for Community and Economic Research (C2ER) cost-of-living indexes compiled by the Missouri Economic Research and Information Center (MERIC). The C2ER was formerly known as the ACCRA cost-of-living index. The C2ER calculates housing costs using home values, not rental values.
All three of these indexes suffer from various measurement errors. The RPP housing costs data contains the classical sampling error the ACS and all probability surveys exhibit. The RPP data on all other goods and services also suffers from potentially non-classical serially correlated errors. As the BEA explains:
Price levels for each county are assumed to be those of the CPI sampling area in which the county is located. For example, counties in Pennsylvania are assigned price levels from either the Philadelphia or Pittsburgh areas or from the Northeast small metropolitan area. Rural counties are not included in any of the 38 urban areas for which stage one price levels are estimated. These counties are assigned price levels of the urban area that (1) is located in the same region and (2) has the lowest population threshold.[59]
Thus BEA assigns many rural counties price levels from urban areas that may well have higher costs of living. It does so year after year, probably producing persistent errors into each states’ average estimated living costs.
The C2ER also suffers from serially correlated measurement errors. The C2ER gathers data on costs of living from different cities collected by partnering organizations. The statewide living cost index averages the results for all participating cities in a state. MERIC does not randomly select these cities; all cities with partnering organizations that collect the data are included. Cities appear in and disappear from the survey over time depending on the interest and participation of these partnering organizations. The C2ER data excludes almost all cities with populations of less than 50,000. This methodology perpetuates errors caused by the exclusion of rural areas or non-random inclusion of cities year after year.
One method of controlling for price differences is for researchers to simply convert nominal wages into real wages using a price index, then analyze the data. Economists almost always control for the effects of inflation over time this way.[60] Column (7) of Table 3 shows that doing so and eliminating bad controls completely eliminates the negative correlation between wages and RTW laws.
DuMond et al. (1999) criticize this approach, arguing that areas with higher costs of living have amenities not reflected in the price of purchased goods and services. For example, California is expensive to live in precisely because its mild climate makes it attractive to live in. North Dakota has lower costs of living in part because people do not want to endure its frigid winters. The cheaper cost of living in North Dakota partly reflects its less enjoyable climate—something living cost indexes do not capture. DuMond et al. recommend adjusting for living costs by including the logged value of price indexes in a regression framework. Using this approach with the C2ER they find that wages only partially adjust to living costs. Gould and Shierholz used this approach.
Winters (2009) re-evaluates DuMond et al.’s findings. He comes to two main conclusions: (1) wages are much more closely related to differences in living costs measured by the rental value of homes than those measured by the value of homes, which can vary substantially during periods like the housing bubble or housing crash. This biases the effect of COL adjustments based on home values—like the C2ER—toward zero and (2) measurement error seriously affects wage regressions using COL indexes. Measurement error in an independent variable biases regression coefficient estimates towards zero. Winters finds that the ACS estimates the rental value of homes with classical measurement error, but concludes the C2ER non-shelter goods and services indexes contain serially correlated non-classical errors as well. A standard approach for controlling for classical measurement error is to use instrumental variables with the instruments’ previous values of the variable. Winters recommends instrumenting for living costs for all goods and services using previous values of the price index for rental costs, which only suffers from classical non-serially correlated survey error. Winters finds that wages fully adjust to living costs when regressed on instrumented living costs and detailed controls for city-level amenities (e.g., crime rates, climate, city size, topography, air quality, taxes).
The problems Winters identified bias the EPI estimates. One of the two EPI living cost indexes (the C2ER) relies on home values, not rental values of homes. Gould and Shierholz also make no adjustments for measurement error. Both effects cause their analysis to underestimate the relationship between wages and living costs. Worse, right-to-work laws are correlated with lower costs of living. Consequently their analysis attributes part of the remaining (negative) relationship between lower living costs and wages to the RTW variable.
The problems Winters identified partially affect the RPP data Heritage used. As mentioned the BEA bases RPP shelter costs on rents, not home values. But the RPP data for non-shelter services and goods almost certainly contains serially correlated errors. Following Winters 2009, the CDA instrumented for the RPP for all goods and services using the previous two years of the RPP for rents. Heritage also partially controlled for statewide climactic amenities, including a dummy variable for whether a state borders the ocean and average seasonal temperatures and precipitation by state. Many of the amenities Winters controlled for only make sense as citywide variables as they are not generally enjoyed by residents statewide (e.g., crime rates, air quality). The CEPR CPS ORG files only include identifying information for a limited number of sub-state metropolitan areas, so the CDA did not attempt to control for amenities at the city level beyond city size.
Applying the Winters correction for measurement error substantially increases the correlation between wages and living costs. While the base model in column (6) of Table 3 estimates wages increase 0.73 percent in states with a 1 percent higher cost of living, the model in column (8) of Table 3 estimates wages rise 0.89 percent. Appendix C shows the full regression output for these models. It is quite probable that including controls for city-level amenities would cause the model to show wages track living costs even more closely. As Table 3 makes clear, correcting for measurement error renders the relationship between wages and right-to-work laws statistically insignificant.
Endnotes
[1] US Congress, “National Labor Relations Act (“NLRA”)”. 29 U.S.C. §§ 151-169. July 5, 1935.
[2] US Congress, “Labor Management Relations Act”, 29 U.S.C. § 401-531, 1947.
[3] News Release, “Former Pepsi Worker Files Federal Charges Against Teamsters and Company for Illegally Firing him for Refusing to Pay Union Dues,” National Right to Work Legal Defense Foundation Inc., September 24, 2014, http://www.nrtw.org/en/press/2014/09/former-pepsi-worker-files-federal-ch (accessed February 23, 2015).
[4] Lydia DePillis, “Why Harris v. Quinn Isn’t as Bad for Workers as It Sounds,” The Washington Post, July 1, 2014, http://www.washingtonpost.com/blogs/wonkblog/wp/2014/07/01/why-harris-v-quinn-isnt-as-bad-for-workers-as-it-sounds (accessed February 26, 2015)
[5] James Sherk, “Unions Charge Higher Dues and Pay Their Officers Larger Salaries in Non–Right-to-Work States,” Heritage Foundation Backgrounder No. 2987, January 26, 2015, http://www.heritage.org/research/reports/2015/01/unions-charge-higher-dues-and-pay-their-officers-larger-salaries-in-nonright-to-work-states.
[6] Committee on Community Partnerships and Grassroots Power and the Executive Council, “Resolution 16: Building Enduring Labor-Community Partnerships,” AFL-CIO, 2013, http://www.aflcio.org/About/Exec-Council/Conventions/2013/Resolutions-and-Amendments/Resolution-16-Building-Enduring-Labor-Community-Partnerships (accessed February 26, 2015).
[7] In theory the Supreme Court’s decision in Communication Workers vs. Beck (1988) allows workers to opt out of union’s political spending. However, the government permits unions to charge many politicized activities, such as lobbying Congress and state legislatures, to Beck objectors. Further, the AFL-CIO has defined its organizational mission as moving America to the left on economic policy. Any dues that support the organization—even apart from direct political expenditures—support the organization and its politicized mission.
[8] Barry Hirsch, “Sluggish Institutions in a Dynamic World: Can Unions and Industrial Competition Coexist?” Journal of Economic Perspectives, Vol. 22, No. 1 (Winter 2008), pp. 153–176.
[9] Brigham R. Frandsen, “Union Effects,” Brigham Young University, December 24, 2014, https://economics.byu.edu/frandsen/Documents/unioneffects.pdf (accessed February 26, 2015).
[10] David Ellwood and Glenn Fine, “The Impact of Right-to-Work Laws on Union Organizing,” Journal of Political Economy, No. 95 (April 1987), pp. 250–273.
[11] F. J. Calzonetti and Robert T. Walker, “Factors Affecting Industrial Location Decisions: A Survey Approach,” in Henry W. Herzog Jr. and Alan M. Schlottman, ed., Industry Location and Public Policy (Knoxville, TN: University of Tennessee Press, 1991), pp. 221–240, and Roger W. Schmenner, Joel C. Huber, and Randall L. Cook, “Geographic Differences and the Location of New Manufacturing Facilities,” Journal of Urban Economics, No. 21 (1987), pp. 83–104.
[12] Daniel Tobergte, President of Northern Kentucky Tri-County Economic Development Program, testimony before the Labor and Industry Committee, Kentucky House of Representatives, March 13, 2014, http://www.ket.org/legislature/archives/?nola=WGAOS+015186&session=wgaos+015 (accessed February 26, 2015).
[13] Ron Starner, Mark Arend, and John McCurry, “Locked in on Labor,” Site Selection Magazine, July 2004, http://www.siteselection.com/issues/2004/jul/p500/ (accessed February 26, 2015).
[14] Dalton Workman, “More Employers Looking to Warren County, Kentucky After Right to Work Passes,” The Bluegrass Institute, February 10, 2015.
[15] Jobs expanded by 46 percent in right-to-work jurisdictions but only 20 percent in states with forced dues between 1990 and 2014. Heritage Foundation calculations using data from the Bureau of Labor Statistics, “State and Area Employment, Hours, and Earnings,” June 1990–October 2014. Figures include Michigan and Indiana as compulsory dues states as they implemented voluntary dues in 2013 and 2012, respectively. Oklahoma was omitted because it became a right-to-work state in 2001. Figures are weighted by total employment in states in June 1990. The unweighted average shows right-to-work states’ employment growing 49 percent and compulsory dues states growing 26 percent.
[16] Consolidated Edison Co. vs. NLRB, 305 U.S. 197 (1938), http://caselaw.lp.findlaw.com/scripts/getcase.pl?court=US&vol=305&invol=197 (accessed February 26, 2015).
[17] Retail Clerks v. Dry Lion Goods, 369 U.S. 17 (1962).
[18] Richard Sobel, “Empirical Evidence on the Union Free-Rider Problem: Do Right-to-Work Laws Matter?” Journal of Labor Research, No. 16 (1995), pp. 347–365. Sobel finds that 70 percent of workers covered by collective bargaining agreements but not paying union dues value union coverage less than the amount of union dues.
[19] AFL-CIO, “Right to Work,” 2015, http://www.aflcio.org/Legislation-and-Politics/State-Legislative-Battles/Ongoing-State-Legislative-Attacks/Right-to-Work (accessed February 26, 2015).
[20] Elise Gould and Heidi Shierholz, “The Compensation Penalty of ‘Right-to-Work’ Laws,” Economic Policy Institute, Briefing Paper No. 299, February 17, 2011, http://www.epi.org/publication/bp299/ (accessed February 26, 2015).
[21] George Borjas, Labor Economics, 3rd ed. (Columbus, OH: McGraw-Hill, 2005), pp. 413–415.
[22] James Sherk, “Auto Bailout Ignores Excessive Labor Costs,” Heritage Foundation WebMemo No. 2135, November 19, 2008, http://www.heritage.org/research/reports/2008/11/auto-bailout-ignores-excessive-labor-costs. Many in the media claim the $70 per hour figure included the legacy cost of previous retirees. It did not. It included the discounted value of future retirement and health benefits that current workers earned while on the job. See James Sherk, “UAW Workers Actually Cost the Big Three Automakers $70 an Hour,” Heritage Foundation WebMemo No. 2162, December 8, 2008, http://www.heritage.org/research/reports/2008/12/uaw-workers-actually-cost-the-big-three-automakers-70-an-hour.
[23] Heritage Foundation calculations were based on an average $30 per hour difference in compensation costs in 2006 for hourly employees in the Big Three over an average of 30 hours per unit, with hourly employees making up 73 percent of all U.S. employees, as well as union contracts adding an additional two hours per unit to construction times at General Motors relative to Toyota. See Sherk, “Auto Bailout Ignores Excessive Labor Costs”; Sherk, “UAW Workers Actually Cost the Big Three Automakers $70 an Hour”; U.S. Securities and Exchange Commission, “General Motors Corporation: Annual Report Pursuant to Section 13 or 15(d) of the Securities Exchange Act of 1934 for the Year Ended December 31, 2006,” http://www.sec.gov/Archives/edgar/data/40730/000095012407001502/k11916e10vk.htm (accessed February 26, 2015); and HARBOUR Consulting, “The HARBOUR Report: 2007 North America Press Release,” http://www.autonews.com/assets/PDF/CA2018861.PDF (accessed February 26, 2015).
[24] These are known as “crowding” and “complements” models. In the crowding model, the reduction of jobs in the union sector pushes workers into the non-union sector, lowering their wages. In the complements model, reduced demand for the goods of unionized companies because of higher prices also reduces the demand and hence wages for non-union workers, whose jobs are connected to that sector (e.g., suppliers to the unionized industry).
[25] Borjas, Labor Economics, pp. 413–415.
[26] Bruce E. Kaufman, “What Unions Do: Insights from Economic Theory,” Journal of Labor Research, Vol. 25, No. 3 (July 2004), pp. 351–382.
[27] David Neumark and Michael L. Wachter, “Union Effects on Nonunion Wages: Evidence from Panel Data on Industries and Cities,” Industrial and Labor Relations Review, Vol. 49, No. 1 (October 1995), pp. 20–38.
[28] Borjas, Labor Economics, pp. 413–415.
[29] Gordon Lafer, “‘Right to Work’ Is the Wrong Answer for Wisconsin’s Economy,” Economics Policy Institute, January 23, 2015, http://www.epi.org/publication/right-to-work-is-the-wrong-answer-for-wisconsin/ (accessed February 26, 2015).
[30] Inflation-adjusted compensation rose 23 percent among the middle quintile of nonelderly households with children. In the middle quintile of nonelderly households without children, real total compensation rose 19 percent. Congressional Budget Office, “The Distribution of Household Income and Federal Taxes, 2011,” November 2014, supplemental data, Tables 14 and 16, https://www.cbo.gov/publication/49440 (accessed February 26, 2015).
[31] During these years European economies were recovering from World War II; furthermore, German and Japanese heavy industry suffered extensive damage from allied bombing campaigns.
[32] Wisconsin State AFL-CIO, “PETITION: Stop RTW in Wisconsin,” December 16, 2014, http://wisaflcio.typepad.com/wisconsin-state-afl-cio-blog/2014/12/stop-rtw.html (accessed February 23, 2015).
[33] W. Robert Reed, “How Right-to-Work Laws Affect Wages,” Journal of Labor Research, Vol. 24, No. 4 (October 2003), pp. 713–730.
[34] Adam Bee, “An Evaluation of Retirement Income in the CPS ASEC Using Form 1099-R Microdata,” U.S. Census Bureau, March 2013, http://www.census.gov/library/working-papers/2013/demo/Bee-PAA-paper.html (accessed February 22, 2015).
[35] Pension Benefit Guaranty Corporation, “FY 2013 PBGC Projections Report,” 2013, http://www.pbgc.gov/documents/Projections-report-2013.pdf (accessed February 22, 2015).
[36] Congress passed multi-employer pension plan reforms in late 2014 designed to enable these pensions to restructure to avoid this financial cliff. It remains to be seen what effect this will have on plan solvency.
[37] Note that there is no need to include controls for cost of living when analyzing unemployment, and thus it is not necessary to use instrumental variables to correct for measurement error in cost-of-living indices.
[38] Elise Gould and Heidi Shierholz, “The Compensation Penalty of ‘Right-to-Work’ Laws,” Economic Policy Institute Briefing Paper No. 299, February 17, 2011, http://www.epi.org/publication/bp299/ (accessed February 26, 2015).
[39] Gould and Shierholz report the coefficient on a dummy variable from regressing RTW laws and other controls on the natural log of hourly pay. They report this coefficient as the percentage difference in average wages associated with RTW laws. Technically this is incorrect. For a binary variable like RTW status the percentage change in log wages is related to the coefficient on the dummy variable through the formula % change = , where e is the mathematical constant and β is the coefficient on the dummy variable in the semi-log regression. However, for small values of β the coefficient on the dummy variable will closely approximate the percentage change. See Robert Halvorsen and Raymond Palmquist, “The Interpretation of Dummy Variables in Semilogarithmic Equations,” The American Economic Review, Vol. 70, No. 3 (1980), pp. 474–475.
[40] Gordon Lafer and Alyssa Davis, “‘Right to Work’ Is the Wrong Answer for Wisconsin’s Economy,” January 23, 2015, http://www.epi.org/publication/right-to-work-is-the-wrong-answer-for-wisconsin/ (accessed February 26, 2015).
[41] The BEA provides Regional Price Parity (RPP) data to facilitate cost-of-living adjusted comparisons across states. Heritage chose the years 2008–2012 because the RPP is a new data product from the BEA and as of the time of this writing was only available for those years.
[42] See footnote 39. For the sake of facilitating comparisons with EPI this study refers to the coefficient on the log regressions as a percent change although that is not technically correct. For values below 2.6 percent these values are almost identical.
[43] In some cases education does not just make it easier to obtain but is in fact a legal prerequisite for highly paid jobs, as in medicine or the legal profession.
[44] Joshua Angrist and Jorn-Steffen Pischke, Mastering Metrics: The Path from Cause to Effect, (Princeton: Princeton University Press, 2014), pp. 214–217.
[45] Column 5 and the subsequent columns use the author’s preferred specification which also includes controls for citizenship, parental status and single-parent status. Single parenthood has been found to have a large negative effect on upward mobility and it should be controlled for. However, these variables have negligible little effects on the overall results. Excluding these variables results in a coefficient of 0.017 instead of 0.016 in column 5.
[46] Liberal groups have also pointed out that single parents tend to experience greater economic difficulties than married parents. See Deborah Povich, Roberts Brandon, and Mark Mather, “Low-Income Working Mothers and State Policy: Investing for a Better Economic Future,” 2013, http://www.workingpoorfamilies.org/wp-content/uploads/2014/02/WPFP_Low-Income-Working-Mothers-Report_021214.pdf (accessed February 26, 2015).
[47] EPI used two measures of cost of living: data from the Missouri Economic Research and Information Center and data from the Political Economic Research Institute (PERI) on differences in rental costs across states. The Heritage Foundation used more accurate Regional Price Parity data now produced by the Bureau of Economic Analysis. Appendix B explains the differences between these measures in greater detail.
[48] It is not clear from their report if Gould and Shierholz used the log of these cost-of-living indicators or the level. In a semi-log regression the appropriate control to use is the log of the price index. Heritage used the log of the price index throughout this replication when it included direct controls for cost of living.
[49] See the detailed results in Appendix C. The coefficient on the RPP variable is approximately 0.7. So in a state with 10 percent below-average cost of living the model adjusts wages by approximately 7 percent, not the 10 percent needed to maintain constant purchasing power.
[50] Michael DuMond, Barry Hirsch, and David Macpherson, “Wage Differentials across Labor Markets and Workers: Does Cost of Living Matter?” Economic Inquiry, Vol. 37, No. 4 (October 1999), pp. 577–598.
[51] John Winters, “Wages and Prices: Are Workers Fully Compensated for Cost of Living Differences?” Regional Science and Urban Economics, Vol. 39, No. 5 (September 2009), pp. 632–643.
[52] This is a classic case of omitted variable bias. The measured COL index only partially controls for true COL. This leaves RTW correlated with the true COL differences remaining in the error term.
[53] These figures exclude federal employees because the federal government is entirely RTW and federal wages are determined by the General Schedule and federally determined cost-of-living adjustments for various regions. State RTW laws have no effect on federal pay.
[54] Lawrence Mishel, Josh Bivens, Elise Gould, and Heidi Shierholz, “Appendix B,” in The State of Working American 12th Edition (Ithaca, NY: Cornell University Press, 2012), pp. 460–747, http://stateofworkingamerica.org/files/book/Appendices.pdf/ (accessed February 26, 2015).
[55] In fact the CEPR adjustments were developed in conjunction with EPI staff.
[56] In this report the choice of inflation deflator makes little difference to the final results.
[57] The full Heritage race variable is slightly more comprehensive than that used by EPI. EPI used white, black, Hispanic, Asian, and other categories. Heritage used white, black, Hispanic, Asian, mixed-race, and other. Similarly, EPI categorized individuals as either married or single. Heritage used a more detailed marital status categorization: married, divorced, widowed, separated, or never married.
[58] This specification, of course, excluded the logged RPP variable.
[59] Bettina H. Aten and Eric B. Figueroa, “Real Personal Income and Regional Price Parities for States and Metropolitan Areas, 2008–2012,” Bureau of Economic Analysis, June 2014, http://www.bea.gov/scb/pdf/2014/06%20June/0614_real_personal_income_and%20_regional_price_parities_for_states_and%20metrpolitan_areas.pdf (accessed February 26, 2015).
[60] Note that error in an independent variable biases regression coefficients. Errors in the dependent variable produces unbiased but inefficient estimates.