Businesses with monopolies charge higher prices and operate less efficiently than they would facing competition. Labor unions operate no differently. Unions charge workers more and spend their money less carefully in states where they can compel workers to purchase their services. Union financial reports reveal that they charge workers roughly 10 percent higher dues and pay their full-time top officers $20,000 more annually in states with compulsory dues.
Several states and local governments are considering right-to-work laws to make paying union dues voluntary. Such laws would prevent unions from charging their members monopoly prices.
Competition vs. Monopoly
One of the most widely accepted facts in economics is that monopolies with no fear of competition harm consumers. Any introductory economics textbook explains that monopolists raise prices beyond what they could charge if they faced competition.[1] This raises the monopolists’ profits at the cost of even greater losses to consumers. For example, throughout most of the 20th century the De Beers cartel controlled most of the world’s diamond supply. It used this monopoly to restrict production and drive up diamond prices.[2]
Economists have also discovered that the managers of monopolistic firms often take advantage of their position to make their lives easier. They do not work as hard to hold down costs or to innovate, and they often pay themselves higher salaries.[3] This “X-Inefficiency” further increases the economic damage caused by unchecked monopolies: Managers do not work as hard without competition.
The Union Monopoly
In many American states, labor unions enjoy a legal monopoly.[4] In jurisdictions without right-to-work laws, union contracts force workers to pay dues as a condition of employment, irrespective of the value that they believe their union provides. For example, the Teamsters recently had Michael Romanchock fired from his job at a Pepsi bottling plant in Ebensburg, Pennsylvania. Romanchock had worked at the plant for nine months without even realizing Teamsters Local 110 had organized it.[5] He learned about his union representation when Local 110 sent him a letter demanding full dues—roughly $600 a year.[6] When he refused to pay for services he had not even noticed, “his” union had him fired.
With compulsory dues, unions do not need to earn workers’ support—they can compel it. Even top union officials see that this monopoly does not benefit workers. As Gary Casteel, Southern Region director for the United Auto Workers (UAW), stated:
This is something I’ve never understood, that people think right to work hurts unions…. To me, it helps them. You don’t have to belong if you don’t want to. So if I go to an organizing drive, I can tell these workers, “If you don’t like this arrangement, you don’t have to belong.” Versus, “If we get 50 percent of you, then all of you have to belong, whether you like to or not.” I don’t even like the way that sounds, because it’s a voluntary system, and if you don’t think the system’s earning its keep, then you don’t have to pay.[7]
Approximately three-quarters of union members live in states where they must pay dues.[8] Dues come out of these workers’ paychecks whether or not they believe their union has earned its keep. Economic theory predicts that unions would take advantage of this monopoly to charge their members higher dues and that this monopoly would reduce the pressure to hold down costs, including the salaries of top union officers.
Some evidence indicates unions in fact act like other monopolies. Polls show that a majority of union members believe that their dues are too high for the value they receive.[9] Press reports often highlight the high salaries that top union officers collect.[10] However, to date, economists have given little empirical attention to whether unions institutionally take advantage of their monopoly position. Newly available data now allow economists to examine this question.
Union Financial Transparency Reports
In the wake of hearings documenting Mafia influence over major unions, Congress passed the Labor-Management Reporting and Disclosure Act (LMRDA) of 1959. The law requires every private-sector union to disclose how it spends its members’ dues. Congress intended this transparency to deter corruption and misconduct, but left large loopholes in the reporting requirements. Unions could classify most of their expenses as “miscellaneous” with no further detail.
During the George W. Bush Administration, Labor Secretary Elaine Chao modernized the regulations to require unions to itemize their expenses. She also had the Department of Labor release the transparency reports online. This data, available from 2005 to 2013, enables researchers to examine how much unions collect in dues and how much they pay their top officers.
The LMRDA reports do not contain all of the information that researchers would ideally want. Unions strongly resisted this disclosure and fought numerous court and regulatory battles against it. They succeeded in delaying the promulgation of two major rules until shortly before President Barack Obama took office. These rules would have required unions to disclose the total compensation—including benefits—of their officers and required disclosure from union trust funds, such as strike benefit funds. Some unions pay their officers supplemental salaries from trust funds that they control.
Shortly after his inauguration, President Obama rescinded these disclosure requirements. As a result the LMRDA reports include neither benefits nor payments from union trusts. Nonetheless, they provide more detail on union financial activities than was previously available. Online publication has made this data far more accessible. The Chao reforms now allow researchers to determine the base salaries of top union officers and the average dues that union locals charge their members.[11] The Appendix explains in detail how the data were compiled.
Average Dues
Table 1 shows the median and average dues unions charge their members. These figures were calculated by dividing the total union dues income by the total membership unions reported on their disclosure forms. Table 1 and most other tables in this report present the data in two ways: weighted and unweighted. The unweighted data treat a union local with 100 members and a local with 1,000 members equally. The weighted figures are weighted by the number of members in the union. For example, a local with 1,000 members counts 10 times more than the 100-member local. Both figures provide insights into how unions respond to right-to-work laws. The unweighted numbers show their impact on the typical union. The weighted numbers show their impact on the typical union member.[12]
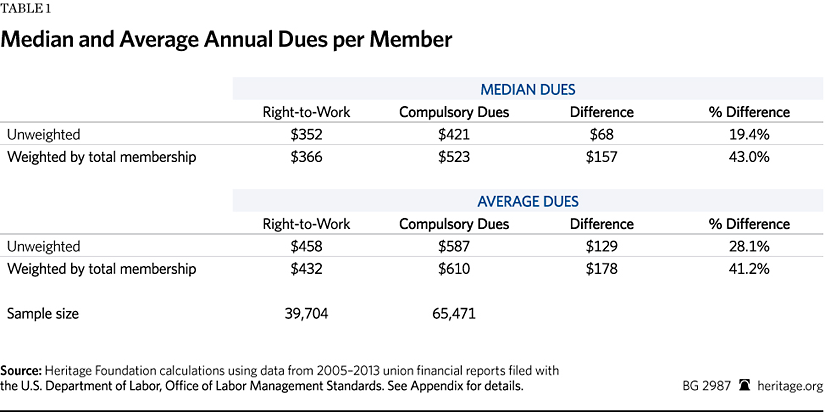
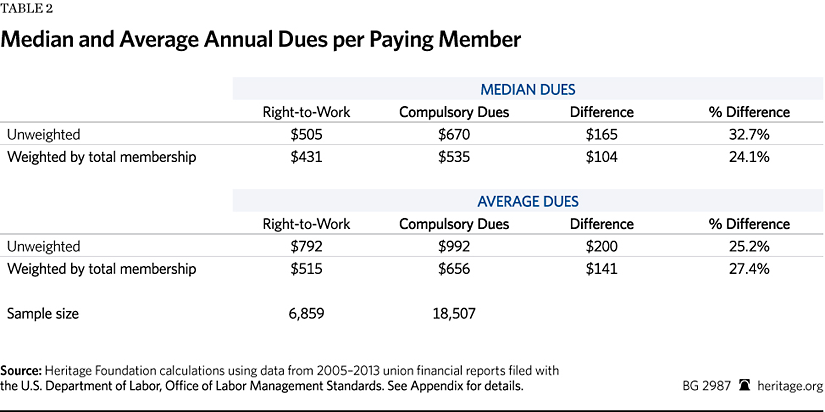
Table 1 shows that unions charge workers greater dues in states where they can compel payment. Whether looking at medians or averages, weighted or unweighted data, unions charge substantially higher dues in every case. For example, the average union member pays $432 per year in right-to-work states, but $610 a year in states with compulsory dues—41 percent more.[13]
Table 2 shows another way of examining dues costs: dues per paying member. Many unions have members who formally belong to the union but do not pay dues. These include retired members, inactive members, and honorary members. Larger unions file more thorough disclosure forms that enable researchers to identify nonpaying members.[14] Table 2 breaks down dues per paying members for this smaller subset of unions.
Again, unions charge higher dues per paying member in non–right-to-work states. The average dues-paying union member pays $515 per year in right-to-work states versus $656 per year for paying members in states with mandatory dues—a 27 percent difference.[15]
However, higher average dues in non–right-to-work states do not necessarily mean that unions take advantage of their monopoly to extract money from workers. Other factors could be at work. For example, unions frequently deride right to work as “right to work for less” because workers have lower wages in right-to-work states. This happens because right-to-work states—concentrated in the South—have lower costs of living and because the South was historically less developed than the North long before states began passing right to work. Studies controlling for such differences find that workers in right-to-work states make no less, possibly more, than in states with compulsory dues.[16]
Similarly, unions often charge dues as a proportion of workers’ incomes. If right-to-work states have lower wages and costs of living this would naturally lead to lower dues payments. Further, different unions often represent different types of workers with different wage levels. For example, the UAW primarily represents well-paid manufacturing employees, but has had little success in persuading Southern workers to join. If manufacturing union membership is concentrated in non–right-to-work states, average dues will be higher in those states no matter how individual locals set their rates.
Controlling for Other Factors
Economists use regression analysis to control for such extraneous factors. Tables 3 and 4 show the results of regressing average dues per member[17] on mandatory dues requirements and several control variables. Both tables display the results for both average dues per member and dues per paying member. Table 3 presents the unweighted results, while Table 4 shows the results weighted by total union membership and total paying membership.
The tables display average percent difference in dues per member which can be attributed to forced unionization. The p-values, also reported in the tables, indicate the probability the results differ from zero by random chance. Any p-value less than 0.05 is considered statistically significant. Since all the p-values are 0.012 or less, the results are statistically significant. The Appendix describes these regressions in more detail.
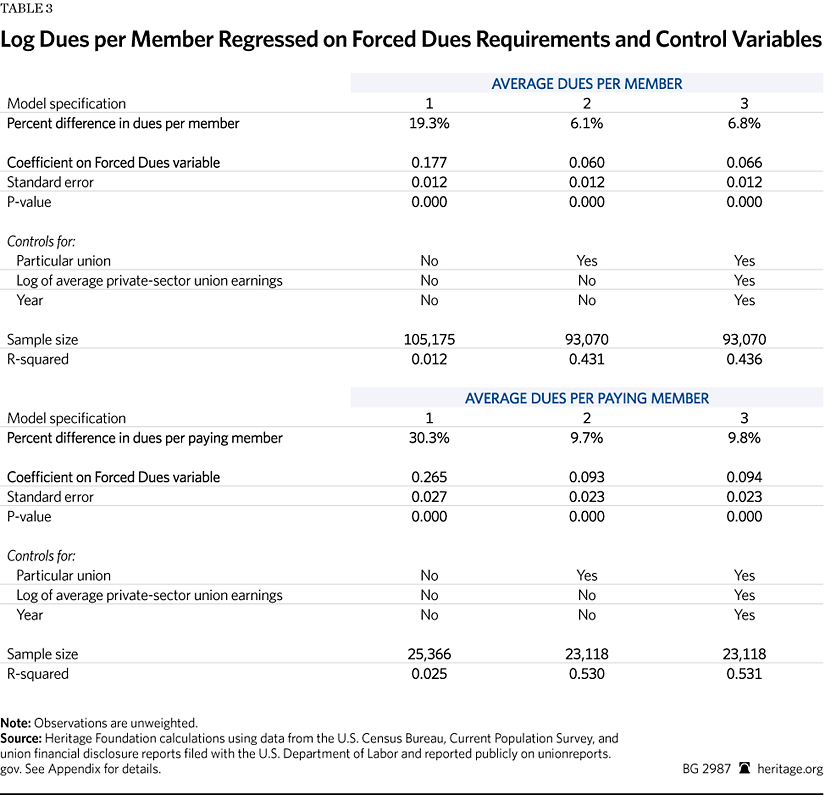

The first column in each table shows the results of regressing dues per member (in log form) on just forced-dues requirements. As in Tables 1 and 2, the regression finds that unions charge significantly higher dues in non–right-to-work states: between 19 percent and 30 percent more in the unweighted regressions. Weighting for union membership increases the disparity to between 37 percent and 48 percent greater dues.[18] Larger unions appear to charge disproportionately higher dues in non–right-to-work states than smaller unions do.
The second column controls for the particular international union, such as the United Auto Workers, the United Food and Commercial Workers, and the Service Employees International Union. This controls both for differences in dues structures between unions—some unions charge higher dues than others—and differences in average wages between members of different unions. Tables 3 and 4 demonstrate the importance of controlling for such factors. The estimated premium that unions charge their members in non–right-to-work states drops by approximately two-thirds in the second column. Much of the difference in union dues between right-to-work states and non–right-to-work states comes from differences in which unions operate in those states. However, the remaining premium remains highly statistically significant.
The third and final column controls for time effects and for the average weekly wages of union members in that state and year. This captures remaining differences in wages between union members across states, such as those driven by differences in cost of living. These additional variables have little effect on the overall results, which remain highly statistically significant.
The unweighted numbers show that the average union charges its members 7 percent to 10 percent more in states where it can force workers to pay dues. The weighted numbers show the average union member gets charged 14 percent to 15 percent more in non–right-to-work states. Larger unions with more members appear to charge higher premiums.
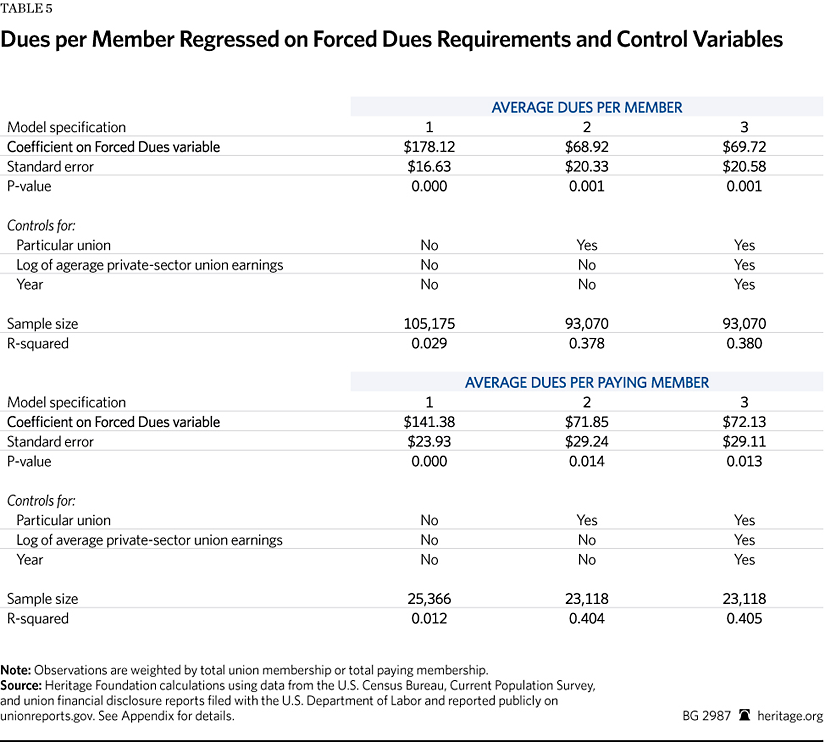
Table 5 shows the results of simply regressing dues per member—with no logs—on control variables. For the sake of conserving space, Table 5 shows only weighted results. The unweighted regressions show similar results. As Column 3 shows, after controlling for other factors, unions still charge their members approximately $70 per year more in states lacking right-to-work protections.
These results show that unions act like corporations when using their monopoly power. Many union officers are undoubtedly honorable—as are many corporate officers. Nonetheless, both unions and corporations institutionally tend to raise prices when their customers have no other options. Unions with the ability to compel payment charge workers approximately one-tenth more than unions that must earn their members’ voluntary support. Right-to-work laws pressure unions to reduce costs and improve service or risk losing members.
Union Officer Salaries
This raises the question of how unions spend the additional dues that they charge in non–right-to-work states. If unions act like corporate monopolies, they would pay some of this money to union officers in the form of higher salaries. Competitive firms try to reduce unnecessary costs—including labor costs—to keep their prices down. Monopolies that do not fear competition often operate with considerable slack, including higher pay for their employees and managers.[19]
Unions appear to act no differently. Table 6 shows the average salaries for full-time employees in the top four positions in many unions: president, vice president, business manager, and treasurer.[20] These figures include only gross salary payments that an individual union reports on its disclosure forms. They do not include benefits or supplemental payments from other union entities.
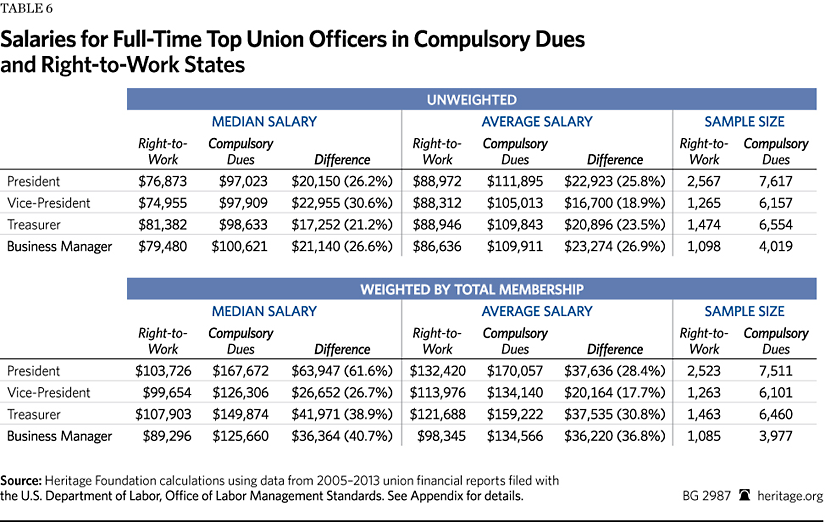
Union officers make considerably more in non–right-to-work states. Without weighting by membership, the average union with a full-time president pays him just under $90,000 annually in a right-to-work jurisdiction and just over $110,000 annually in states with compulsory dues. Likewise, the median union with a full-time president pays him about $20,000 more in non–right-to-work states.
Weighting by union membership increases average union salaries because larger unions tend to pay more. The weighted figures show the salaries paid to full-time officers in the unions to which the average union member belongs.
In most cases, weighting increases the salary difference between right-to-work and non–right-to-work states. The average union member has a union president who makes $170,000 annually in states with compulsory dues, but only $132,000 in states with voluntary dues—a $38,000 difference.
Again, other factors could influence this gap. Southern states—almost entirely right to work—generally have lower wages and lower costs of living.[21] Economists would expect unions in these states to pay lower salaries. As with dues charged, controlling for other factors substantially reduces the difference between right-to-work and compulsory-dues states. However, a significant premium for union officers in non–right-to-work states remains.
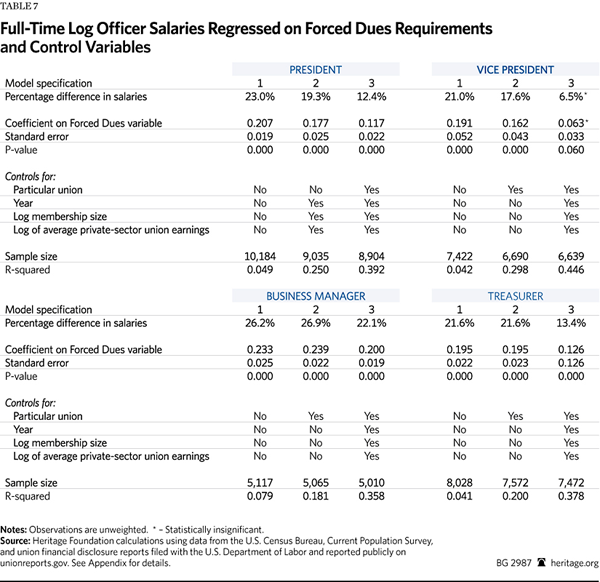
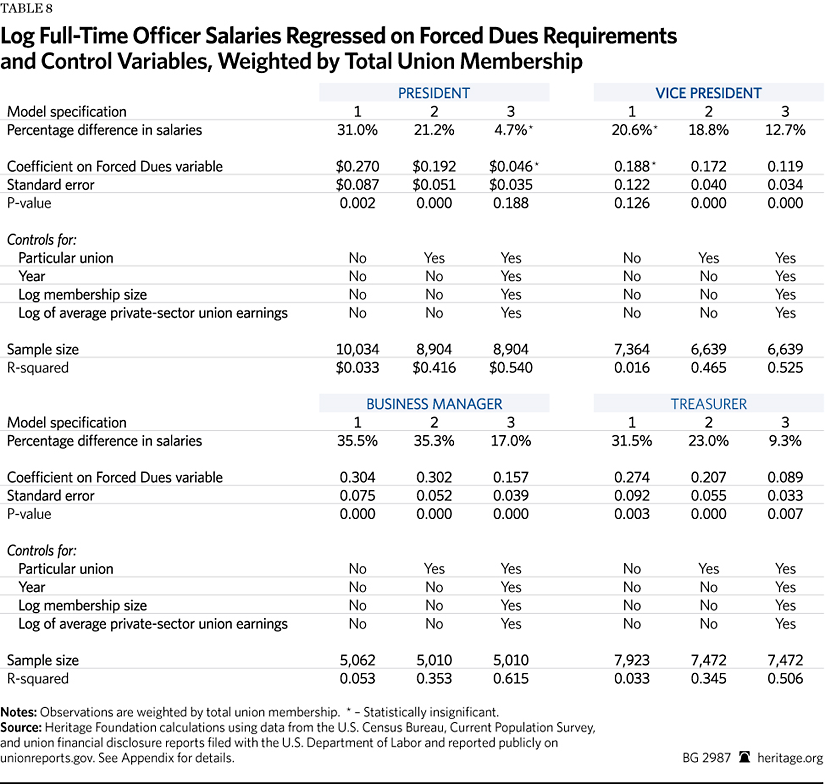
Table 7 and Table 8 show the unweighted and weighted regressions for the log of union officers’ salaries on forced-dues requirements and control variables for each of the four separate union positions. They follow the same format as the regressions on dues per member. The first column shows a simple regression of logged salaries on an indicator for compulsory-dues requirements. The second column adds controls for the particular international union that employs the officers. The third column adds controls for average union member (not officer) earnings in that state and year, the size of the union, and the particular year.[22] All figures are in inflation-adjusted 2013 dollars.
In the unweighted regressions, after controlling for all other factors and looking only at full-time employees, the average union pays its president 12 percent more, its vice presidents 7 percent more, its business manager 22 percent more, and its treasurer 13 percent more in states with forced dues. The differences are highly statistically significant for presidents, business managers, and treasurers. The estimate for vice presidents was statistically significant at the 6 percent level.
Weighted by union membership and controlling for other factors, the pay premium for the average union members’ president is not statistically significant.[23] However, the other three offices all show large and highly significant pay differences for full-time employees. The typical union members’ vice presidents make 13 percent more, business managers make 17 percent more, and treasurers make 9 percent more in the absence of a right-to-work law.
Table 9 shows the results of regressing dues requirements and control variables on officers’ gross salaries (instead of the log). To conserve space and for ease of presentation, the table shows only the preferred model specification in the third column of Tables 7 and 8, which includes all of the control variables. It is also weighted by union membership.[24]
This linear specification continues to show that, after controlling for other factors, full-time union officers collect substantially higher salaries in states with compulsory dues. Union presidents make $12,800 more per year, vice presidents make $19,500 more, business managers make $30,000 more, and treasurers make $23,200 more.
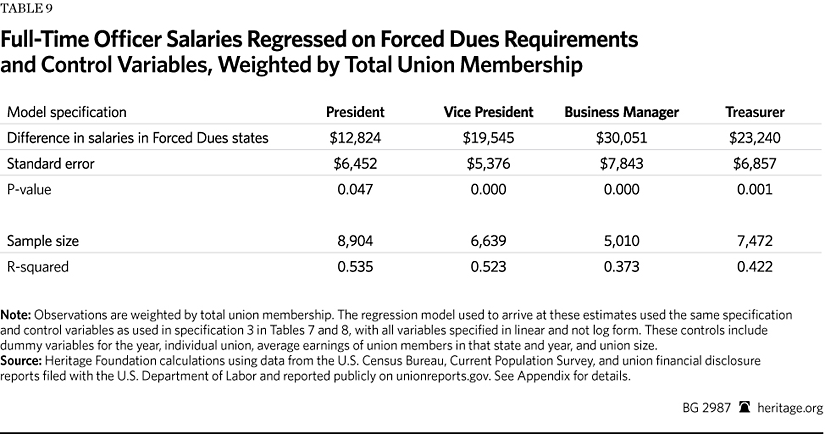
The officers representing the typical union member make roughly $20,000 more per year thanks to forced unionization. Compulsory dues enable unions to force workers to pay higher dues. Part of those funds flow back to their officers in the form of higher salaries.
Right to Work Protects Workers
Compulsory dues give unions a monopoly in the workplace. The absence of a right-to-work law forces workers to purchase union representation regardless of how their union performs. UAW Committeeman Chad Poynor recently admitted to The New York Times: “You hear people all the time say, ‘If I were in a right-to-work state, I’d withdraw.’”[25]
Unions use their monopoly position the same way corporations do. They raise their prices and pay their employees more. Because workers in non–right-to-work states cannot opt out, unions have little incentive to hold down either dues or labor costs.
Of course, many union officers truly want to improve workers’ lives. However, without right-to-work laws, unions face few institutional pressures to put their members’ interests first. They do not need to persuade workers that the benefits of union representation outweigh its costs. They can simply force them to pay dues or be fired. The lack of incentives to economize leads to higher costs for union members and inflated salaries for their officers.
Unions complain that right to work forces them to represent free riders. Besides its legal inaccuracy, this claim has the problem backwards.[26] The absence of right-to-work laws allows unions to free ride on captive customers. Controlling for other factors, unions charge 10 percent higher dues and pay their top officers $20,000 more annually in non–right-to-work states.
Right-to-work laws protect workers from a union monopoly. Voluntary dues require unions earn workers’ support.
—James Sherk is Senior Policy Analyst in Labor Economics in the Center for Data Analysis, of the Institute for Economic Freedom and Opportunity, at The Heritage Foundation.
Appendix
The Heritage Foundation’s Center for Data Analysis (CDA) calculated these figures using data for 2005–2013 from the Department of Labor’s Office of Labor-Management Standards (OLMS) yearly labor-management (LM) data and the Current Population Survey. These data are publicly available online at no cost.[27]
All LM forms require unions to identify how many members they had that year. The subset of unions that file the LM-2 forms must also break down their members by category. The CDA used a regular expression match to identify subgroups of these categories unlikely to pay dues, such as members in the “laid off,” “retired,” and “free dues” categories. These members were subtracted from the larger category of overall membership to arrive at an estimate of the number of dues-paying members in union locals filing LM-2 forms. The CDA constructed the dues-per-member and dues-per-paying-member variables by dividing the total amount that a union reported collecting in dues and agency fees by the number of members and dues-paying member variables, respectively. All the dues and officer salary figures were converted to 2013 dollars using the Personal Consumption Expenditures price index.
The LMRDA applies to unions that have at least one private-sector member. Consequently, the LMRDA filings used in this analysis exclude the local chapters of most government unions. Some government unions do represent private-sector workers, such as teachers unions that have organized private schools. Such unions must file federal disclosure reports, and this analysis includes them.
In many unions, local chapters directly collect dues. Those locals then remit a per-capita tax to their state and/or international headquarters. The state and national headquarters consequently report far lower “dues per member” because their income comes from levies on their local chapters, not directly collected dues. The CDA excluded such unions from the dues-per-member analysis by examining only unions that derived at least two-thirds of their revenues from dues and agency fees.
Some unions reported implausibly large or small annual dues-per-member figures even after this exclusion. For example, one union charged an estimated $1 per member per year, while another charged more than $1,000,000 per member per year. Such outliers are primarily the result of either (a) data or reporting errors, such as misplaced decimal places and zeros in completed forms, or (b) state or national headquarters with limited direct dues income, but large memberships. To prevent such data errors from biasing the results, the CDA restricted attention to unions that charged more than $50 but less than $10,000 in annual dues. This captures over 95 percent of unions while excluding implausible outliers. The results were robust to using alternative cutoffs.
The CDA used a regular expression match on the job titles reported in the OLMS filings to create dummy variables identifying the four top positions in most unions: president, vice president, business manager, and treasurer (sometimes secretary-treasurer). The categories are mutually exclusive. Someone reported as “president and treasurer” on the forms was classified in this analysis as only a union president and not as a treasurer.
The LMRDA filings do not directly indicate full-time and part-time or full-year and part-year employees. Taken at face value, this can produce seriously misleading estimates of union compensation. For example, in 2011, Carpenters Local 1024 reported paying its president $2,130 on its LM-2 forms.[28] Further analysis of the local’s 990 forms filed with the IRS revealed that the president reported working two hours a week. To focus the analysis on full-time employees, the CDA excluded officers who did not make at least $50,000 a year. These restrictions considerably reduced the sample size. Sensitivity tests found that removing this restriction produced similar results to those presented in the main paper.[29] Also excluded were officers who did not work for the union the year before or the year after the filing so as to exclude employees who joined or left the union partway through the year.[30]
The CDA identified workers as subject to compulsory dues if they (1) lived in a non–right-to-work state or (2) belonged to a union subject to the Railway Labor Act, principally airline and railway unions. It excluded unions located in Indiana or Michigan after they passed their right-to-work laws, as well as unions located in Washington, DC. The right-to-work status of these unions was ambiguous. Indiana and Michigan passed right-to-work laws, which took effect in 2012 and 2013, respectively, and applied only to union contracts renewed after that time. Many unions filing LMRDA reports in those states still enjoyed compulsory-dues powers in 2013. For example, the UAW contracts with the Big Three automakers requiring compulsory dues run through 2015. Many unions representing workers in both right-to-work and non–right-to-work states have their national headquarters in Washington.
The CDA used a regular expression match on union names in LM filings to create dummy variables for the most common unions to which workers belong, such as the Machinists, the Boilermakers, and the Food and Commercial Workers.
Data from the Current Population Survey outgoing rotation groups was used to estimate the average weekly earnings of private-sector unions by state and year. These averages excluded union members with imputed earnings because the Census Bureau does not use union membership status as a matching variable for imputation.
The CDA conducted the analysis using OLS regressions on the log and level of dues per member and officer salaries. The CDA used heteroskedasticity robust errors clustered by union local throughout. One concern is that clustering does not sufficiently account for the increase in sample size driven by the panel dimension of the data—repeated observations from many of the same unions over time. The CDA ran the analysis in a panel-data format using Driscoll-Kraay standard errors and found very similar results.[31] It also ran the analysis using a panel data specification and both random effects and between effects estimators. The results from these analyses were also highly statistically significant and very similar to the unweighted regressions reported here. Stata does not produce weighted random effects or between effects estimates.
The CDA did not use either state or union local fixed effects in its analysis because right-to-work laws varied little within states or union locals during this period. Including such fixed effects would absorb all variation in right-to-work status except that caused by passage of the Indiana and Michigan right-to-work laws in 2012—laws that had not taken effect for many union locals by 2013.
Additional variables included dummy variables for year, the particular international union representing workers, the log or level of average union earnings, and total union membership. Alternative specifications for the control variables, such as higher-order polynomials of union membership size, had little effect on the overall results.
When weighting union officers’ salaries by union membership, the CDA divided by the total number of such officers in that union local. For example, if a union local had three vice presidents the analysis would give each of those officers’ salary one-third of the weight of a solitary vice president’s salary in a local with the same number of members. This was done so that the final weighted estimates would reflect the average salaries paid to the top officers representing the typical union member.
The CDA also examined the effect of forced-dues requirements on total disbursements to union officers, including both gross salaries and reimbursements for official expenses such as work meals and travel expenses. Mandatory dues requirements had a modestly larger effect on total disbursements than on gross salaries. However, detailed examination of whether the additional disbursements beyond salaries resulted from a greater workload or from additional non-salary compensation is beyond the scope of this paper. These results are available from the author upon request.


