Chairman Huffman, Ranking Member McClintock, and other Members of the subcommittee, thank you for the opportunity to testify about healthy oceans and healthy economies. My name is Kevin Dayaratna. I am the Senior Statistician and Research Programmer at The Heritage Foundation. The views I express in this testimony are my own and should not be construed as representing any official position of The Heritage Foundation.
Energy is the fundamental building block of civilization from flipping on a light switch, to starting up our cars, to enabling this very hearing to operate. Unfortunately, however, many people take energy for granted. Over the course of the past decade, it has been a fundamental goal of policymakers in Washington to expand regulations across the energy sector of the economy. As a result, it is important to quantify the impacts of this fundamental building block both in terms of the economy as well as in terms of the climate. Over the course of my work at The Heritage Foundation, my colleagues and I have used the same models that the federal government has used to quantify these impacts ourselves. We have found in our work published both at Heritage and in the peer-reviewed literature that these policies aimed at decarbonization are predicated on user-manipulated models. Moreover, we have found that these policies will result in devastating economic impacts along with negligible impacts on the climate. Policies aimed at taking advantage of our vast oil and gas supply, on the other hand, will grow the economy for years to come.
The Justification Behind These Regulations
For much of the past decade, the federal government has sought to expand regulations across the energy sector of the economy. One of the primary justifications for doing so has been the social cost of carbon (SCC), which is defined as the economic damages associated with a metric ton of carbon dioxide (CO2) emissions summed across a particular time horizon.REF
There are three primary statistical models that the Interagency Working Group (IWG) has used to estimate the SCC—the DICE Model, the FUND model, and the PAGE model.REF Over the past several years at The Heritage Foundation, my colleagues and I have used the DICE and FUND models, testing their sensitivity to a variety of important assumptions. Our research, published as Heritage Foundation publications, in the peer-reviewed literature, and discussed in my prior congressional testimony, has repeatedly illustrated that although these models might be interesting academic exercises, they are extremely sensitive to very reasonable changes to assumptions.REF These models can be manipulated by user-selected assumptions and are thus not legitimate for guiding regulatory policy.
These models are estimated by Monte Carlo simulation. The general idea behind Monte Carlo simulation is that since some aspects of the models are random, the models are repeatedly estimated to generate a spectrum of probable outcomes. As a result of principles in probability theory, repeated estimation for a sufficient amount of time provides a reasonable characterization of the SCC’s distributional properties.
As with any statistical model, however, these models are grounded by assumptions. In our work, my colleagues and I have rigorously examined three important assumptions: the choice of a discount rate, a time horizon, and the specification of an equilibrium climate sensitivity distribution.
Discount Rate
The concept of discount rates is best viewed by considering an expenditure today as a benefit in the future via an investment. Discounting future benefits of averting climate damage compares the rate of return from CO2 reduction to the rate of return that could be expected from other investments. In principle, discounting runs the compound rate of return exercise backwards, calculating how much would need to be invested at a reasonably expected interest rate today to result in the value of the averted future climate damage.REF
The Environmental Protection Agency has run these models using 2.5 percent, 3.0 percent, and 5.0 percent discount rates despite the fact that the Office of Management and Budget guidance in Circular A-4 has specifically stipulated that a 7.0 percent discount rate be used as well.REF In my research, we re-estimated these models using a 7.0 percent discount rate in a variety of publications. Below are our results published in the peer-reviewed journal Climate Change Economics:
As the above tables illustrate, the SCC estimates are drastically reduced under the use of a 7.0 percent discount rate. In fact, under the FUND model, the estimates are negative, suggesting that there are actually benefits to CO2 emissions. These changes in the discount rate can cause the SCC to drop by as much as 80 percent or more.
Time Horizon
It is essentially impossible to forecast technological change decades, let alone centuries, into the future. Regardless, however, these SCC models are based on projections 300 years into the future. In my work at Heritage, I have changed this time horizon to the significantly less, albeit still unrealistic, time horizon of 150 years into the future, and we obtained the following results for the DICE model in our work published in 2013:REF
Clearly, the SCC estimates drop substantially as a result of changing the end year (in some cases by over 25 percent).
Equilibrium Climate Sensitivity (ECS) Distribution
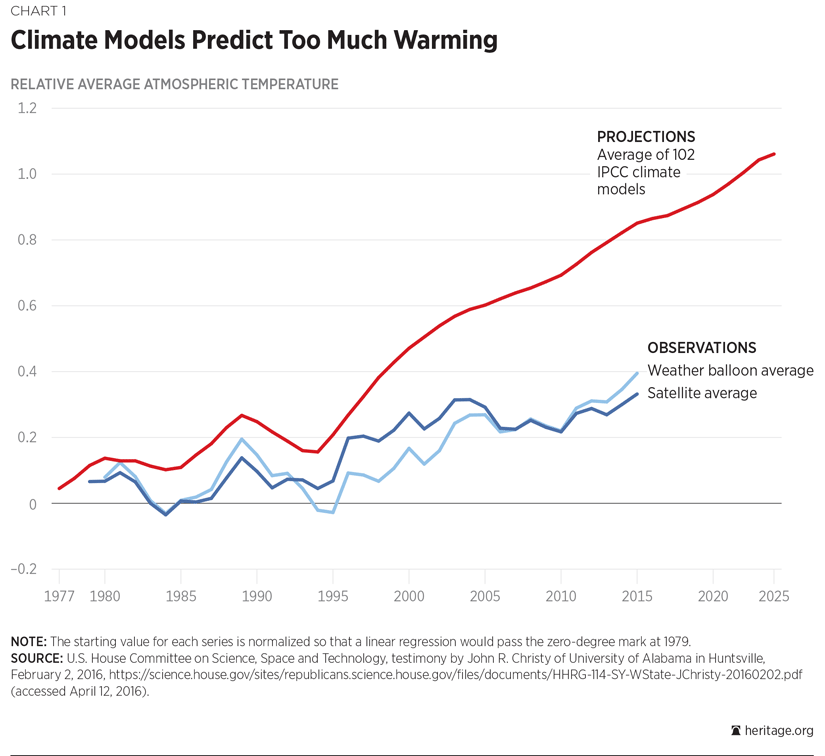
These models, of course, take into account assumptions regarding the planet’s climate sensitivity. The real question, however, is the degree of accuracy statistical models have at doing so. Professor John Christy testified in both 2013 and 2016 regarding the efficacy of climate change projections and juxtaposed them against actual weather balloon and satellite data.REF Christy has exposed the sheer inadequacy of the Intergovermental Panel on Climate Change’s (IPCC) models in forecasting global temperatures:
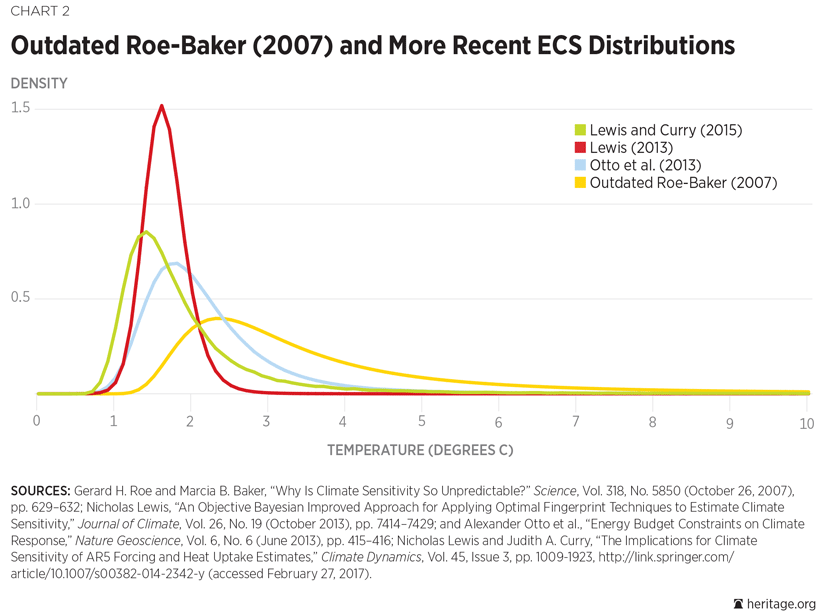
The climate specification used in estimating the SCC is that of an ECS distribution. These distributions probabilistically quantify the earth’s temperature response to a doubling of CO2 concentrations. The ECS distribution used by the IWG is based on a paper published in the journal Science twelve years ago by Gerard Roe and Marcia Baker. This non-empirical distribution, calibrated by the IWG based on assumptions that the group decided on climate change in conjunction with IPCC recommendations, has been deemed to be “no longer scientifically defensible.”REF Since then, a variety of newer and more up-to-date distributions have been suggested in the peer-reviewed literature. Many of these distributions, in fact, suggest lower probabilities of extreme global warming in response to CO2 concentrations. Below are a few such distributions:REF
The area under the curve between two temperature points depicts the probability that the earth’s temperature will increase between those amounts in response to a doubling of CO2 concentrations. Thus, the area under the curve from 4 degrees C onwards (known as a “tail probability”) provides the probability that the earth’s temperature will warm by more than 4 degrees Celsius in response to a doubling of CO2 concentrations. Note that the more up-to-date ECS distributions (Otto et al., 2013; Lewis, 2013; Lewis and Curry, 2015) have significantly lower tail probabilities than the outdated Roe-Baker (2007) distribution used by the IWG. In our research published in Climate Change Economics, we re-estimated the SCC having used these more up-to-date ECS distributions and obtained the following results:REF
Again, we notice drastically lower estimates of the SCC using these more up-to-date ECS distributions. These results are not surprising—the IWG’s estimates of the SCC were based on outdated assumptions that overstated the probabilities of extreme global warming, which artificially inflated their estimates of the SCC.
Negativity
When people talk about the social cost of carbon, they tend to think of damages. Not all of these models, however, suggest that there are always damages associated with CO2 emissions. The FUND model, in fact, allows for the SCC to be negative based on feedback mechanisms due to CO2 emissions. In my research at The Heritage Foundation, we computed the probability of a negative SCC under a variety of assumptions. Below are some of our results published both at Heritage as well as in the peer-reviewed journal Climate Change Economics:REF
As the above statistics illustrate, under a very reasonable set of assumptions, the SCC is overwhelmingly likely to be negative, which would suggest the government should, in fact, subsidize (not limit) CO2 emissions. Of course, we by no means use these results to suggest that the government should actually subsidize CO2 emissions, but rather to illustrate the extreme sensitivity of these models to reasonable changes to assumptions and can thus be quite easily fixed by policymakers.
Economic Impact
In our research at The Heritage Foundation, we used the Heritage Energy Model, a clone of the Department of Energy’s National Energy Modeling System to quantify the economic impact of both implementing further carbon-based regulations as well as repealing existing ones. One policy we analyzed was the Clean Power Plan, a policy initiated by the Obama Administration to regulate carbon-based emissions. We found that by 2035, the policy would result in an average employment shortfall of over 70,000 lost jobs, a loss of income of more than $10,000 for a family of four, an up to 5 percent increase in household electricity expenditures, and an aggregate $1 trillion loss in gross domestic product (GDP). I discussed these facts during congressional testimony for the House, Sciences, and Technology Committee in June 2016.REF
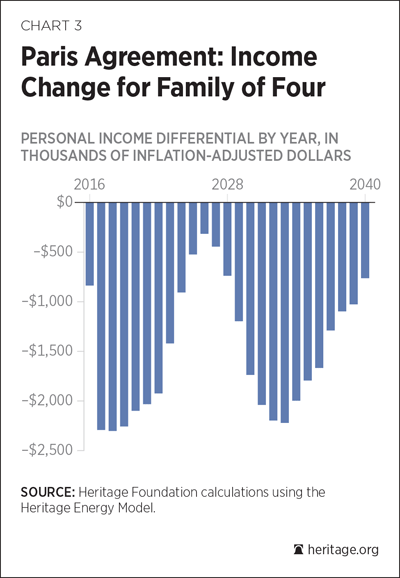
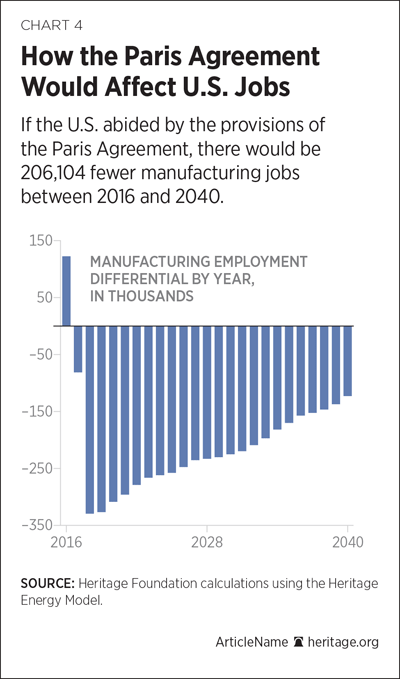
In addition, we also used the Heritage Energy Model to quantify the economic impact of the Paris Agreement on the American economy. In our research published in 2016, we found that the economic impacts would be quite devastating—in particular by 2035, the country would see an average employment shortfall of nearly 400,000 lost jobs, a loss of income of more than $20,000 for a family of four, an up to 20 percent increase in household electricity expenditures, and an aggregate $2.5 trillion loss in GDP.
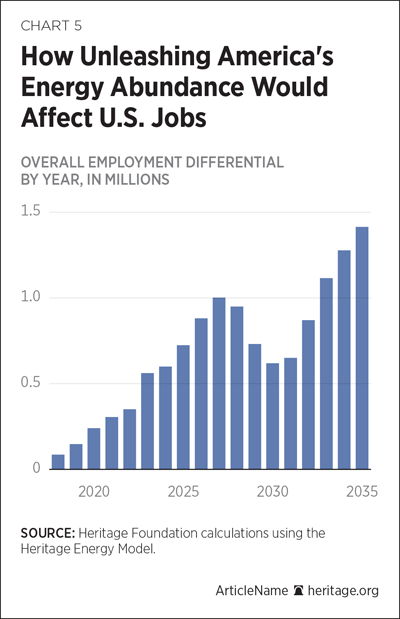
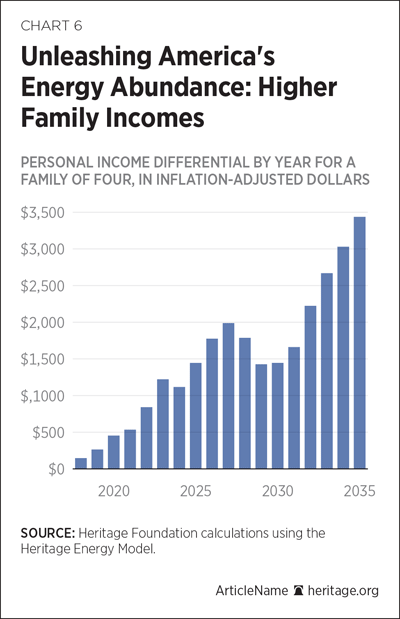
In other research at The Heritage Foundation, we considered the impact of taking advantage of the significant shale oil and gas supply available here in the U.S. The Institute for Energy Research has noted that North America alone has over 1.4 trillion barrels of oil and 2.2 quadrillion cubic feet of natural gas. My colleagues and I have used the Heritage Energy Model to look into the impact of actually taking advantage of these resources. Our research found that if this vast supply were actually utilized that by 2035, the country would see an average employment gain of nearly 700,000 jobs, an increase in over $27,000 for a family of four, a marked reduction in household electricity expenditures, and an aggregate $2.4 trillion increase in GDP.REF
Negligible Environmental Benefits
In our research at The Heritage Foundation, we have also estimated the environmental impact of a number of pertinent policies using the Model for the Assessment of Greenhouse Gas Induced Climate Change. In one exercise, we simulated the impact of reducing CO2 emissions in the United States by 80 percent. Assuming a climate sensitivity of 4.5 degrees Celsius, we found that by 2100, the earth would incur a temperature reduction of 0.135 degrees Celsius and 1.35 cm sea level rise reduction. In a second exercise, we simulated the impact of eliminating all CO2 emissions from the United States completely. We found a similarly trifling change of 0.2-degree Celsius temperature reduction and 2 cm of sea level rise reduction. In a third exercise, we modeled the climate impact of taking advantage of the oil/gas resources discussed in Dayaratna et al. (2017). We again found a negligible impact of less than 0.003-degree Celsius change in temperature and 0.02 cm of sea level rise increase.REF
Conclusions
Policies aimed at “decarbonizing” the American economy are predicated on faulty models that are prone to user-selected manipulation. These policies will raise the cost of energy, thus resulting in devastating economic impacts. On the other hand, policies that are aimed at taking advantage of fossil-based fuels have tremendous potential to grow the economy. And moreover, either policy—regulatory or de-regulatory—will have negligible impact on the climate.
*******************
The Heritage Foundation is a public policy, research, and educational organization recognized as exempt under section 501(c)(3) of the Internal Revenue Code. It is privately supported and receives no funds from any government at any level, nor does it perform any government or other contract work.
The Heritage Foundation is the most broadly supported think tank in the United States. During 2017, it had hundreds of thousands of individual, foundation, and corporate supporters representing every state in the U.S. Its 2017 income came from the following sources:
Individuals 71%
Foundations 9%
Corporations 4%
Program revenue and other income 16%
The top five corporate givers provided The Heritage Foundation with 3.0% of its 2017 income. The Heritage Foundation’s books are audited annually by the national accounting firm of RSM US, LLP.
Members of The Heritage Foundation staff testify as individuals discussing their own independent research. The views expressed are their own and do not reflect an institutional position for The Heritage Foundation or its board of trustees.