
Key job metrics over the past decade paint a mixed national jobs picture. On one hand, the number of job openings over that time shows a positive path and indicates relative optimism in the economy. On the other hand, the actual hiring rate fell, which suggests that not all is well in the labor market. Taken together, this shows the need to continue improving the environment for economic opportunities that can help all Americans.
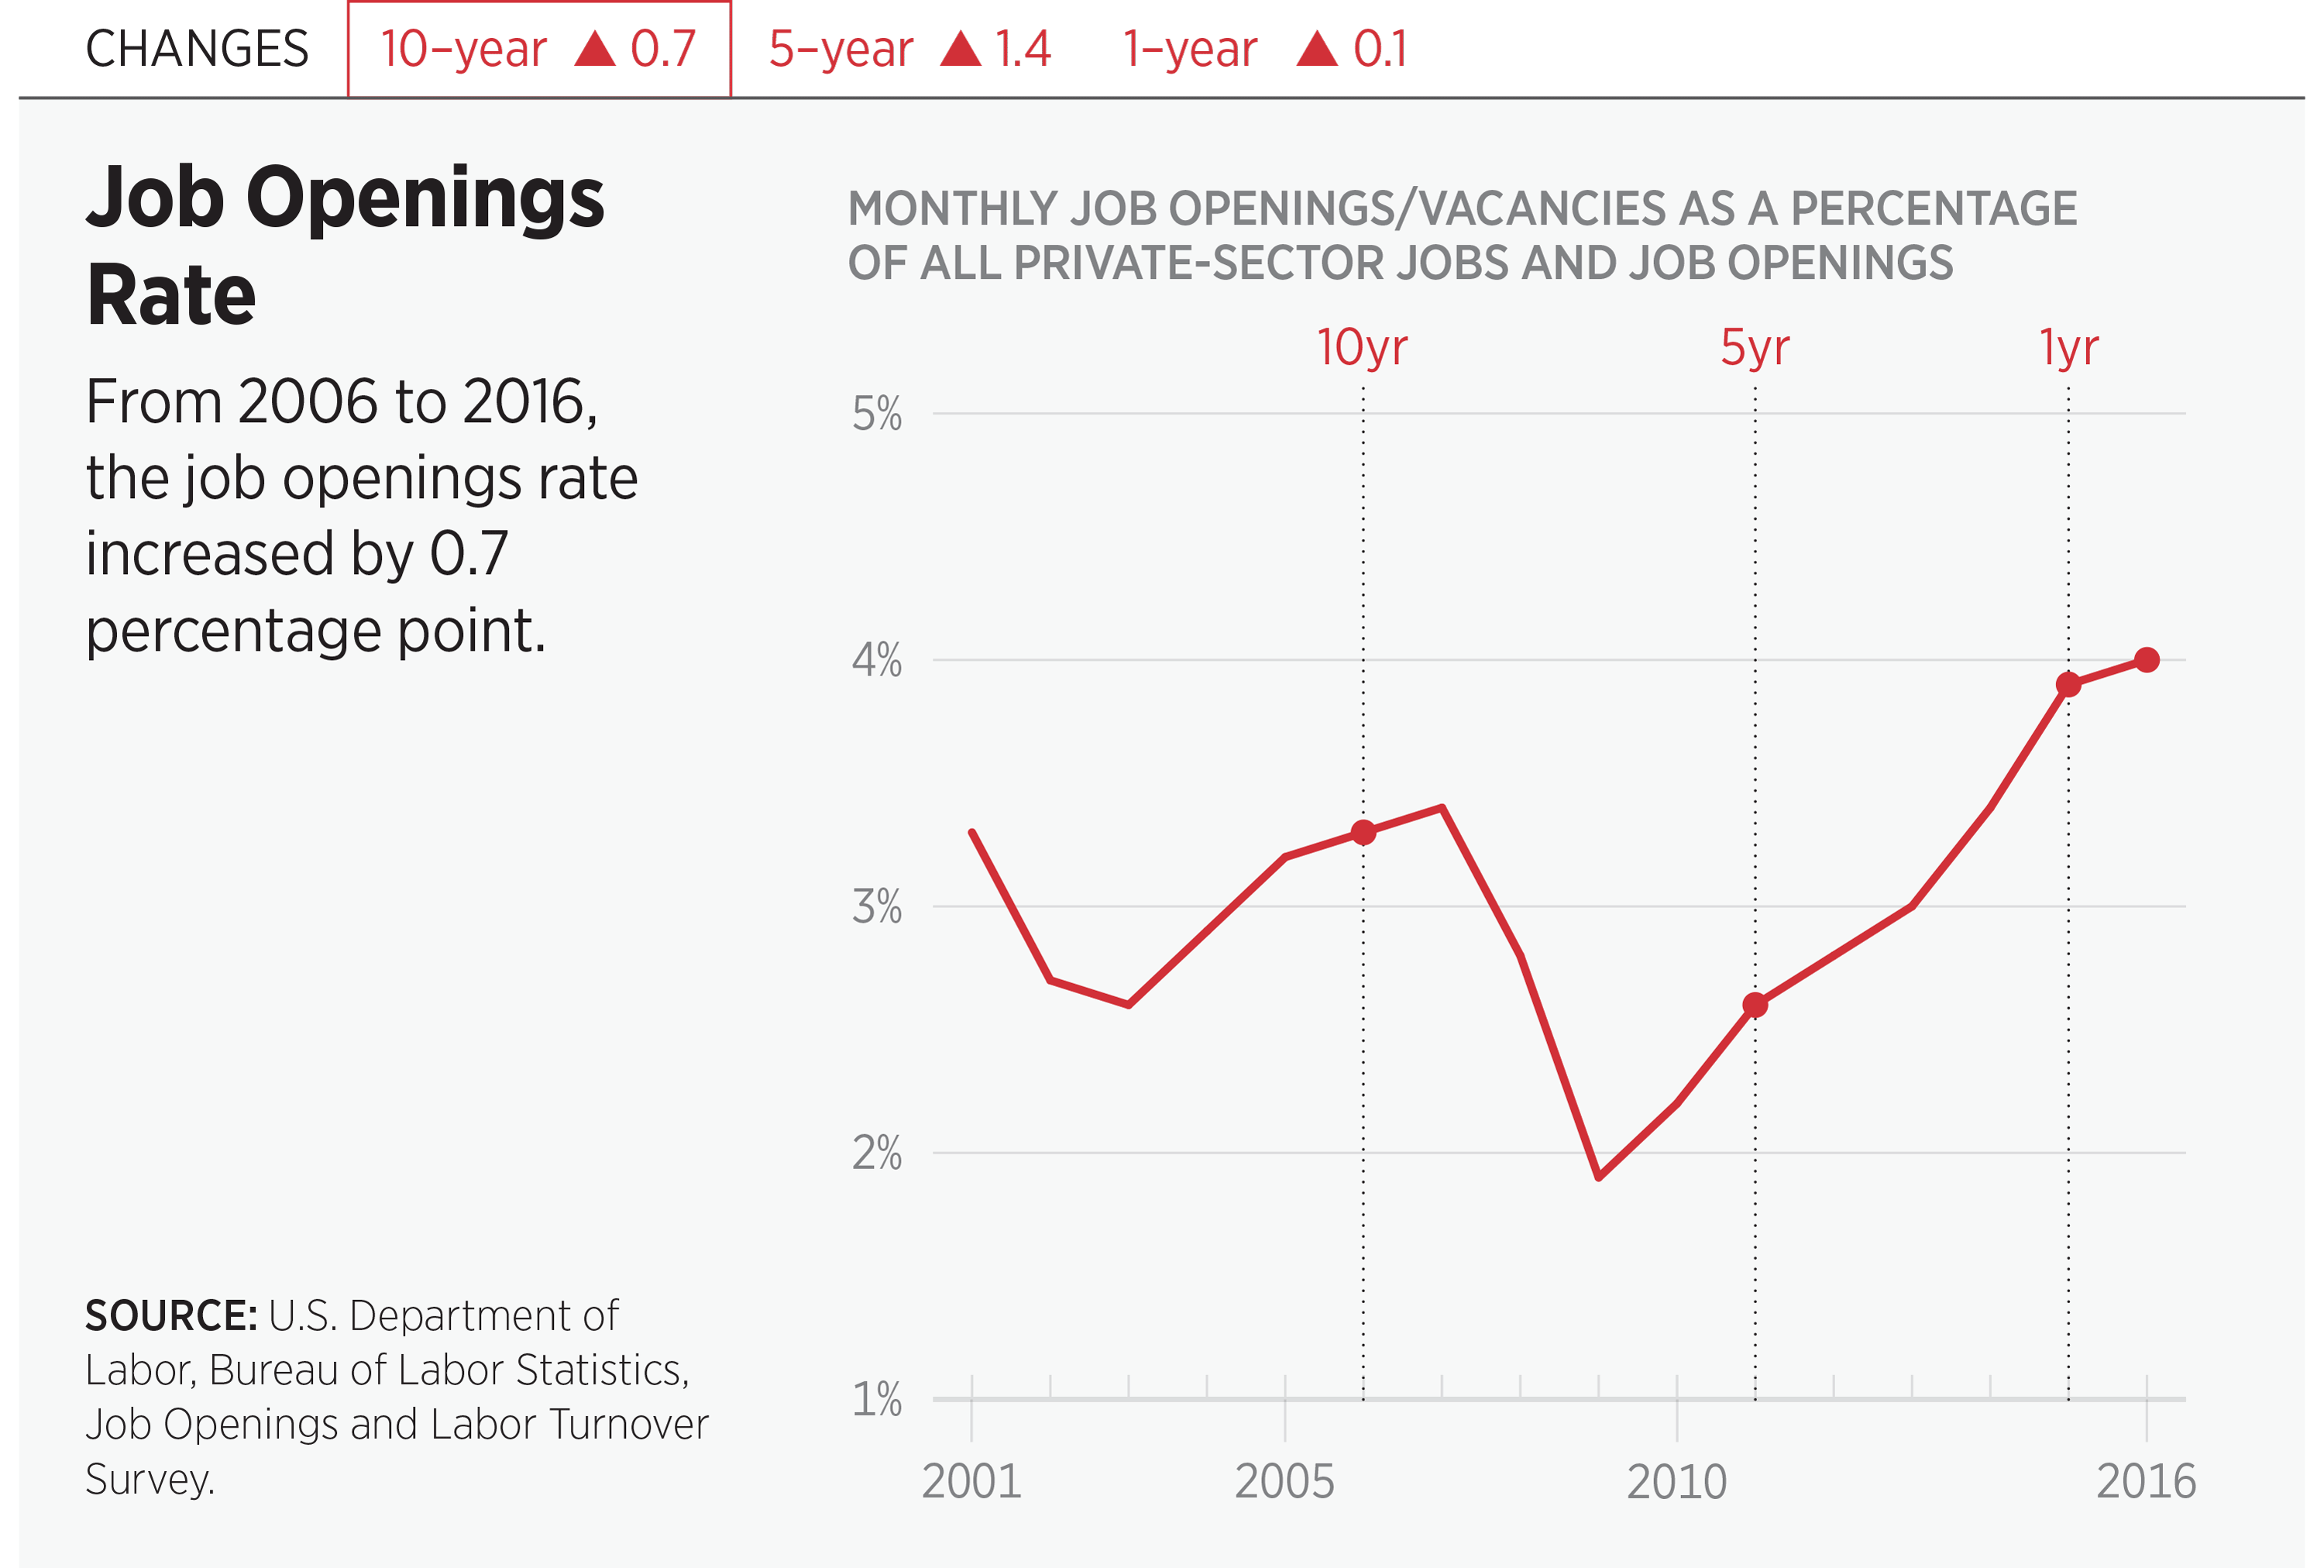
Given the “Great Recession” of 2007–2009, it is heartening to see that the overall job-opening rate has managed to achieve a positive direction. According to the U.S. Department of Labor Jobs Openings and Labor Turnover Survey (JOLTS), the number of job openings grew by 0.7 percentage point between 2006 and 2016.1 This set of data is critical to understanding how many job opportunities exist in the economy. The higher this number and growth rate, the greater the chances an individual looking for work will be able to find it.
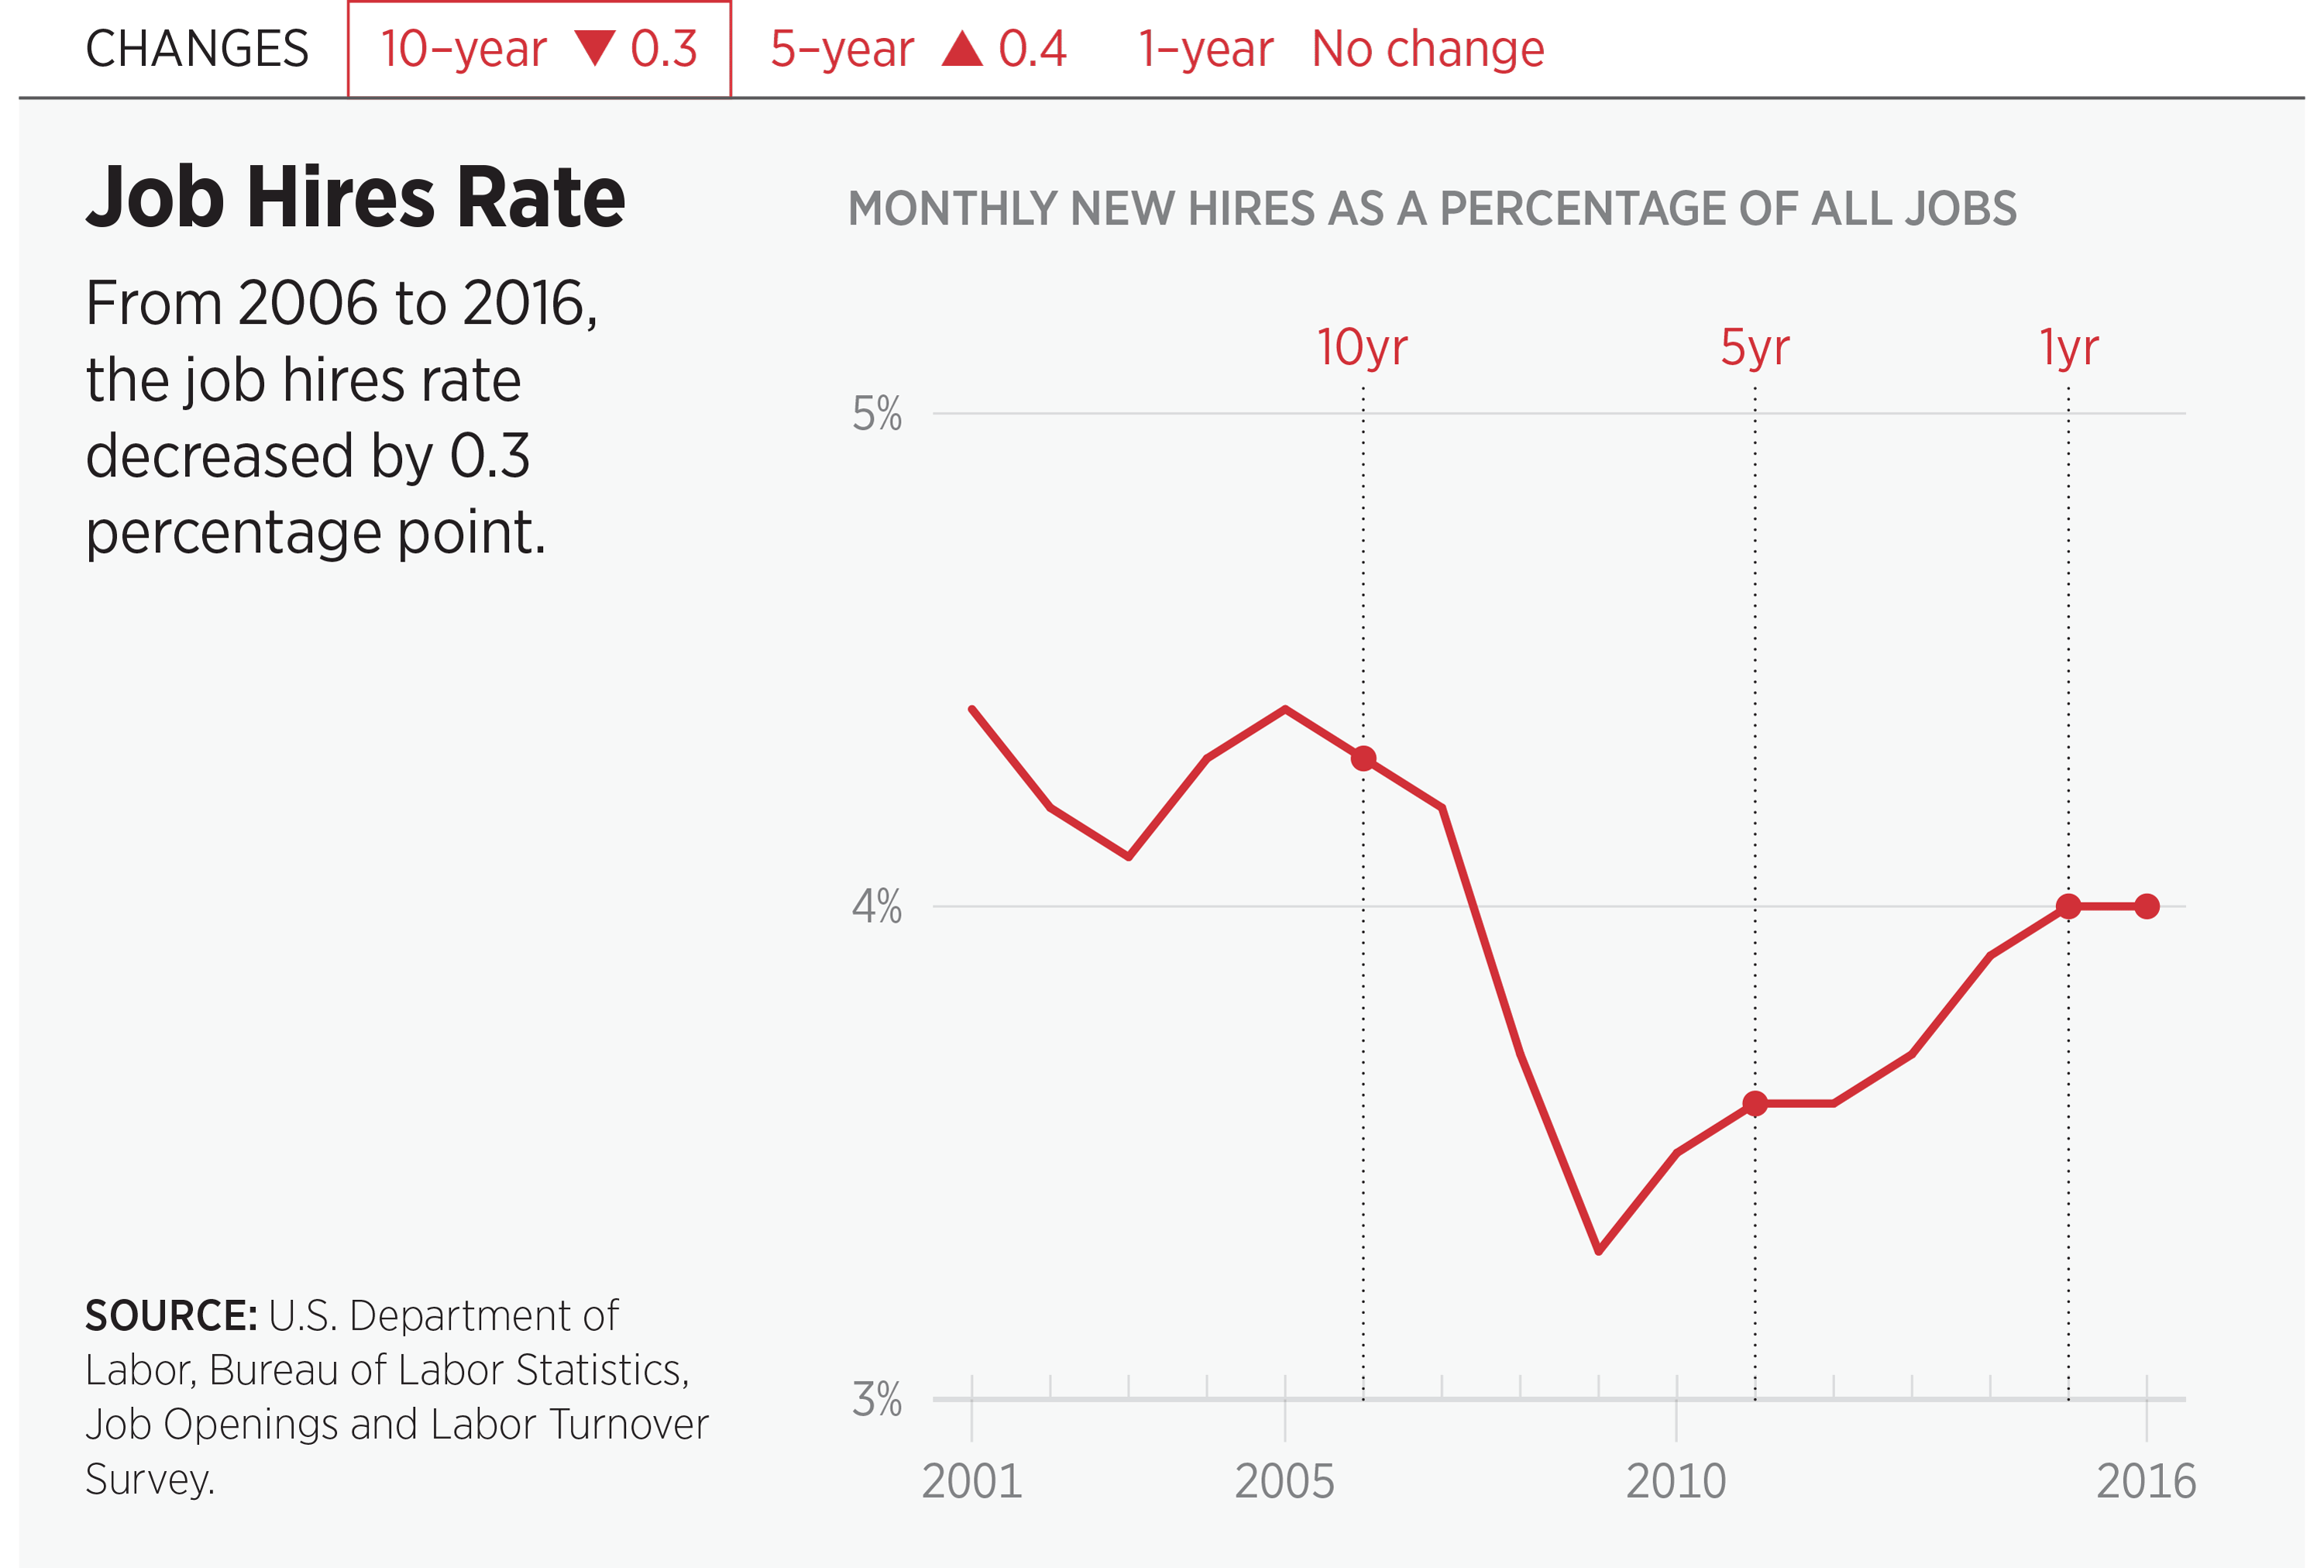
Yet the JOLTS data also show that actual hiring rates declined over the same 10 years by 0.3 percent.2 One clear implication of this divergence is that there remains a significant challenge within the overall labor force. According to the Bureau of Labor Statistics (BLS), in January 2006, the labor force participation rate (LFPR) in the United States was a reasonably healthy 82.6 percent for the cohort aged 25–54 (the prime-working age population).3 Yet by December 2016, it was only 81.4 percent and had remained mired at or below 81 percent since the end of 2011.4 This echoes the disturbing findings in the work of Nicholas Eberstadt and Charles Murray, which detail a long-term trend of lower work rates for middle-age men over the past half-century.5
This means that there are fewer prospective workers seeking work. While demographic trends in the U.S. can explain a portion of this decline, this is unlikely to be a fully sufficient explanation. For example, the growth of government-funded health care through Medicaid expansion in many states has been shown to reduce the incentives of low-income Americans to seek work.6
Another factor is the large number of Americans receiving payments from Social Security’s Disability Insurance Fund. In 2016, there were nearly 2 million more Americans than there were in 2006.7 Once individuals are on disability, it is often difficult to encourage them to seek gainful employment again or keep them attached to the labor force.8
Additionally, drug use and addiction issues make it difficult for many employers to find workers that can pass screenings.9 This is echoed in findings from some diagnostic information services companies.10 This is an especially tragic problem in Ohio, which led the nation in opiate overdose fatalities in 2014 with over 2,100.11
Finally, the “skills gap” theory assumes that employers are dissatisfied with the skill level of prospective employees and cannot find adequate talent to fill their openings. However, there is a lot of pushback on this theory given that the obvious consequence of such a gap should be rapidly growing wages as employers seek to procure the best talent. Despite a recent upward trend, the fact that a dramatic increase in wages has largely not happened since the end of the Great Recession raises questions about the applicability of this theory.12
Years after the Great Recession, significant problems remain when it comes to connecting a broad swath of prospective workers to open jobs. Tackling the hard tasks of reforming Medicaid, better monitoring Social Security Disability payments, and getting treatment for those suffering the scourge of addiction will prove to be indispensable in fixing this state of affairs.
Greg R. Lawson is a Research Fellow at the Buckeye Institute in Columbus, Ohio.
ENDNOTES:
1. U.S. Department of Labor, Bureau of Labor Statistics, “Job Openings and Labor Turnover Survey (JOLTS),” http://www.bls.gov/data, multi-screen data search p. Xy 31, 2017, Statistics, “numbers. I’rks. (accessed April 28, 2017).
2. Ibid.
3. U.S. Department of Labor, Bureau of Labor Statistics, “Labor Force Statistics from the Current Population Survey,” https://data.bls.gov/timeseries/LNS11300000 (accessed April 28, 2017).
4. Ibid.
5. Nicholas Eberstadt, Men Without Work (West Conshohocken, PA: Templeton Press, 2016). See also Charles Murray, Coming Apart: The State of White America: 1960–2010, (New York, NY: Crown Forum, 2013).
6. Craig Garthwaite, Tal Gross, and Matthew J. Notowidigo, “Public Health Insurance, Labor Supply, and Employment Lock,” National Bureau of Economic Research Working Paper No. 19220, July 2013, http://www.nber.org/papers/w19220 (accessed April 28, 2017).
7. Social Security Administration, Office of the Chief Actuary, “Selected Data from Social Security’s Disability Program,” https://www.ssa.gov/oact/STATS/dibStat.html (accessed April 6, 2017).
8. News release, “Persons with a Disability: Labor Force Characteristics—2015,” U.S. Department of Labor, Bureau of Labor Statistics, June 21, 2016, https://www.bls.gov/news.release/pdf/disabl.pdf (accessed April 28, 2017).
9. Pennsylvania Manufacturers’ Association, “New-Hires Refuse or Fail Drug Tests,” June 10, 2014, http://www.pamanufacturers.org/blog/new-hires-refuse-or-fail-drug-tests (accessed April 21, 2017).
10. News release, “Illicit Drug Positivity Rate Increases Sharply in Workplace Testing, Finds Quest Diagnostics Drug Testing IndexTM Analysis,” Quest Diagnostics, June 9, 2015, http://newsroom.questdiagnostics.com/2015-06-09-Illicit-Drug-Positivity-Rate-Increases-Sharply-in-Workplace-Testing-Finds-Quest-Diagnostics-Drug-Testing-Index-Analysis (accessed April 28, 2017).
11. Henry J. Kaiser Family Foundation, State Health Facts, “Opioid Overdose Deaths by Type of Opioid,” 2014, http://kff.org/other/state-indicator/opioid-overdose-deaths-by-type-of-opioid/?currentTimeframe=0&sortModel=%7B%22colId%22:%22Location%22,%22sort%22:%22asc%22%7D (accessed April 6, 2017).
12. News release, “Employment Cost Index—March 2017,” U.S. Department of Labor, Bureau of Labor Statistics, April 28, 2017, https://www.bls.gov/news.release/archives/eci_04282017.pdf (accessed May 9, 2017).