The Great Recession did long-term damage to the U.S. economy. Since 2007, wages and incomes have grown only slowly. Some analysts, however, argue that incomes have stagnated for much longer.[REF] They contend that wages and incomes have barely increased since the 1970s.
Wage and income figures adjusted for inflation with the Consumer Price Index (CPI) do appear relatively stagnant for over three decades. The CPI, not the wage growth, is the problem. The CPI and similar inflation measures have engrained biases that lead them to understate wage growth. Other data on living standards and bias-adjusted wage growth show that incomes grew at a healthy pace in the decades leading up to 2007.
Living Standards Rising
Consumption data show that Americans today enjoy higher material living standards than a generation ago. For example, Bruce Meyer, an economist at the University of Chicago, and James Sullivan, an economist at Notre Dame, examined how housing has changed between the 1980s and 2009.[REF] They analyzed the bottom and middle quintiles (that is, the bottom and middle 20 percent of families by income). They found that Americans live much better now than in the 1980s. Tables 1 and 2 show some of their findings.
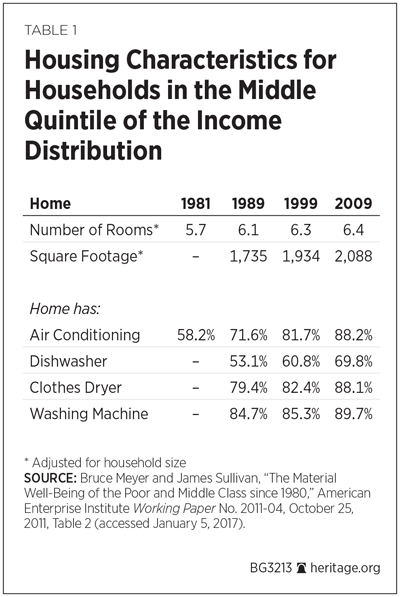
Between 1981 and 2009 middle-income homes increased from an average of 5.7 rooms to 6.4 rooms. The proportion of middle-income homes with air conditioning rose from 58 percent to 88 percent. Their square footage increased by a fifth between 1989 (the earliest data available) and 2009. Use of what are now considered basic appliances increased substantially, too. In 1989, just over half of middle-income homes had a dishwasher. As of 2009, over two-thirds do. Seven-eighths of middle-income homes now have a clothes dryer; almost nine in 10 have a washing machine.
Low-income families experienced similar gains. The average family in the bottom quintile now lives in a home almost as large (1,695 square feet) as a middle-quintile family enjoyed in 1989 (1,735 square feet). Since the 1980s, the proportion of low-income homes with air conditioning or dishwashers has doubled. The proportion with a clothes dryer grew from less than half to over two-thirds.
Unfortunately, Meyer and Sullivan’s data stops in 2009, so their study says little about how housing conditions changed following the recession. Nonetheless, American housing conditions clearly improved over the generation preceding the downturn.
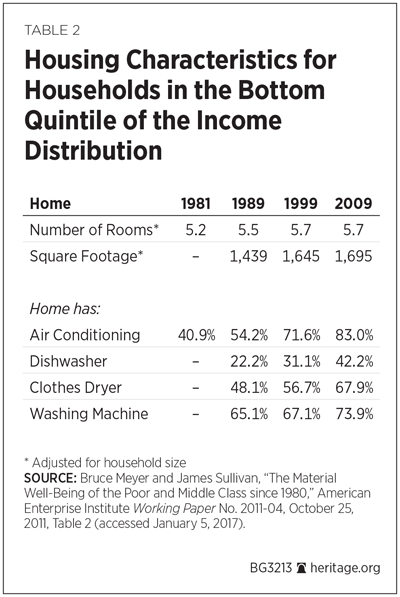
These improved material living standards are hard to reconcile with claims that incomes stagnated for more than 30 years. One possible explanation is that the housing bubble during the first decade of the new millennium encouraged Americans to buy more home than they could afford. However, much of these improvements occurred in the 1980s and 1990s. Moreover, material living standards have improved in many areas beyond housing.
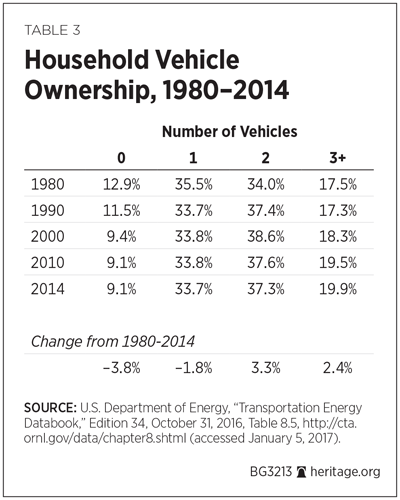
The Census Bureau regularly asks Americans how many cars they own. The proportion of households without a car fell by over one-fourth between 1980 and 2014 (although it did not improve between 2010 and 2014). Fewer households have only one vehicle. Over the same period, the proportion of households with two or more vehicles rose by 5.7 percentage points.[REF] At the same time, average household size has fallen. If incomes have been stagnant for over three decades, why do so many more Americans own cars?
An even more basic consumption measure points to rising living standards before the Great Recession: food spending. Economists have long observed that people spend a smaller proportion of their budgets on food as they become wealthier, especially food consumed at home (a fact known as Engel’s Law).[REF] This has become one of the most conclusively demonstrated empirical facts in economics.[REF] Economists have used this insight to compare living standards across countries and over time.
Engel’s Law implies that Americans became considerably wealthier during the generation before the Great Recession. Department of Agriculture data show that between 1979 and 2007, food spending as a share of disposable income dropped by more than a quarter.[REF] Over that period, Americans also shifted their food budgets toward restaurants, reflecting their growing affluence. In 1979, 32 percent of household food spending went to eating out; by 2007 that proportion had risen to 43 percent.
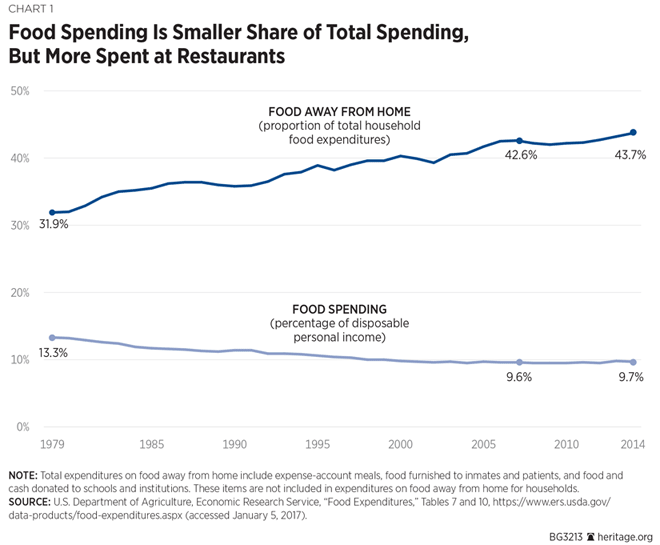
These facts are inconsistent with generational wage stagnation. Individuals and societies with stagnant incomes do not increase the proportion of their non-grocery budgets, nor do they spend more eating out.[REF] Consumption data show that Americans consumed considerably more in the mid-2000s than in the late 1970s.
That progress may have halted during and after the Great Recession. The proportion of disposable incomes going to groceries increased slightly between 2007 and 2014. The shift towards eating out also slowed.[REF] Consumption data show that Americans live much better than a generation ago. However, many Americans do not live better than they did nine years ago.
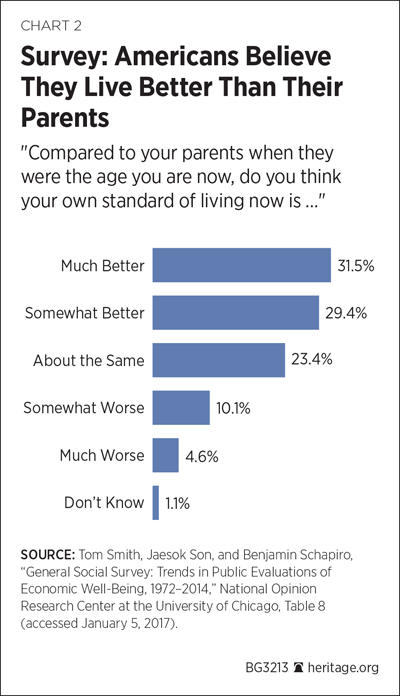
Public opinion surveys also indicate that living standards increased over the past generation. Social scientists track changes in public perceptions over time with the General Social Survey (GSS).[REF] Among other questions, the GSS asks Americans how they believe their living standard compares to that of their parents. The GSS consistently finds a large majority of Americans believe they live better than their parents did. In 2014, the GSS found that 61 percent of Americans believe they live either much better or somewhat better than their parents did at their age. Just 15 percent believe they are worse off than their parents.
Similarly, almost no news reports discussed income stagnation until the Great Recession. While some ideological advocacy groups claimed that incomes had stagnated, their arguments attracted little public attention. A Google News search for “wage stagnation” returns just 10 hits between 2000 and 2007. The term “income stagnation” returns only three Google News hits during that time—two of them discussing other countries.[REF] In the mid-2000s, few media outlets reported arguments that incomes had stagnated.
That changed during and after the recession. Searches for “wage stagnation” and “income stagnation” return over 400 hits and 130 hits, respectively, for 2015.[REF] Worries about income stagnation are a recent phenomenon. Some of the new worries reflect the real deterioration in U.S. economic growth and vitality during the recession. Some, however, are a product of inaccuracies in the way the government measures and reports wage growth and inflation.
Inaccurate Inflation Measurement
Consumption data and opinion surveys show that material wellbeing improved considerably between the late 1970s and mid-2000s. At the same time, inflation-adjusted wages and incomes of the same middle-income families appear to have been stagnant over that time.[REF] Both cannot be true.
Inaccuracies in how the government estimates inflation explain this apparent contradiction. The federal government calculates two principle consumer inflation measures: the Personal Consumption Expenditures price index (PCE) and the Consumer Price Index (CPI).[REF] Economists have found that both the CPI and PCE somewhat overestimate inflation; they report prices as rising faster than they actually do.
In the short run, these inaccuracies are small. But the errors add up when compounded over decades. Between 1979 and 2015 the Consumer Price Index rose a third faster than a more accurate inflation estimate would have.[REF] This overestimation distorts living-standard comparisons. The bias leads analysts to write off real income growth as price inflation.
Examining economic changes with biased inflation measures is like looking at the economic past through sunglasses: Everything appears darker.
How the CPI Measures Inflation. Inflation measures like the Consumer Price Index are meant to measure changes in the cost of goods that consumers purchase. As the BLS notes, the CPI is not a “complete cost-of-living measure.”[REF] Correcting the errors discussed below would fit within the BLS’s practice of using cost of living as the unifying “framework in making practical decisions about questions that arise in constructing the CPI.”[REF] Simplifying, the Bureau of Labor Statistics (BLS) calculates the CPI using the following methods.[REF]
The BLS interviews consumers and asks them what types of goods and services they purchase and where they purchase them.[REF] Based on these survey responses, the BLS selects stores to which to send field agents. The BLS selects outlets probabilistically based on the survey responses; outlets with more customers are chosen more frequently. The BLS updates one quarter of its shopping outlet sample each year. Consequently, the entire sample of stores is entirely updated every four years.
The BLS tracks the prices of 211 different types of goods and services (such as breakfast cereal, men’s suits, appliance repairs) across 38 U.S. geographic regions (such as New York City, Minneapolis–St. Paul, Dallas–Fort Worth). This produces a total of 38 x 211 = 8,018 basic item-area indices.[REF] BLS field agents in each geographic region visit the selected outlets to collect prices on these items.[REF]
If a store has just entered the outlet sample, field agents use probabilistic techniques to select specific products within item categories (such as an 18-ounce box of Kellogg’s Corn Flakes from the item category “breakfast cereal”).[REF] If the agents are returning to a store already in the sample, they price the same products that were previously selected. The BLS then uses a two-stage procedure to calculate the CPI from these price quotes.
In the first stage (or “lower level”) the BLS estimates a separate price index for each of the 8,018 item-area combinations. For about two-thirds of these indices, the BLS calculates a weighted geometric average of the change in prices for each product at each store.[REF] For the remaining lower-level indices, the BLS uses an arithmetic average.
In the second stage (or “upper level”), the BLS aggregates the 8,018 specific item-area indices into the national CPI using a Laspeyres index. A Laspeyres index is an arithmetic average of price changes weighted to reflect base-year expenditure on each good. The BLS calculates the weights using data from the Consumer Expenditure (CE) survey.[REF]
Finally, the BLS publishes several versions of the CPI:
- CPI-U-RS: Consumer Price Index Research Series Using Current Methods. Applies modern methodology to CPI data going back to 1978. In this Backgrounder, “CPI” refers to this research series.
- CPI-U: Consumer Price Index for all Urban Consumers. The most common form of the CPI and most likely to appear in an online inflation calculator. The CPI-U should not be used for historical comparisons, especially before its major methodological revision in 1999.
- C-CPI-U: Chained Consumer Price Index for All Urban Consumers. Uses the same raw data as the CPI-U, but employs superlative formulas to correct for small sample bias and consumer substitution bias. As a result, the C-CPI-U usually reports inflation lower than the CPI-U but higher than the PCE deflator.
- CPI-W: Consumer Price Index for Urban Wage Earners and Clerical Workers. Very similar to the CPI-U and used to calculate Social Security cost-of-living adjustments.
- CPI-E: Experimental Consumer Price Index for the Elderly. Similar to the CPI-U, but focuses on expenditures by those ages 62 and older.
Problems Specific to the CPI. Unfortunately, these methods have several widely recognized flaws. Three of these flaws are specific to the CPI: small-sample bias, consumer substitution bias, and weighting bias. Each of these problems artificially increases the CPI’s inflation estimates:
- Small-sample bias. Each month, BLS field agents collect tens of thousands of price quotes. However this amounts to an average of only 10 to 12 individual items in each of the CPI’s 8,018 item-area indices. These small sizes introduce sampling error. BLS staff economists have shown that this sampling error systematically biases the CPI upward.[REF] Between 2000 and 2016, small-sample bias artificially inflated the CPI by approximately 0.15 percentage points a year.[REF]
- Consumer substitution bias. Consumers shift spending toward items whose prices drop. If the price of Red Delicious apples fell in Los Angeles, Angelenos would buy more of them, and fewer of other apple varieties. Geometric averages mathematically account for this change in spending patterns.[REF] That is why the BLS uses geometric averages to calculate most of its individual item-area indices, accounting for product substitution within an item-area like “apples in Los Angeles.”[REF] However, the BLS uses a Laspeyres index, not a geometric average, to combine the item-area indices into the national CPI. The Laspeyres formula assumes that no such product substitution occurs.[REF] This is a highly unrealistic assumption. If the price of “apples in Los Angeles” fell, consumers there would buy more apples, and fewer bananas and oranges. The CPI ignores this consumer choice.[REF] It only accounts for substitution within item categories, not between them. This also biases the CPI upward, by an average of 0.1 percentage points a year.[REF]
- Weighting bias. The BLS calculates the weights for aggregating individual item indices up to the national CPI using CE survey data. For example, if CE data showed that Americans spend twice as much on eating out as on gas, changes in restaurant prices would contribute twice as much to the national index as changes in gasoline prices. Unfortunately, the CE survey is quite inaccurate. Survey respondents recall large and repeated purchases quite well. So the CE measures spending on things like housing and utilities rather accurately. But people often forget smaller or irregular purchases during their interviews. This underreporting makes it appear that Americans spend far more of their income on housing and utilities than they actually do.[REF] The prices of housing and utilities increased faster than average over the past generation. These inaccurate weights cause the CPI to overstate inflation by 0.07 percentage points to 0.1 percentage points a year.[REF]
Economists agree that these problems make the CPI less accurate. The BLS is redesigning the CE precisely because it recognizes the survey’s flaws. Index-number theoreticians almost unanimously agree that price indices should use formulas that account for consumer substitution between item categories, not just within them.[REF] The major international statistical organizations concur.[REF] Such formulas have the additional benefit of greatly reducing small-sample bias.[REF] But the BLS persists in using a Laspeyres formula with inaccurate weights. These choices cause the BLS to systematically over-estimate inflation.
The PCE: Better But Not Perfect
The Bureau of Economic Analysis (BEA) makes its estimates based on a consumer price index that mitigates some of the CPI’s problems. The Personal Consumption Expenditures (PCE) price index uses much of the same data and methodology as the CPI. But the BEA calculates it with a “Fisher ideal” formula that largely (but not entirely) accounts for substitution between item categories.[REF] This formula also effectively eliminates small-sample bias. The BEA further calculates PCE expenditure weights using highly reliable business sales data.
As a result, the PCE does not suffer from small-sample, substitution, or weighting biases. Consequently, economists widely consider it more accurate than the CPI. The Federal Reserve Board and Congressional Budget Office (CBO) primarily measure inflation with the PCE for this reason.[REF]
Between 1979 and 2015, the CPI grew 0.3 percentage points a year faster than the PCE.[REF] Small-sample, substitution, and weighting biases caused this divergence. These small annual differences add up. Over the entire period, the CPI grew 10 percent more than the PCE.[REF]
This difference matters a lot when measuring inflation-adjusted income. Real income growth estimated with the CPI appears a tenth smaller than when estimated with the PCE. This difference solely reflects the CPI’s small lower-level samples, partially ignoring consumer substitution, and relying on inaccurate weights. In reality, inflation grew less—and inflation-adjusted incomes grew more—than the CPI reports. Journalists and researchers who measure historical incomes with the CPI end up painting an inaccurate picture of the past.
However, while the PCE measures inflation more reliably than the CPI, both it and the CPI suffer from additional biases. The three most significant of these are outlet-substitution bias, new-product bias, and quality-adjustment bias.
Outlet Substitution Bias. The PCE and CPI both ignore the fact that consumers save money by shopping around. Both indices track price changes of individual items at particular stores; they do not compare prices between stores. The BLS and BEA formulas implicitly assume that price differences between stores only represent service-quality differences.[REF] This causes them to overstate prices.
Walmart provides an example. Walmart sells groceries for about 20 percent less than traditional grocery stores.[REF] Consumers have strongly responded to these “everyday low prices.” Walmart is now the largest grocery store in the United States, selling almost twice as many groceries as its next-largest competitor.[REF] Its lower food prices save the average Walmart shopper about $800 a year.[REF]
These savings disappear in the CPI or PCE. The PCE and CPI only measure the extent to which traditional grocery stores respond to Walmart by lowering their own prices. Unlike shoppers, these indices do not account for Walmart having lower prices to begin with. This “outlet substitution bias” has a noticeable impact on the overall inflation rate.
One study by MIT economist Jerry Hausman and U.S. Department of Agriculture economist Ephraim Leibtag concluded that ignoring outlet substitution increases grocery price inflation by 0.3 to 0.4 percentage points a year.[REF] Internal research by the BLS showed the same result.[REF] Across the entire economy, outlet substitution appears to bias the CPI upward by 0.1 percentage points a year.[REF]
Unfortunately, the research informing that estimate comes entirely from studies of traditional retail and grocery stores. Technological changes (like online shopping) make it easier for Americans to shop around. This has probably increased outlet-substitution bias, although by how much remains unclear. To the extent that online shopping allows Americans to buy goods at lower prices than at traditional brick-and-mortar stores, the CPI and PCE ignore it.
Similarly, the CPI and PCE ignore the way the “gig economy” has lowered prices for everyday services. Instead of having to rely on certified taxicab companies, people who need a ride can now order rides from their smartphone through Lyft and Uber; such ridesharing is often substantially cheaper than a taxi.[REF] But the CPI and PCE do not directly compare ridesharing prices to taxi prices. As a result, they ignore the savings from ordering an Uber instead of hailing a cab.
Likewise, Airbnb allows homeowners to temporarily rent out rooms (or their entire homes). Airbnb rentals typically cost 20 percent to 50 percent less than hotels.[REF] Nonetheless, the CPI and PCE do not compare Airbnb rentals to hotel rates, so these savings disappear entirely from the national price indices.
The government’s inflation measures assume that no meaningful price differences between stores exist. Ignoring the differences biases the CPI and PCE upwards.
New-Product Bias. Not accounting for how innovations affect living standards further biases these price indices. Many inventions have materially improved Americans’ day-to-day lives:
- Air conditioning makes living in warm climates much more comfortable. Its invention and widespread use partly explains why the South’s population has grown so rapidly.[REF]
- Cell phones allow mobile communication.
- Lasik surgery restores bad vision.
- Video games provide alternate forms of entertainment.
- Videocassettes, followed by DVDs and then streaming video, allow Americans to watch programs of their choice at the times they choose.
- Antibiotics and new medications save lives and reduce suffering from chronic diseases.
- GPS navigation systems provide a hands-free, real-time alternative to maps.
- E-mail and text messaging communicate text, documents, images, and videos at much lower cost.
- Dry-erase boards save cleaning time and reduce pollution in the classroom air relative to chalk boards.
- Personal computers and tablets provide so many benefits they have become a staple in most homes.
- Microwave ovens allow families to quickly cook or re-heat their food without drying it out.
A large share of current expenditure goes to purchase items (or features on improved items) that were not available in 1980. The CPI and PCE effectively ignore how such innovations expand consumers’ buying power. The BLS begins to track price changes of new products (such as air conditioners, GPS systems, or cell phones) some time after they enter the market.[REF] But it does not account for how their invention itself expands purchasing power.[REF] This methodology implicitly assumes that Americans would be no poorer if these new products became unavailable. However, a change in air conditioner prices affects Americans far less than the fact that they can buy an air conditioner at all. The fact that most Americans would feel drastically poorer if they could not use anything invented in the past generation does not enter into BLS calculations.
Economists find that this “new product bias” causes price indices to understate improvements in living standards. For example, MIT’s Hausman examined how the invention of cell phones benefitted Americans.[REF] Cell phones first arrived in the U.S. in 1983, but they did not enter the CPI until 1998. Hausman found that between 1988 and 1997, the CPI sub-index for telephone services increased by 10.1 percent. That figure entirely ignores cell phones. Hausman then used price and sales data to estimate how much Americans valued the arrival of cell phones.[REF] Had the telephone services sub-index included these gains, it would have fallen 7 percent during that time.[REF] Ignoring the benefits of the cell phone inflated telephone services costs by approximately 17 percent. This bias, cumulated across many new goods and services, considerably distorts federal price indices.
Quality Bias. The official price indices suffer from another closely related problem: “quality bias.” The CPI and PCE do not just ignore the benefits of new products—they only partly account for quality improvements in existing products.
The quality of many—if not most—goods and services has substantially improved over time. Cars have become safer and more comfortable; televisions have sharper images and clearer sound, while the effectiveness of many medical treatments has improved. Today’s smartphones are almost unrecognizably better than the cell phones of the 1990s. Even basics like clothing have become more convenient, with wrinkle-resistant treatments reducing trips to the ironing board. Price indices need to distinguish between such quality and convenience improvements, and true price inflation. BLS procedures do so only partially.
Most higher-quality products enter the CPI (and PCE) when the BLS rotates its outlet sample.[REF] As described previously, the BLS annually updates 25 percent of the stores from which it collects price quotes. BLS field agents then use probabilistic techniques to select products to price at the outlets newly rotated into the sample. Through this process they often select more advanced products than before (such as pricing wrinkle-free khakis and iPhone 7s, when at the prior store they priced regular khakis and iPhone 5s).
When this happens, the BLS ignores price and quality differences between the new and old goods. Instead, BLS methods implicitly assume that the price differences between the new and old products entirely reflect the differences in quality. The BLS simply tracks the new products’ prices, with no effort to measure quality differences with the old products.[REF] Price index economists call this “passive” or “implicit” quality adjustment.
Dealing with Product Replacements. The BLS only adjusts for quality when an outlet stops selling a product in the middle of the sample. This happens fairly often. Each month about 4 percent of products priced in the CPI are discontinued at their outlet.[REF] In these cases, BLS field agents must price new items. The BLS uses three primary methods to distinguish price and quality differences between these replacements and the original items. These methods include both passive and direct quality adjustments:
- Direct comparison. Many product replacements do not involve quality changes at all. Rather, the new and replacement products differ only in minor details, such as a red and otherwise identical yellow raincoat. If the field agents determine that no meaningful quality differences exist, the BLS directly compares the two products’ prices. All differences in prices are recorded as inflation (or deflation). Such direct comparisons account for about 65 percent of all product replacements in the CPI.[REF]
- Linking. In many cases, the replacement and original products are not directly comparable. For example, field agents may replace the iPhone 3 with the more advanced iPhone 7. Or, they may substitute piano lessons for drum lessons. In these cases, the BLS usually “links” the prices of the two products. Essentially, the BLS assumes that the discontinued product would have grown in price at the same rate as the other products in its category.[REF] The BLS imputes that price change to the new product in the period it is substituted into the sample. Going forward the BLS tracks price changes for the new item. The linking method is another form of passive quality adjustment. It implicitly assumes that the price difference, net of the imputed price growth, reflects the full quality difference. The BLS estimates about a quarter of product replacements using linking methods.[REF]
- Direct quality adjustment. The BLS accounts for most of the remaining replacements with direct, instead of implicit, quality adjustments. The BLS uses data on how much consumers value various product features to directly calculate the difference in quality between the replacement and original products. The rest of the price difference is treated as inflation (or deflation). The vast majority of these direct quality adjustments occur in rental housing and clothing. The remaining items undergoing direct quality adjustment constitute less than 1 percent of the CPI; direct quality adjustments on these goods have essentially no effect on the overall CPI.[REF]
These quality adjustments reduce the growth of the CPI by between 0.3 and 0.4 percentage points a year, with the linking method accounting for the vast majority of that change.[REF] Since the PCE uses CPI pricing data and quality adjustments, these reductions reduce PCE growth by essentially the same amount.[REF] Unfortunately, these adjustments appear to understate quality improvements—in turn causing the inflation indices to overstate inflation.
Inadequate Quality Adjustment. The outlet rotation and linking methods assume that price differences between new and old products fully reflect quality differences.[REF] This assumption makes inflation calculations much simpler. It is also unrealistic. New models often have lower (or higher) quality-adjusted prices than prior models. This seriously biases inflation estimates. For example:
- Smartphones. The vast majority of Americans—including most Americans earning less than $30,000 a year—now own smartphones.[REF] An iPhone 5 cost approximately $250 in 2016. In a single device, a smartphone combines electronic capabilities that cost thousands of dollars to purchase separately in the 1990s.[REF] In addition to being a mobile phone, a smartphone is also a:
- Video recorder;
- Portable music player;
- Miniature computer and Web-browser;
- Handheld video game console;
- GPS mapping and direction system;
- Miniature television and video player;
- High-resolution digital camera;
- Alarm clock;
- Flashlight;
- Kindle or Nook style reader for electronic books; and
- Countless additional capabilities available through app downloads.
The CPI and PCE ignore most of these quality improvements. The BLS does not directly adjust cell phones—including smartphones—for quality. New models simply are included in the sample either when they are selected at a new outlet or through the linking method when earlier models are discontinued. The BLS then tracks these new models’ prices—without otherwise adjusting for quality differences with prior models.[REF] The fact that thousands of dollars of electronics have shrunk to pocket size and cost a fraction of what they did previously disappears from the inflation indices.
- Lighting. Smartphones are an obvious area of quality improvement. But CPI quality-adjustment techniques also understate the quality growth of something as basic as lighting. Lighting costs have fallen sharply in recent decades. Incandescent lightbulbs produce more light and use less energy than they did in the 1960s. Fluorescent and LED bulbs are more efficient still. In the 1990s, Yale economist William Nordhaus examined how much of this quality improvement the CPI incorporates.[REF] He found that the cost of purchasing 1,000 lumens of light dropped from 20.7 cents in 1960 to 12.4 cents in 1992 (in nominal dollars). But the lighting component of the CPI (mainly electricity costs) increased by almost a factor of four over that period.[REF] As a result, the CPI overstated lighting cost changes by more than 550 percent.[REF] The CPI’s passive quality adjustments missed almost the entire reduction in lighting costs. This bias seems likely to grow. MIT scientists have developed prototype incandescent bulbs that are significantly more efficient than existing technology. They believe their new method will allow them to create incandescent bulbs that are twice as efficient as fluorescent lights.[REF] If they do, the CPI will ignore almost all those efficiency gains.
- Medical care. Quality adjustments also understate improvements in medical care. Until the late 1990s, the BLS measured the price of particular inputs, such as a night in a hospital room, instead of the cost of treating a disease. So the inflation indices ignored how better treatments reduced costs. Consequently, the CPI considerably overstated medical price inflation. One study found that CPI methods overstated cost growth of heart-attack treatment by 2 percentage points a year.[REF] Since 1997, the CPI has attempted to price specific treatments instead of simply inputs. However, economists who have evaluated the new methods believe that these changes only partially fix the problem.[REF] They find that the new methods generally miss small but important changes in treatments. For example, new techniques mean that many patients no longer even need sutures after cataract surgery, substantially reducing recovery time.[REF] Similarly, the BLS does not adjust for quality differences between new and existing prescription drugs. It simply tracks the prices of new medicines as they become available. So the PCE and CPI do not account for the benefits of more effective medications as they become available.[REF] Additionally, they only take partial account of the availability of generic drugs.[REF]
- Groceries. Not all quality bias goes upwards. Internal BLS research shows that the linking method biases food inflation downwards. BLS staff economists find that food manufacturers tend to raise prices when they change product lines. The new products may involve no more than adjusting the package size without substantive changes in quality. However, the linking method imputes to these new products the (lower) average rate of price growth in their category. The rest of the price increase is treated as quality improvement and is ignored.[REF] As a result, the food component of the CPI understates inflation by 0.2 to 0.3 percentage points a year.[REF] This downward quality bias mostly (but not entirely) offsets the upward outlet substitution bias in groceries. Passive quality adjustment generally overestimates inflation when new models offer better, quality-adjusted prices. They underestimate inflation if firms raise quality-adjusted prices when they introduce new models or if they heavily discount older models before discontinuing them. Which effect is stronger overall (or if these biases cancel out) is an empirical question. Some studies of particular goods find that, like groceries, BLS quality adjustments artificially lower inflation. For example, one study examined price changes for cameras, televisions, vacuum cleaners, washing machines, and dishwashers in 1998. It concluded that the linking method understated inflation for four of those five goods that year.[REF]
Across the entire economy, however, quality bias appears to artificially increase inflation. David Lebow and Jeremy Rudd, economists with the Federal Reserve Board, examined quality bias and new-product bias across almost all CPI categories.[REF] They found that some categories, like rental housing, have a downward bias (of approximately –0.2 percentage points annually). But they found upward bias in many more categories, such as medical care (+2.3 points); personal financial services (+1.0 points); telephone services (+0.8 points); and recreation equipment (+0.3 points). Overall, these upward biases more than offset the downward bias. Lebow and Rudd concluded that new-product bias and inadequate quality adjustments artificially increase inflation by approximately 0.4 percentage points a year.[REF] Different researchers using this approach have estimated somewhat larger biases.[REF]
Other Approaches Show Quality Bias
Other economists have taken a different approach. Rather than trying to separately estimate bias for each category of goods in the CPI, they look at overall changes in consumer behavior that indicate shifts toward purchasing higher-quality goods. These studies find even greater quality bias.
Mark Bils and Peter Klenow, economists at the University of Rochester and Stanford University, respectively, made an important contribution in this research.[REF] They noted that wealthier families often pay more to purchase higher-quality goods or services. Some goods, such as automobiles, show very strong relationships between prices and family income. Well-off families are more likely to buy high-end (and higher-priced) cars, while lower-income families buy more basic (and less expensive) vehicles. Other goods show almost no relationship between price and income; the rich and poor buy basically the same vacuum cleaners, for instance. Economists can use the relationship between income and prices to estimate quality differences between high-end and low-end product versions.
Bils and Klenow used this insight to estimate the quality growth of 66 durable goods representing one-eighth of all items covered by the CPI. They found that goods with faster quality growth have higher inflation rates. Their analysis showed this happened because BLS methods only capture 40 percent of the value of quality improvements. The BLS systematically misattributes the rest of higher-quality goods’ higher costs to inflation instead of a quality premium. Bils and Klenow concluded that the CPI underestimates durable goods’ quality growth—and overstates their inflation rates—by 2.2 percentage points a year.[REF] Their findings suggest that Lebow and Rudd underestimated quality bias.
David Weinstein and Christian Broda, economists at Columbia University and the University of Chicago, respectively, came to a similar conclusion using a different method.[REF] They explain that passive quality adjustment assumes that new products have the same quality-adjusted price as existing products. Weinstein and Broda point out that this assumption is testable: If new models offer consumers better value, their market share will rapidly expand. The extent to which a product’s market share expands can be used to infer the degree of the quality difference. Weinstein and Broda analyzed Nielsen shopping data covering about 40 percent of the CPI from 1994 to 2003. They found that many new goods rapidly expand their market share, indicating that shoppers believe they offer better value. They estimate that quality grew 0.6 to 0.9 percentage points faster for these products than the CPI estimated.[REF]
Mark Bils used a similar approach to re-analyze quality bias.[REF] He analyzed changes in the prices and model shares of many consumer durable goods. He found that the BLS understates the quality growth of these goods by approximately 2 percentage points a year.[REF] Overall the BLS passive quality adjustments appear to considerably understate quality growth—and overstate inflation.
Food Budgets Reveal CPI Bias
An entirely different method of assessing inflation bias reinforces this finding. As discussed, households spend a smaller proportion of their budgets on food (especially food at home) as they become wealthier. Economists call the relationship between food spending and family income the “Engel Curve.” Researchers can infer real income changes by examining how Engel Curves change over time. For example, CE data show that families in the bottom income quintile spent about the same proportion of their budgets on eating at home in 2007 (9.8 percent) as families in the middle quintile did in 1984 (9.9 percent).[REF] This suggests that before the Great Recession, bottom quintile families had living standards comparable to middle-income families of the mid-1980s.[REF] Between 2007 and 2015, the bottom quintile’s food-at-home spending share slightly increased. This suggests that real living standards fell during the recession and have not fully recovered.
Two major studies have examined this question in the United States. Bruce Hamilton, an economist at Johns Hopkins University, examined the Panel Study of Income Dynamics data from 1974 to 1991.[REF] He found that the relationship between food-at-home spending and incomes has shifted. Over time, lower and lower real incomes (as measured by the CPI) are now associated with the same proportion of spending on eating at home. This implies considerable CPI bias. Hamilton concluded that the CPI overstated inflation by 2.5 to 3 percentage points a year between 1974 and 1981, and by 1 to 1.5 percentage points a year thereafter.[REF]
Dora Costa, an economist at UCLA, applied the same approach to CE survey data from 1972 to 1994.[REF] She also found that food-at-home spending dropped considerably more than the CPI-adjusted income figures would predict. She concluded that the CPI overstated inflation by approximately 1.6 percentage points annually over this period.[REF] About 0.8 percentage point of this bias remains after accounting for corrections to housing pricing already incorporated in the CPI methodology.[REF]
Bias-Corrected PCE. Many developed countries, such as Canada and Australia, estimate inflation using methods similar to those of the BLS. Engel Curve analysis shows that these countries also over-estimate inflation.[REF] Outlet-substitution bias, new-product bias, and quality bias systematically inflate inflation calculations.
This presents a problem for anyone trying to examine whether incomes have grown or stagnated. Inaccurate inflation figures render “inflation-adjusted” comparisons misleading. Some researchers have dealt with this problem by calculating “bias corrected” price indices.[REF] They adjust the official inflation rate annually by a constant factor to correct for bias.
This blunt approach assumes that bias remains constant each year. In reality, inflation biases fluctuate over time.[REF] However, estimating a constant bias is more accurate than assuming a constant bias of zero, as current practice implicitly does.
The PCE is more accurate than the CPI because it largely corrects for small-sample, weighting, and consumer-substitution biases. However, the PCE still suffers from outlet-substitution bias, new-product bias, and quality bias. Some researchers contend that the CPI and PCE also suffer from “consumer valuation bias,” and that the PCE formula does not fully eliminate substitution bias. Appendix A discusses these potential biases in greater detail.
A conservative estimate is that the PCE index overstates inflation by 0.4 percentage points a year: 0.1 points of outlet-substitution bias[REF] and 0.3 points of new-product and quality adjustment bias.[REF] This is a conservative estimate. This figure assumes that online shopping and the gig economy have not increased outlet-substitution bias over the past decade.[REF] It also estimates somewhat smaller new-product and quality biases than existing surveys,[REF] while ignoring the additional biases discussed in Appendix A. Nonetheless, 0.4 points represents a useful lower-bound estimate of PCE bias.[REF] While PCE bias may be (and probably is) higher, it is unlikely to be lower. Analyzing incomes using this “bias-corrected PCE” reflects changes in living standards more accurately than using either the PCE or CPI.[REF]
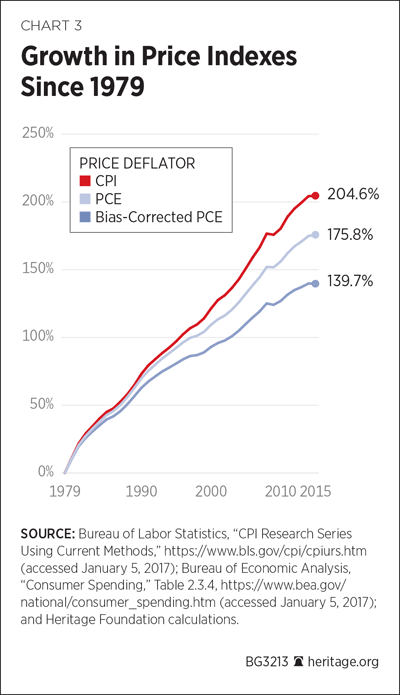
Over short time horizons, correcting bias only slightly affects inflation estimates. Over decades, it makes a big difference. Chart 3 shows this visually, displaying the percentage growth since 1979 in three price indices: the CPI, the PCE, and bias-corrected PCE. Over this period, the CPI more than doubled, increasing almost 205 percent. The more accurate PCE grew approximately 30 percentage points slower—up 176 percent. More accurate still, the bias-corrected PCE grew even more slowly, increasing just 140 percent. The type of measure that researchers use will heavily influence their conclusions about income growth or stagnation.
Wages Grew Considerably Until the Recession
Commentators often state that U.S. living standards have stagnated for the past generation. If they used more accurate figures, they would find U.S. incomes and wages grew steadily until the Great Recession.
For example, the Economic Policy Institute (EPI) argues that U.S. wages have barely grown since the 1970s.[REF] EPI reports wage stagnation because it adjusts wages for inflation with the CPI. If EPI used better inflation measures, its reports would show wages growing substantially.
Table 4 demonstrates this by replicating EPI’s estimates of average hourly earnings since 1979.[REF] The table shows hourly wages at each decile of the wage distribution, as well as average wages across the whole economy. The top panel shows wages adjusted for inflation using the CPI; the bottom panel uses the bias-corrected PCE.
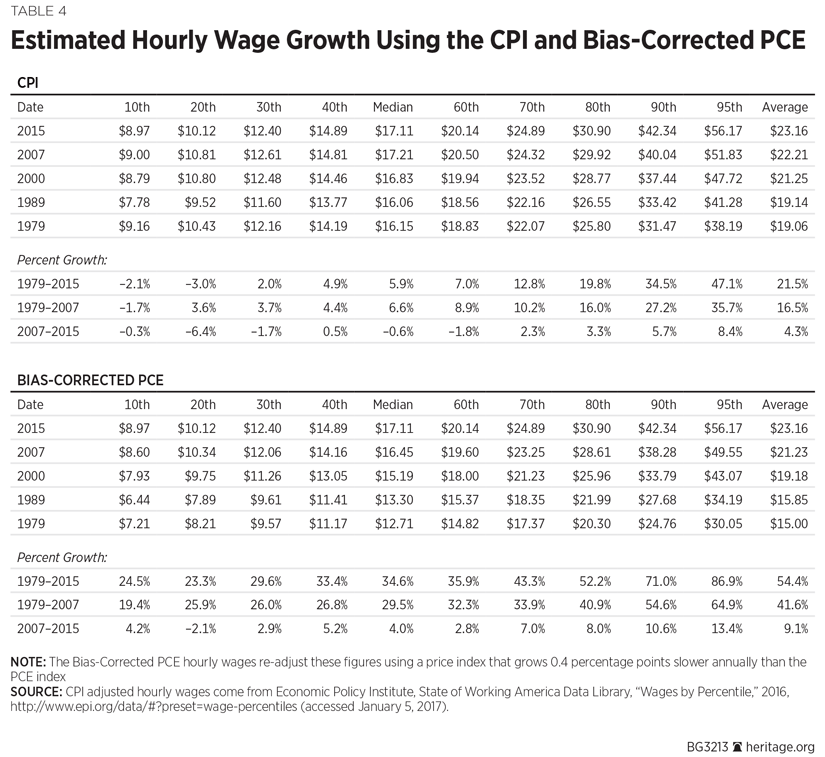
The two panels paint different pictures of wage growth. Adjusting for inflation with the CPI shows that median real wages have only grown 6 percent over 36 years. Wages appear to have fallen among the bottom 20 percent of earners. EPI’s figures show that only the highest earners are doing substantially better than in the 1970s. Many politicians have looked at this data and concluded the economy has been broken for decades.
The CPI’s inaccuracies drive this pessimistic conclusion. Anything inflation-adjusted with the CPI grows artificially slowly. Adjusting EPI’s wage estimates for inflation with the bias-corrected PCE shows considerable wage growth at all income levels until the Great Recession.
The bias-corrected PCE shows that median wages grew 35 percent between 1979 and 2015. Wages at the 20th percentile grew 23 percent. Higher earners enjoyed even faster growth; 80th-percentile wages grew 52 percent. The better inflation measure shows that wages rose considerably for all workers over the past generation.
However, this progress largely occurred before the Great Recession. Wage growth has slowed substantially since then.[REF] Between 1979 and 2007, median real wages grew 0.9 percent annually. Over that time, median wages grew a total of 30 percent. After 2007, annual wage growth fell almost in half to 0.5 percent a year. From 2007 to 2015, real median wages grew just 4 percent.[REF] At the 20th percentile of the wage distribution, real wages fell after 2007. Wage stagnation has become a popular topic because wages have stagnated. But that stagnation only goes back to the recession. Wages grew robustly in the three decades before the downturn.
Incomes Grew Substantially Between 1979 and 2007
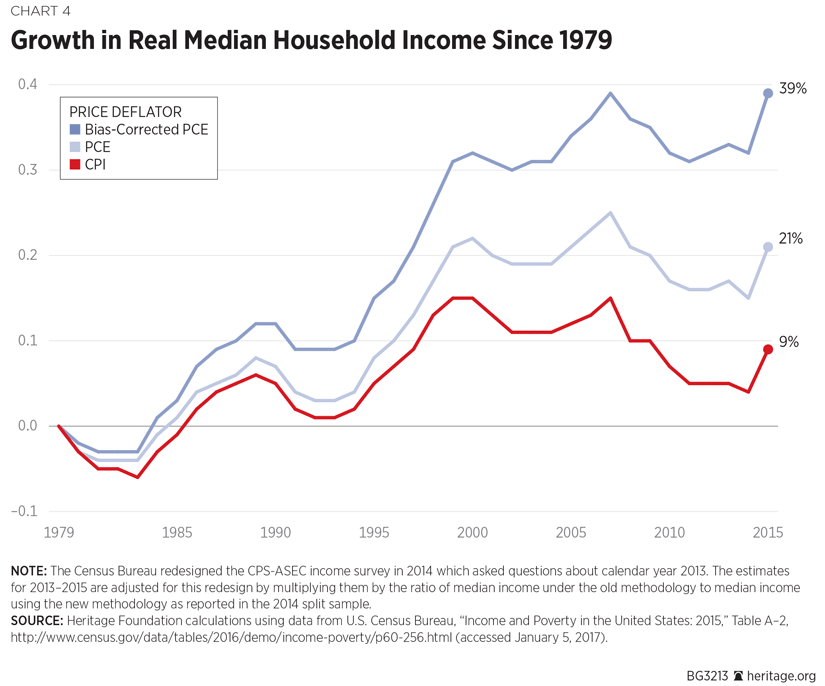
Household incomes also grew substantially over this period. Nonetheless, the media seldom reports this; news reports often claim that U.S. incomes peaked in 1999.[REF] This happens because reporters usually cite the Census Bureau’s median household incomes figures, which are adjusted for inflation with the CPI.[REF] This less-accurate inflation measure shows incomes grew only 9 percent between 1979 and 2015, and have fallen since 1999. If analysts adjusted the Census Bureau’s figures for inflation with the PCE they would show incomes rising 21 percent since 1979. If they used the more accurate bias-corrected PCE, they would find median household incomes grew 39 percent.[REF] All of that growth occurred between 1979 and 2007. Between 2007 and 2015, Census data show household incomes falling—no matter the inflation measure used.
However, the Census Bureau’s median income figures have problems beyond poor inflation adjustments. As analysts on both the left and the right point out, they:[REF]
- Do not account for changes in household sizes;
- Exclude non-cash income, such as employer-sponsored health coverage; and
- Ignore demographic shifts (such as the retirement of the baby boomers).
The CBO calculates household income figures that largely correct these problems. The CBO figures adjust for household size, include all income—including benefits—and are broken down separately for elderly and non-elderly Americans. The CBO further uses high-quality tax return data to estimate earnings, and adjusts for inflation with the PCE deflator. The media seldom report these figures because CBO analysts do not receive the tax return data from the IRS for several years. Consequently, the most recent CBO data is generally at least three years old. For instance, the CBO did not publish its 2013 income estimates until June 2016.[REF] The media instead focuses on the timelier—but less accurate—Census Bureau figures.
Chart 5 shows the CBO’s estimates of the growth in household income for the middle quintile of non-elderly childless households since 1979.[REF] The better CBO data show greater income growth than the Census figures. Adjusting for inflation with the less-accurate CPI shows incomes growing 35 percent between 1979 and 2007. Using the PCE, as the CBO does, shows that middle quintile incomes rose 47 percent between 1979 and 2007—a far cry from income stagnation. The bias-corrected PCE shows that middle-quintile incomes grew even more: by 64 percent.[REF] The CBO’s data show that middle-class incomes grew robustly in the three decades before the recession.
The CBO’s middle-quintile income estimates for elderly households and for households with children grew by 65 percent and 64 percent, respectively. But the overall middle-quintile average income grew somewhat less. That occurred because the number of childless and elderly households—which have lower incomes, on average—grew rapidly, while there was only modest growth in the number of households with children. As the baby-boom generation reaches retirement age in this decade and the next, demographic changes will continue to mask income growth if elderly and non-elderly households are lumped together.
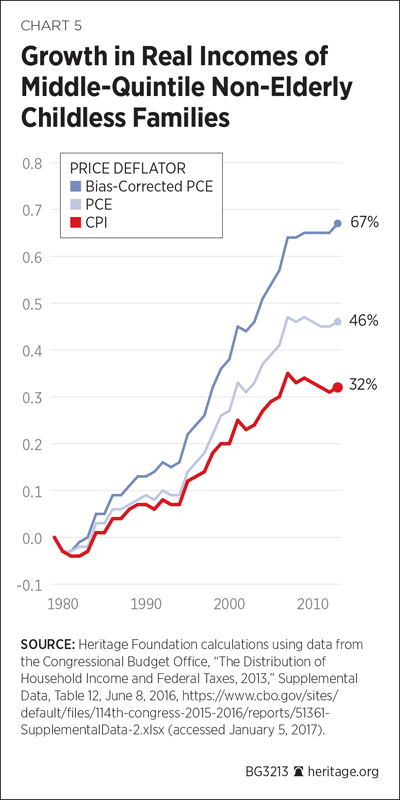
After the recession, the picture changes completely. All three inflation adjustments show negligible middle-quintile income growth between 2007 and 2013 (the most recent data available). Middle-quintile incomes fell slightly over that period when inflation-adjusted with the CPI or PCE. They grew less than 2 percent when adjusted using the bias-corrected PCE.[REF]
Income Stagnation is a Recent Phenomenon
U.S. incomes have stagnated, but this stagnation is a post-recession phenomenon. Wages and incomes grew for almost all Americans between 1979 and 2007. Despite the recent setback, current workers are substantially better off than their counterparts a generation ago.
This explains why almost no one talked about wage stagnation until recently, why consumption data show that Americans live better than in the 1970s, and why polls show that Americans believe they are living better than their parents did. Biased inflation measures hide these gains. Using a bias-corrected price index shows wages and incomes rising substantially until 2007.
Conclusion
Many commentators claim that U.S. wages and incomes have stagnated over the past generation. These concerns are—somewhat—misplaced. American living standards grew robustly until the Great Recession. Surveys and consumption data show that Americans enjoyed substantially higher material living standards in the mid-2000s than in the late 1970s. Since the recession, wages and incomes have grown only slightly.
Biases in the government’s price indices obscure these facts. The Consumer Price Index has small sample sizes at the item-area level, does not account for changing consumption patterns, uses an inaccurate survey to estimate its sample weights, ignores savings from new retail outlets, ignores the benefits of new goods and services, and misses many quality improvements. These biases systematically increase CPI inflation rates. An alternative price index, the Personal Consumption Expenditures deflator, corrects some of these problems. The PCE reports inflation rates approximately 0.3 percentage points lower than the CPI.
Unfortunately, neither the PCE nor the CPI accounts for savings when new outlets offer lower prices. So price indices ignore how the expansion of big box stores and online shopping has affected prices. Neither index accounts for how new products—like GPS navigation or cell phones—affect living standards. Economists also find these indices do not fully account for quality improvements. A conservative approximation is that these “outlet substitution,” “quality,” and “new product” biases inflate the PCE by 0.4 percentage points annually.
While these annual errors are small, they create significant bias over time. Adjusting for inflation with the CPI shows that median wages grew just 7 percent between 1979 and 2007, while middle quintile household incomes grew 35 percent. Adjusting for inflation with the bias-corrected PCE shows that median wages grew 30 percent, and middle quintile demographically steady household incomes grew by 64 percent to 65 percent over that period. The better inflation measure shows that, on the eve of the Great Recession, American living standards had grown considerably for three decades.
Both the official and bias-corrected price indices show that living standards have stagnated since the recession. Using the CPI shows that median wages and middle-quintile incomes have fallen slightly since 2007. The bias-corrected PCE shows that median wages have grown only 4 percent, and middle-quintile incomes only 2 percent since then. Wage and income stagnation are a real, but recent, problem for Americans.
—Salim Furth, PhD, is Research Fellow in Macroeconomics in the Center for Data Analysis, of the Institute for Economic Freedom, at The Heritage Foundation. James Sherk contributed to this research while he worked at The Heritage Foundation.
Appendix A: Additional Price Index Biases
Economists have recently identified other biases in the official price indices. Until these biases receive more scholarly attention, it would be premature to recommend incorporating them into inflation adjustments. If, however, further research confirms that these are indeed real, large upward biases in inflation measurement, economists will have to further revise their views of historical income growth.
Consumer-Valuation Bias. Columbia University’s David Weinstein and Stephen Redding, an economist at Princeton University, recently published a paper examining a contradiction between price index economics and microeconomics.[REF] The economic theory underlying price indices like the PCE and CPI assumes that consumer preferences do not change. However, demand for products shifts all the time. For example, the grain-like seed quinoa exploded in popularity in the 2000s as Western consumers learned of its health benefits. Micro-economists routinely estimate supply-and-demand relationships by identifying factors that change preferences.
Redding and Weinstein report that assuming unchanging preferences creates a “consumer valuation bias.” Higher prices caused by higher demand are fundamentally different, from a welfare economics perspective, than higher prices caused by a supply shift.
Existing price indices ignore this dynamic. They are built on models that assume that demand remains constant and that higher product valuations do not offset higher prices at all.
Redding and Weinstein propose a new “Unified Price Index” that accounts for changing preferences and embeds most existing price indices as special cases. Using barcode data for U.S. consumer goods, they show that their estimator works well in practice. It also reports drastically lower inflation than existing indices. The Unified Price Index reports approximately 3 percentage points lower annual inflation for U.S. consumer goods than price indices constructed using the PCE formula.[REF]
If Redding and Weinstein are correct, consumer valuation bias significantly affects U.S. inflation estimates. However, theirs may be the first attempt at incorporating shifting demand into price indexing. More research validating their finding should be conducted before the Unified Price Index is put into use.
Additional Substitution Bias. Economists consider the PCE to be more accurate than the CPI because its formula (a Fisher index) accounts for the way consumers substitute between products, such as by buying more apples and fewer bananas when apple prices fall. However, new research finds that the PCE index does not fully account for changing consumption patterns. David Weinstein, in collaboration with Jessie Handbury and Tsutomu Watanabe, economists at the University of Pennsylvania and Tokyo University, respectively, examined substitution bias using Japanese grocery-scanner data.[REF] They applied inflation indices using the CPI and PCE formulas to scanner data covering essentially all Japanese grocery sales between 1988 and 2010. They compared the CPI and PCE formulas to a Törnqvist index, the theoretically ideal inflation measure (but which can only be implemented with very rich data).
They unsurprisingly found that substitution bias causes the CPI to overstate inflation relative to the ideal Törnqvist index. But they found that the PCE index overstates inflation, too. At moderate levels of inflation, they reported that the PCE index overstates inflation by 0.5 percentage points to 0.7 percentage points a year.[REF]
Some of this bias occurs because the PCE and CPI indices are calculated on a sample of prices, while they calculated the Törnqvist index using the entire universe of grocery products and price data. However, they report that the larger sample size explains relatively little of their results. Instead, they find that the BLS lower-level formulas (for estimating inflation at the item-area level) do not fully account for lower-level product substitution. This imparts a considerable upward bias to the overall inflation estimates.
If Weinstein, Handbury, and Watanabe are correct, the 0.4 percentage point adjustment to calculate the “bias-corrected PCE” is a very conservative assumption. The authors do not attempt to adjust for new-product, quality, or outlet-substitution biases. Their findings suggest that substitution bias alone inflates the PCE by more than 0.4 points. This implies that total PCE bias is approximately 1 percentage point a year. However, this is the first report of substitution bias of this magnitude. More research needs to be conducted to confirm it before concluding that the PCE overstates inflation so substantially.
Appendix B: Differences in Goods and Services
Covered by the PCE and CPI
Price index economists virtually unanimously agree that a chained index (such as the PCE) measures inflation more accurately than a fixed-basket Laspeyres inflation index (such as the CPI). The chained formula reduces small-sample and consumer-substitution biases.
Some economists, such as those at the Economic Policy Institute (EPI), recognize this effect but nonetheless adjust inflation with the CPI. EPI argues that the PCE includes some goods and services not directly relevant to consumer welfare: third-party health care spending and the expenditures of some nonprofit organizations (the CPI excludes these items). EPI contends that including these sectors causes the PCE to understate the true inflation rate. As one EPI report explains:
[The PCE] has the advantage that it is “chained” to account for substitution bias. This chaining means, all else equal, that it will show a slower rate of inflation than the CPI-U-RS. However, the chained aspect of the PCE only explains about a third of the average annual difference between the CPI-U-RS and the PCE. The remainder of the difference highlights some possible disadvantages with uncritically adopting the PCE as the deflator.
For example, the PCE deflator includes not just consumption costs faced by households but all consumption purchases made in the United States, regardless of whether the payer is a household. So, for example, health care costs that are borne by governments or employers are included in the PCE. And the costs of rent paid by nonprofit organizations are also included in the PCE deflator, as are computers and associated equipment purchased by them. As the price of rent has generally risen faster than overall prices and the price of computers has plummeted in recent decades, this leads to slower price growth in the PCE, but this is not necessarily accurately reflecting the living standards of typical American households.
Given all of this, it seems to us that the virtues of the CPI-U-RS outweigh those of the PCE deflator, and this is what we use in our work.[REF]
This argument lacks merit. Including additional medical spending and nonprofit expenditures leads to faster price growth in the PCE. If the PCE excluded them, it would report even slower inflation growth relative to the CPI than it currently does.
Economists at the Bureau of Economic Analysis (BEA) and the Bureau of Labor Statistics (BLS) publish a reconciliation of the difference between the two inflation indices. They decompose the difference into four components:
- A formula effect caused by using a chained methodology instead of a fixed-basket Laspeyres methodology;
- A weight effect caused by goods and services with different relative importance in the two surveys;
- A scope effect reflecting the two surveys covering different goods and services; and
- All other differences.
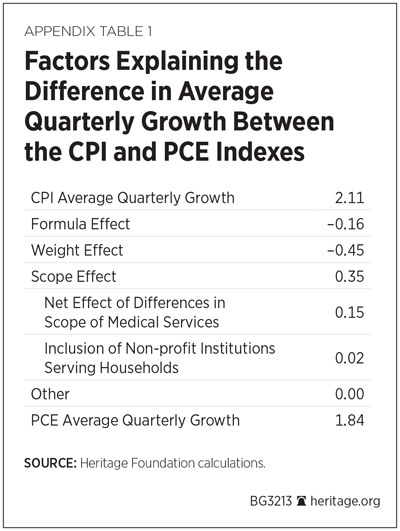
The BEA regularly publishes and updates this reconciliation. Appendix Table 1 shows the average contributions of these factors to the difference in PCE and CPI inflation between 2002 and Q3 2016. Over this period, the CPI reported a 0.27 percentage point faster average annual inflation than the PCE. The CPI grew at 2.22 percent a year, while the PCE grew at 1.84 percent a year.
About three-fifths of this net difference—0.16 percentage point—comes from the formula effect. The weight effect reduces PCE inflation by another 0.45 percentage point. The scope effect acts in the opposite direction: Including additional goods and services increases PCE inflation by 0.35 percentage point a year.[REF]
The nonprofit and third-party health care expenditures that concern EPI added 0.17 percentage points a year to PCE inflation rates.[REF] Including them causes the PCE to report faster—not slower—inflation. Intuitively, health care prices and nonprofit expenditures have grown faster than the overall inflation rate. The PCE’s expanded scope thus increases the inflation rate it reports.
The PCE uses a superior chained formula that reduces small sample bias and consumer substitution bias. It also uses more accurate weights to measure consumer spending. As a result, it reports lower inflation than the CPI. The PCE would report even less inflation if its scope were restricted to the goods and services EPI considers appropriate. The expanded scope of the PCE offers no reason to use the upwardly biased CPI.