Emma Waters
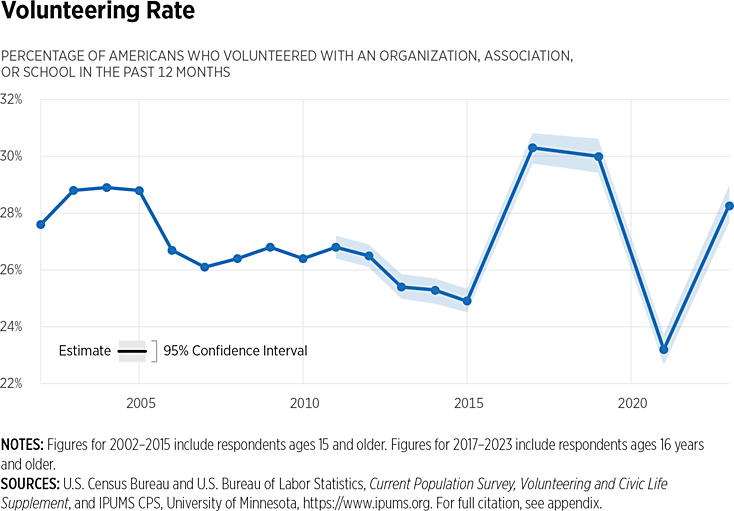
The chart depicts the share of Americans ages 15 and older who have volunteered at some point during the past year, covering a period from approximately 2000 to 2021. The trend indicates a general decline in volunteerism from the early 2000s to the mid-2010s, followed by a notable increase around 2016–2019, a sharp drop in 2020 (likely due to the COVID-19 pandemic), and a partial recovery thereafter.
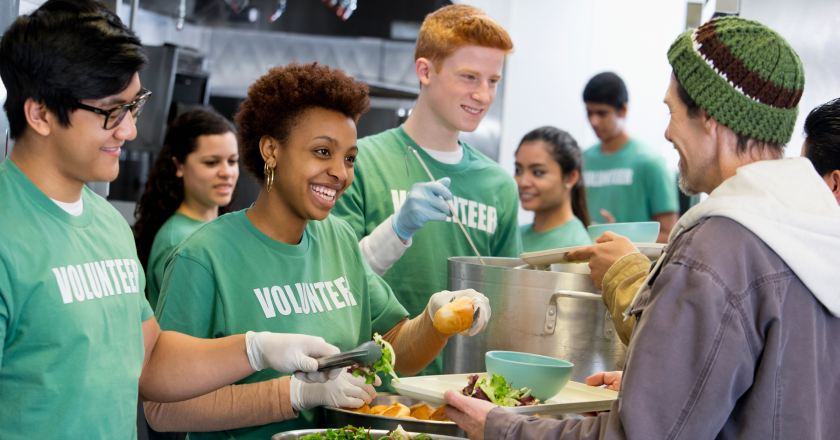
In 2024, as devastating floods and tornadoes tore through North Carolina, Americans did not wait for government intervention. Thousands of volunteers mobilized—through churches, nonprofits, and grassroots efforts—to deliver supplies, rebuild homes, and support displaced families. The disaster exposed federal failings, but it also highlighted a defining characteristic of American life: an enduring culture of volunteerism. Whether responding to crises or engaging in ongoing community service, Americans consistently demonstrate a deep sense of personal responsibility and civic duty that sustains some of the world’s highest rates of volunteerism.[REF]
Despite declines in other forms of social engagement since the 1970s, volunteerism in the U.S. has remained remarkably stable with participation rates between 25 percent and 30 percent since 2001.[REF] However, trends over the years reveal interesting patterns. Volunteer rates declined between 2008 and 2015 and then increased sharply between 2016 and 2019. This surge coincided with economic growth, optimism, and a renewed sense of personal agency that reflected how national morale and economic confidence can influence civic engagement.[REF] Though participation fell sharply in 2020 during the COVID-19 pandemic, the partial recovery in 2021 suggests that volunteering is a deeply ingrained aspect of American life, not just a pastime.
The data further reveal that those who are most engaged in volunteer work—married individuals, parents, and religiously involved people—tend to have stronger connections to their local communities. Married individuals volunteer at a rate of 27 percent compared to 18 percent for those who have never married, and those with children under 18 participate at even higher rates.[REF] Among married parents, 33 percent volunteer compared to 25 percent of married individuals without children. Even when accounting for all parents with children under 18—whether married or not—participation remains high at 30 percent.[REF] Religious affiliation also plays a significant role, as those who regularly attend services are more likely to volunteer, often through church-organized efforts that extend into the broader community.[REF] These patterns suggest that volunteerism flourishes when people feel a personal investment in their surroundings.
My experiences volunteering with my family through church programs, community service projects, and local food drives instilled in me a lifelong understanding that purpose is found in serving others. As many teenagers and young adults face challenges related to depression, anxiety, and digital isolation, a possible solution lies in encouraging greater volunteer participation.[REF] The nature of volunteerism suggests that increasing volunteer opportunities will create a positive feedback loop that benefits both individuals and their broader communities.
Endnotes
- Michiel Gen, “How Understanding European Attitudes About Volunteering Can Help Associations,” American Society of Association Executives, February 1, 2023, https://www.asaecenter.org/resources/articles/an_plus/2023/2-february/how-understanding-european-attitudes-about-volunteering-can-help-associations#:~:text=It%20is%20also%20interesting%20to,d%20to%20almost%2025%20percent (accessed April 5, 2026). ↩
- Figure 1, “Volunteer Rates, 1974–2015,” in SCP Report No. 2-17, Volunteering in America, U.S. Congress, Joint Economic Committee—Republicans, Social Capital Project, September 2017, p. 3, https://www.jec.senate.gov/public/_cache/files/6b62f731-2b86-48b8-9531-73ce987af697/2-17-jec-report-volunteering-in-america.pdf (accessed April 5, 2026). ↩
- The White House, “Economy & Jobs,” https://trumpwhitehouse.archives.gov/issues/economy-jobs/ (accessed April 5, 2026). ↩
- Heritage Foundation Calculations based on “Volunteering by Marital Status,” Current Population Survey Data, Volunteer Supplement, IPUMS, 2021. ↩
- Ibid. ↩
- See “Are ‘Nones’ Less Involved in Civic Life Than People Who Identify with a Religion?” Chapter 3 in Smith et al., Religious “Nones” in America: Who They Are and What They Believe, pp. 30–42. ↩
- U.S. Department of Health and Human Services, Office of the Surgeon General, Protecting Youth Mental Health: The U.S. Surgeon General’s Advisory, 2021, https://www.ncbi.nlm.nih.gov/books/NBK575984/pdf/Bookshelf_NBK575984.pdf (accessed April 1, 2026). ↩
Sources
- U.S. Department of Commerce, Census Bureau, and U.S. Department of Labor, Bureau of Labor Statistics, Current Population Survey, Volunteering and Civic Life Supplement, 2011–2023 [data and nonresponse replicate weights], page last revised November 12, 2024, https://www.census.gov/data/datasets/time-series/demo/cps/cps-supp_cps-repwgt/cps-volunteer.html (accessed May 11, 2026).
- U.S. Census Bureau and U.S. Bureau of Labor Statistics, Current Population Survey, Civic Engagement and Volunteering Supplement, as distributed by Sarah Flood, Miriam King, Renae Rodgers, Steven Ruggles, J. Robert Warren, Daniel Backman, Etienne Breton, Grace Cooper, Julia A. Rivera Drew, Stephanie Richards, David Van Riper, and Kari C.W. Williams, IPUMS CPS: Version 13.0 [dataset], Minneapolis, MN: IPUMS, 2025, https://doi.org/10.18128/D030.V13.0 (accessed May 11, 2026).