
The annual number of abortions in the United States has trended downward for more than three decades. But in 2018 and 2019, the number of abortions increased two years consecutively for the first time in over 30 years. Abortions increased even as the number of births decreased, signaling that perhaps the long-term decline in abortions had reversed. The most recent data from the Centers for Disease Control and Prevention (CDC) shows that the number of abortions in the United States fell in 2020. Does 2020 represent a reversal in the abortion trend from the prior two years? What can we glean from the data to provide further clarity on where abortion trends are heading?
While the tally for the number of abortions tells us how many abortions are occurring, it does not tell us how likely women are to opt for abortion and, by itself, it cannot tell us if society is becoming more pro-life or less pro-life. Changes in fertility or the population of women can cause the number of abortions to fluctuate even if the propensity to abort remains constant. There are two statistics that capture the prevalence of abortion and provide insight into how the occurrence of abortion tracks with changes in fertility and population:
- The abortion rate tells us how common abortion is among reproductive age women. It is defined as the number of abortions per 1,000 women of reproductive age (15–44 years of age).
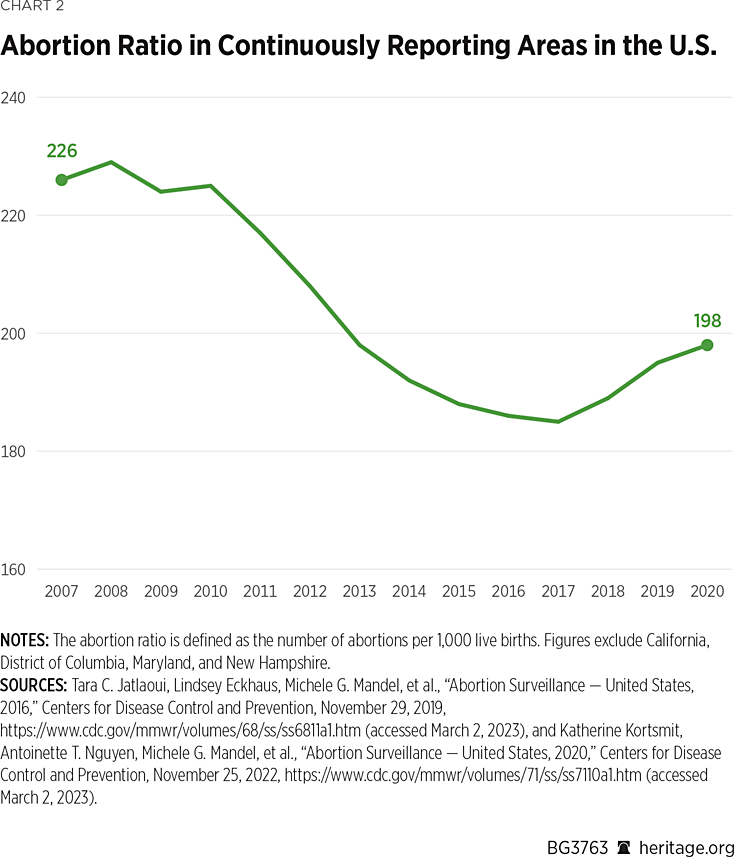
- The abortion ratio indicates how common abortion is as a pregnancy outcome and gives a sense of how likely it is for mothers to choose life for their unborn children. It is useful for detecting changes in abortion trends that are sensitive to changes in fertility. The abortion ratio is defined as the number of abortions per 1,000 live births.
According to CDC data, the abortion rate fell in 2020 while the abortion ratio rose. To provide further clarity on these differential trends, I estimated the percentage of pregnancies ending in abortion using demographic techniques. I found that the percentage of pregnancies ending in abortion in 2020 remained unchanged, whereas it had increased in 2019. This indicates a leveling-off in 2020 of the rising trend in the likelihood of women opting for abortion. As a result, the trajectory in abortion trends improved in 2020 and, at least for now, appears to be on track for resuming the long-term downward trend seen for the past three decades. Time will tell, however, as the declining number of abortions in 2020 may have been affected by the COVID-19 pandemic or other unaccounted-for factors. Significant regulatory action to loosen health and safety protocols for abortion pills in 2016 and 2020 may have additionally led to more abortions in the ensuing years and may, in the future, continue to limit pro-life states’ ability to protect women and girls from these drugs.REF
Taking a multi-year view of recent trends, since 2014, the abortion ratio nationally has increased by 3 percent. But at the state level, there is considerable variation in abortion trends. In many states, the abortion ratio has increased, but it increased in some states more than in others. Other states have seen declines in the abortion ratio. Policies at the state level aimed at restricting abortion provide one possible explanation for the differences in abortion trends. The data reveal a moderate negative correlation between the number and rigor of abortion restrictions and the abortion ratio. As a result, more abortion restrictions are associated with lower abortion ratios, even in spite of out-of-state abortion options being available.
Number of Abortions Fell, but the Likelihood of Opting for Abortion Did Not
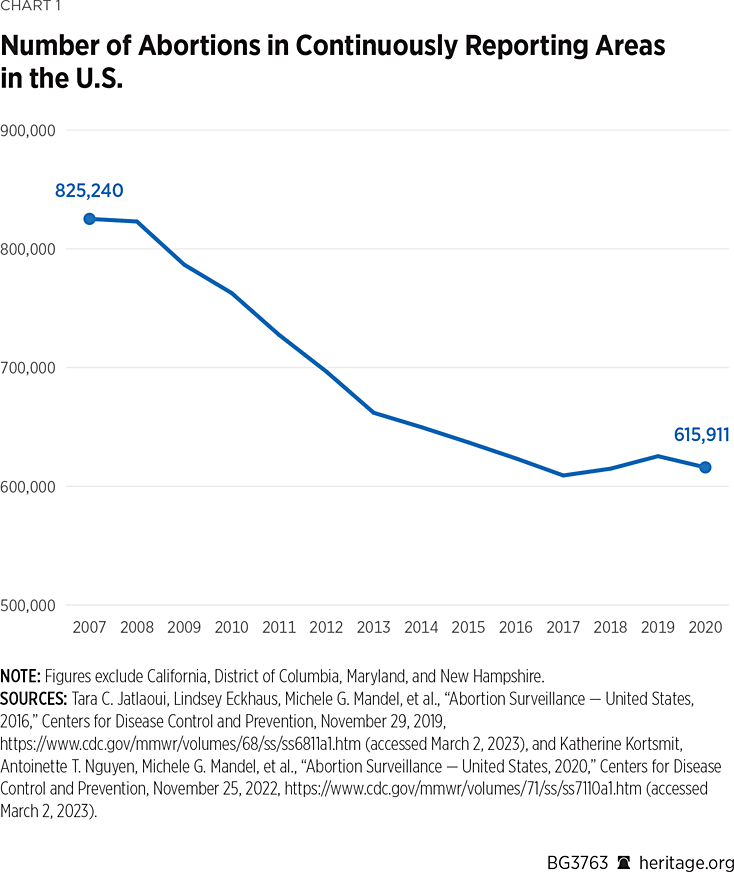
According to CDC data, the number of abortions in the United States peaked in 1990 at 1.4 million and has declined nearly every year since.REF For a decade, between 2007 and 2017, the number of abortions declined consistently year on year. The abortion rate also either fell or remained constant each year and the abortion ratio fell in every year except 2008 and 2010, at least among the states that consistently reported data over this period. But in 2018 and 2019, the number of abortions rose two years consecutively for the first time in 30 years. The abortion rate and the abortion ratio also rose. The last time the number of abortions, the abortion rate, and the abortion ratio all rose in the same year was in 1996, according to CDC data, and then only for a single year. It seemed that the long-term declining trend in abortions had perhaps reversed.
It is unclear why the number of abortions increased in 2018 and 2019. Perhaps privately run funds established to pay for women’s abortions are partly to blame. The budget of at least one of these has swelled in recent years.REF Growing cultural acceptance of abortion among Millennials and Generation Z may also play a role. These cohorts accounted for almost all abortions during these years. According to one nationally representative survey, the percentage of Millennials and Gen Z over the age of 18 who said that they supported legal abortion without conditions in the first trimester or beyond increased from 53 percent in 2017 to 60 percent in 2018 and to 54–58 percent in 2019.REF
Another possible contributing factor to the rising number of abortions was the Food and Drug Administration (FDA) loosening safety protocols for the abortion pill mifepristone in 2016. The FDA then changed the Risk Evaluation and Mitigation Strategy for mifepristone by allowing the drug to be prescribed later in pregnancy and by reducing the number of visits a woman needed to make to a physician’s office—changes that, in turn, likely led to an increase in overall chemical abortions.
According to the CDC, a sobering 620,327 abortions took place in 2020 in the 47 states that reported data plus the District of Columbia.REF This tally, however, does not include abortions that took place in California, Maryland, or New Hampshire, as these states do not report data to the CDC.
While the number of abortions in the United States remains shockingly high, there is reason for hope. In 2020, the number of abortions fell for the first time in three years, declining by 1.5 percent compared to 2019. The abortion rate also declined to 11.2 abortions per 1,000 women 15–44 years of age, the lowest rate on record since the Roe v. Wade decision. As a result, there were not only fewer abortions in 2020 than in 2019 but also fewer abortions among women in their childbearing years.
But despite a decline in the number of abortions and the abortion rate, the abortion ratio increased in 2020. The national abortion ratio was 198 abortions per 1,000 live births in 2020, a slight increase from 195 in 2019. What are we to make of these differential trends? A closer look at the abortion ratio will make the apparent discrepancy clearer.
Historically, the abortion ratio declined between 2011 and 2017 but increased in 2018, 2019, and 2020. On net, the abortion ratio increased by 3 percent between 2014 and 2020.
While the abortion ratio can provide a measure for how frequently women opt for abortion when they become pregnant, this metric has shortcomings when interpreted in this way. For one, abortions are most likely to occur in the early stages of pregnancy. There is a significant gap in time between when women are making decisions about abortion and when births actually occur. But the abortion ratio measures the number of abortions relative to the number of births, not relative to the number of pregnancies. As a result, the cohort at-risk for abortion does not exactly match the cohort of live births used to calculate the abortion ratio. Secondly, the abortion ratio does not account for natural pregnancy loss, and this needs to be taken into account if our interest is in assessing the frequency of induced abortion as a pregnancy outcome.
These shortcomings can be addressed if we instead estimate the rate or proportion of pregnancies that end in abortion. This would provide a sense of how likely women are to opt for abortion when they become pregnant. In states that reported data to the CDC, I estimate that approximately 8.3 percent of all pregnancies at or beyond five weeks gestation in 2020 were terminated through abortion.REF This is virtually unchanged from the estimated percentage of pregnancies that ended in abortion in 2019.
So while fewer abortions occurred in 2020 compared to 2019, it does not appear that women in 2020 were less likely to choose abortion. As it turns out, while the number of abortions in the United States fell in 2020, this occurred primarily due to a decline in the number of pregnancies. The number of pregnancies began increasing in the later part of 2020 but not enough to push the 2020 total higher than the 2019 total. As a result, the number of unborn children at risk for abortion shrank in 2020 compared to 2019. Had the number of pregnancies been the same in 2020 as they had been the previous year, the number of abortions would have likely remained about the same.
Although there was almost no change in the percentage of pregnancies ending in abortion between 2019 and 2020, the trend had slowed compared to the prior year. In 2019, the percentage of pregnancies ending in abortion had increased slightly compared to 2018. So while the likelihood for women opting for abortion did not change in 2020, it at least had slowed compared to 2019.
Despite a rise in the abortion ratio in 2020, there is no evidence that a larger proportion of pregnant women were opting for abortion. The percentage of pregnancies ending in abortion did not appreciably change that year. Increases in the abortion ratio in 2020 appear to be largely due to a mix of fewer births relative to 2019 (decreasing the denominator of the abortion ratio) and an upward trending number of pregnancies in the later part of the year (increasing the size of the cohort of unborn children at risk for abortion). Overall, data for 2020 indicate that abortion trends are declining once again and have, for now at least, resumed the 30-year long-term downward trend in abortions. Time will tell if abortions continued to trend downward in 2021 and beyond as declining trends in 2020 may have been affected by the COVID-19 pandemic.
The Pandemic Moved Abortions out of Clinics and into Homes
COVID-19 affected access to abortion in many ways. Lockdowns were implemented in many states starting in March 2020. Some pro-life states temporarily locked down abortion clinics, as elective abortion was not permitted as an essential service in those states.
In July 2020, a federal judge, under the cloak of COVID-19-era emergency powers, blocked an FDA safety protocol that had required the abortion pill be given to a patient in-person at a health facility under the supervision of a certified prescriber.REF The ruling opened the door for abortion pills by mail and dangerous at-home abortions.REF
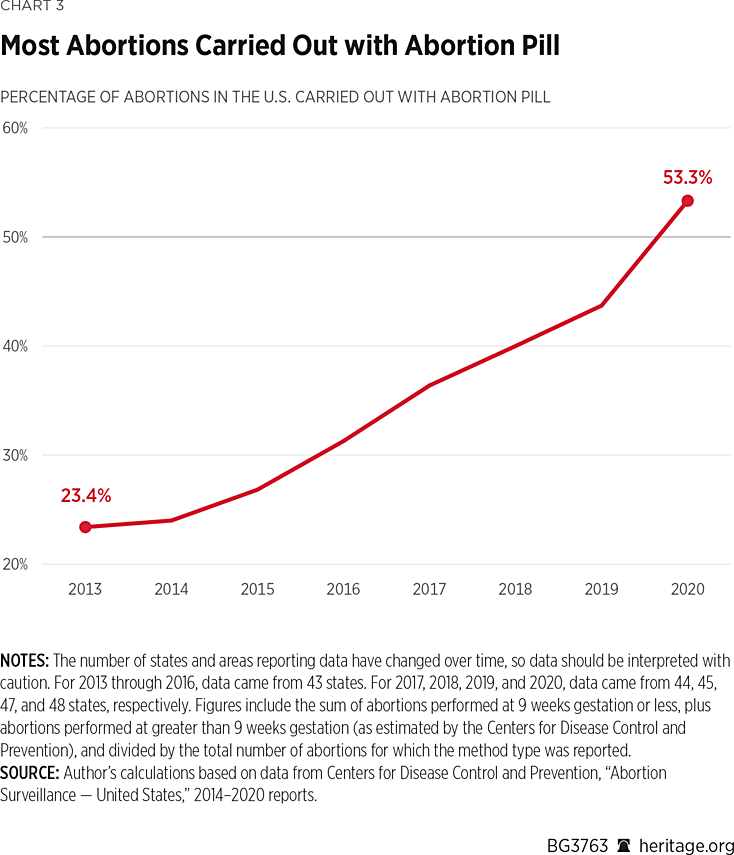
As a result, 2020 saw a big shift from surgical abortion to reliance on the abortion pill. Before the pandemic, 44 percent of induced abortions were carried out using the abortion pill. But in 2020, a majority of all abortions (53 percent) were carried out with the pill, CDC data shows.
The CDC’s Data Are Incomplete
The CDC’s numbers are a considerable underestimate of the actual number of lives lost to abortion. California, Maryland, and New Hampshire have consistently failed to report abortion data to the CDC for years. These three states collectively accounted for one-fifth of all abortions in the United States in 2020, according to the Guttmacher Institute,REF a pro-abortion research organization formerly affiliated with Planned Parenthood.
Unlike the CDC, the Guttmacher Institute collects abortion data from abortion facilities in all 50 states and the District of Columbia. Guttmacher’s numbers tend to be higher than the CDC’s and are in some cases considered more reliable.
According to Guttmacher’s estimates, 930,160 abortions took place in the United States in 2020.REF The national abortion ratio in 2020 using Guttmacher’s numbers was 257 abortions per 1,000 live births.REF
 REF
REF
State-Level Variability in the Abortion Ratio
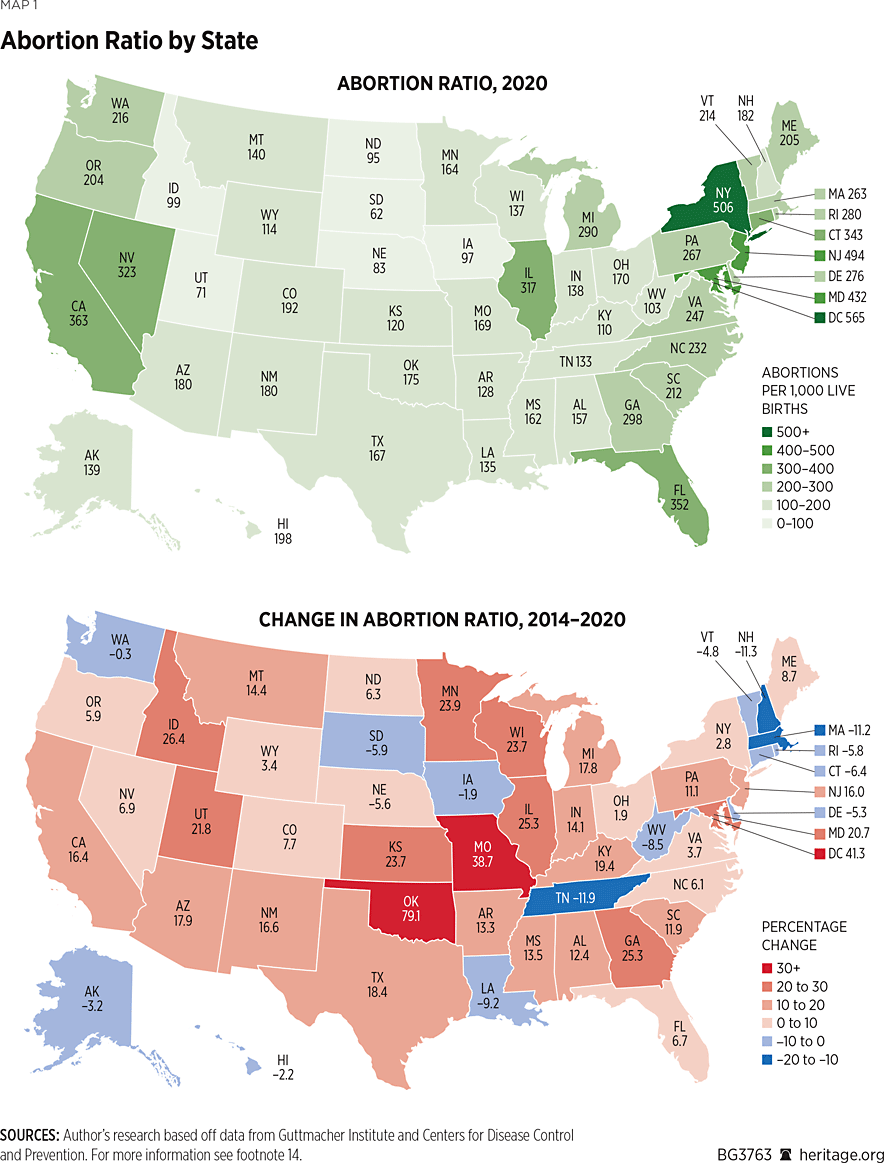
State-level data from the Guttmacher Institute from 2020 show considerable variability in the abortion ratio from a low of 71 abortions per 1,000 live births for Utah state residents to a high of 565 abortions per 1,000 births for residents of the District of Columbia.REF
With a few exceptions, abortion ratiosREF tend to be higher in states on the East and West Coasts and in states that are progressive strongholds. Abortion ratios are highest (above 300) in liberal-leaning states California, Connecticut, Illinois, Maryland, New Jersey, and New York. Only two more conservative-leaning states (Florida and Georgia) have abortion ratios near or above 300. By contrast, abortion ratios are comparably lower throughout the nation’s midsection and in predominantly conservative-leaning states that tend to impose numerous legal restrictions on abortion.
Abortion ratio trends over time also differ considerably between states. Between 2014 and 2020, the abortion ratio rose in most states but more so in some states than in others. There were sharp declines in the abortion ratio in states with significant abortion restrictions such as Louisiana, Tennessee, and West Virginia as well as in some New England states with few abortion restrictions such as Massachusetts and New Hampshire.
Many of the states that saw the sharpest declines in abortion ratios during this period enacted new rigorous abortion restrictions. For instance, Tennessee introduced mandatory counseling prior to abortion (in 2015), made it mandatory for an abortionist to display and describe an ultrasound image and make the fetal heartbeat audible for the patient prior to an abortion (in 2020), and put in place a 48-hour mandatory waiting period for abortion (from 2015 to 2020).
In 2018, Louisiana passed a law authorizing the state Department of Children and Family Services to post on its website a list of state and private adoption agencies, facilities in the state that offer free ultrasounds to pregnant women, and entities that provide free and confidential adoption counseling.
West Virginia enacted a suite of new laws including a 20-week abortion ban (in 2015), a ban on dilation and evacuation (a.k.a. “dismemberment”) abortion (in 2016), and a ban on tele-abortion (in 2017). In 2018, voters approved a new constitutional amendmentREF effectively ending public funding for abortion through MedicaidREF except in cases of rape or incest, a “lethal” fetal “anomaly,” or where the pregnancy will place the mother in “serious risk of substantial life-threatening physical impairment of a major bodily function, not including psychological or emotional conditions.”REF
On the other end of the spectrum, large increases in the abortion ratio from 2014 to 2020 occurred in the District of Columbia, Georgia, Idaho, Illinois, Maryland, Missouri, and Oklahoma and throughout much of the Midwest and Mountain West regions. A sharp increase in the abortion ratio in Oklahoma may have been due to an increase in the number of abortion clinics in the state from 3 to 5 between 2014 and 2020. States along the southern border from Arizona to Texas and in the Western states of Idaho, Nevada, and Utah rose during this period, perhaps in part due to an influx of new residents from California, where the abortion ratio is among the highest in the nation.
While the Guttmacher Institute collects data in all 50 states, its data relies on voluntary reporting from abortion providers, and so data quality and accuracy can vary. In its 2020 Abortion Provider Census, Guttmacher was forced to estimate or impute the number of abortions for 31 percent of the abortion providers they surveyed.REF Additionally, Guttmacher does not collect data on abortions obtained outside of clinical settings such as personally requested abortion pills by mail and self-managed abortions.REF As a result, state-level data and trends may provide significant overestimates or underestimates of the true number of abortions that actually occurred.
For instance, while Guttmacher data shows a very steep increase in the abortion ratio in Missouri between 2014 and 2020 (a 38 percent increase), the CDC’s state-level data on Missouri shows an increase of 21 percent—much lower than Guttmacher’s estimate and closer to the change in the ratio seen in other Midwestern states such as Illinois, Kansas, and Wisconsin. Clearly, there was a rise in the abortion ratio among Missouri residents over this period, but the magnitude of this increase is somewhat uncertain due to inconsistent reporting and incomplete data. Similarly, there is reason to doubt Guttmacher’s numbers for the state of Oklahoma. While Guttmacher reports a steep 79.1 percent increase in the abortion ratio, available data from the CDC reports an opposite steep 17.2 percent decline in the abortion ratio in Oklahoma between 2014 and 2020. In fact, according to Guttmacher, the abortion ratio in Oklahoma declined by 2.5 percent between 2014 and 2017. This means that Guttmacher claims that the abortion ratio in Oklahoma increased by a staggering 83.7 percent in the span of only four years. This figure is a sizeable outlier compared to the change in the abortion ratio in the other 49 states.
Abortion Ratios Tend to Be Lower in States That Have More Legal Restrictions on Abortion
Differences in the abortion ratio among states may be partly attributable to state-level legal restrictions on abortion. Analysis of state-level data shows that there is a moderate negative correlation between the abortion ratio and the number of abortion restrictions. As the number and rigor of abortion restrictions increases, the abortion ratio tends to be lower.
The Guttmacher Institute regularly tracks state laws on abortion. Using Guttmacher data from 2020,REF I created an index for each state based on the number and rigor of state-level abortion restrictions.REF Essentially, the higher the index is for a given state, the more types of abortion restrictions were in place in that state in 2020.
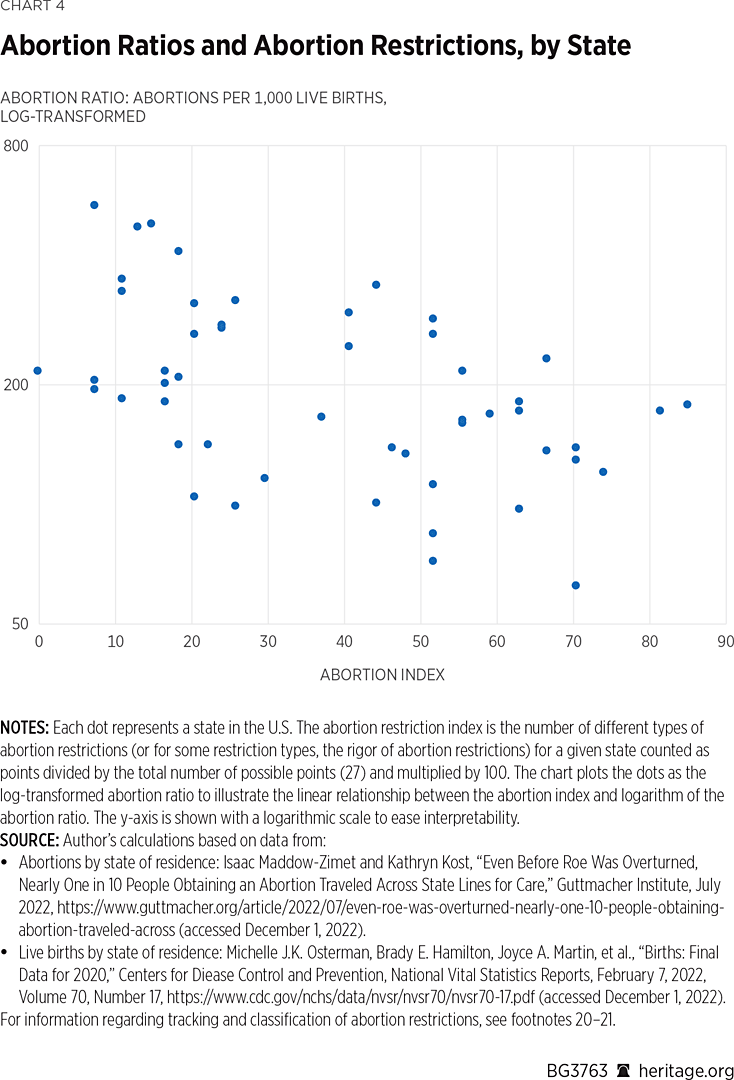
A Spearman’s rank correlation coefficient was computed for the ranks of the abortion restriction index and the ranks of the abortion ratio by state of residence.REF There was a moderate negative correlation between the ranks of the abortion restriction indices and the ranks of the abortion ratios (R = –0.51, 95% confidence interval: –0.28 to –0.69). A Spearman’s correlation test revealed that there is a high probability that there is a true nonzero correlation between the abortion ratio and the abortion restriction index (p-value < 0.001). Figure 4 shows a scatterplot of the abortion restriction index and the log-transformed abortion ratio.
This means that as the number of abortion restrictions in a state increased, the abortion ratio for residents living within the state in 2020 tended to be lower. This is noteworthy as it shows that abortions restrictions within a state are associated with a reduction in the abortion ratio for state residents even though there are in many cases options for more open abortion access in bordering states. On average, each additional abortion restriction imposed on the state level was associated with a 4 percent decrease in the abortion ratio.REF
While these results have not been controlled for confounding factors—and should therefore be interpreted with caution—they are perhaps an indication that states that pass more abortion restrictions have lower abortion ratios.
Conclusion
According to CDC data, abortions declined in 2020, resuming the long-term downward trend seen for the past three decades. Time will tell if it will remain permanent or if it was simply due to fewer pregnancies than the prior year or due to the confluence of events surrounding the COVID-19 pandemic. Regulatory action expanding the reach of abortion pills,REF along with illegal pill distribution,REF will continue to challenge state efforts to protect women and unborn children.
Exploratory analysis of the data reveals a moderate negative correlation between state restrictions on abortion and the abortion ratio. Further research would be needed to determine whether or not this association is obscured by confounding factors, but the results indicate that abortion restrictions or the factors that contribute to the adoption of pro-life laws have something to do with a lower likelihood of women opting for abortion, even when out-of-state abortion access is available.
Much work is left to be done to ensure that every life in America is valued and protected. But as the CDC’s 2020 data reveals, we are at least moving in the right direction for now.
Jonathan Abbamonte is a Senior Research Associate in the Center for Data Analysis at The Heritage Foundation.


