In an effort to stem the spread of COVID-19, approximately 42 governors have issued “lockdown,” “shutdown,” “stay-at-home,” or “shelter-in-place” executive orders over the past four weeks.REF Others have closed schools and urged residents to stay in their homes. A few have taken less intrusive actions such as prohibiting large gatherings and closing bars, restaurants, and other entertainment-oriented businesses. In general, these shutdown executive orders close all “non-essential” business workplaces and require that individuals stay in their residences except for specific narrow purposes such as going to the grocery store or the pharmacy or seeking medical attention.REF
These orders have important potential public health benefits, but they also impose substantial costs on millions of ordinary Americans and businesses. As officials learn more about COVID-19 and discuss strategies that allow for the relaxation of these executive orders, they should also consider the economic costs of their decisions to impose or retain lockdown orders or other restrictions. This paper illustrates the magnitude of those costs in terms of lost output, lost employment, and the corresponding unemployment, all of which reflect the extent to which Americans are no longer able to live their lives.
We do not consider social or public health costs such as increased child abuse, suicides, drug abuse, alcoholism, domestic violence, and other crimes that may be associated with the substantial economic reverses that the United States is enduring. Although difficult to quantify, these are likely to be significant. The illustrations provided are not projections. They merely provide a richer context through which to view the range of potential costs of the recent efforts to suppress the spread of the coronavirus. What ultimately will happen to our economy and our society is largely a function of the policy choices that will be made over the next two or perhaps three months.
Naturally, as the restrictions imposed by governments become broader and of longer duration, the social and economic costs will escalate. More extreme proposals, such as those that would entail a national lockdown lasting for many months, are beyond the scope of this analysis. Those types of policies would dramatically reduce incomes for many millions of people for many years to come; cause a substantial share of U.S. businesses to fail; exacerbate the fiscal problems faced by federal, state, and local governments; harm retirement savings and pension plans; and reduce the ability of both government and the private sector to respond to the economic, social, and national security challenges of the future. Rather than analyze these longer-term issues, this analysis focuses on the short-term costs associated with the current COVID-19 response and illustrates that these costs are substantial.
Summary of State COVID-19 Cases and Executive Orders
As of April 14, there were 598,670 confirmed cases of COVID-19 and 24,485 deaths caused by COVID-19 in the United States according to data from the Center for Systems Science and Engineering at Johns Hopkins University.REF Although all U.S. states have reported cases of COVID-19, the distribution is quite uneven across states and counties. For instance, as of April 14, 45 percent of all reported cases were in New York (mostly New York City) and New Jersey according to the Centers for Disease Control and Prevention (CDC).REF The CDC further reports that as of April 14, 44 percent of the total reported COVID-19 deaths were in New York State and that nearly 80 percent of those deaths were in New York City.REF The geographical concentration of the epidemic has remained largely unchanged as the virus has spread.REF
The government response to the COVID-19 epidemic has varied by state. As of April 7, 2020, 42 states had issued shutdown orders.REF Another three states have cities or regions that are subject to shutdown orders, and 95 percent of the U.S. population lives in states that are subject to statewide shutdown orders. Another 2 percent lives in states where a substantial portion of the state has been shut down.REF Thus, only 3 percent of the population lives in states that have not had shutdown orders put in place. Although decisions have been made by state and sometimes local officials, the United States is effectively subject to a national lockdown order.
The Economic Effect on GDP
The following is a basic short-run analysis that necessarily abstracts from some of the differences between various state orders. Rather than rely on a long-run macroeconomic model, the analysis simply uses Bureau of Economic Analysis (BEA) data to illustrate the near-term cost of shutting down economic activity.
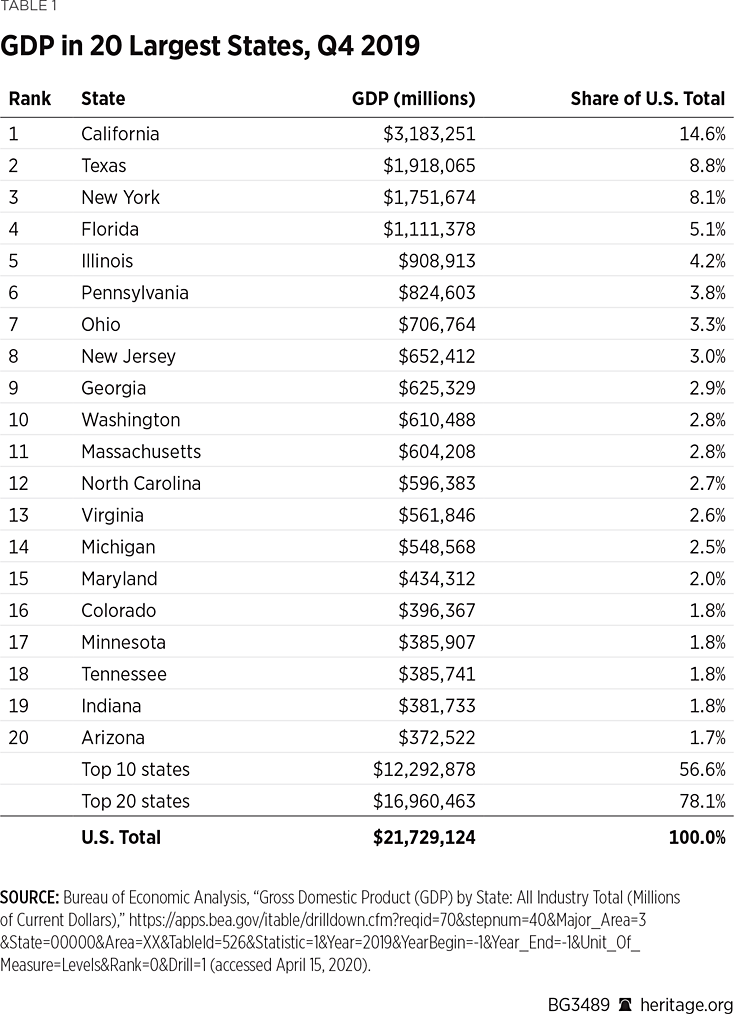
Gross domestic product (GDP) is the value of all of the final goods and services produced in a country or state. Table 1 shows the GDP of the 20 largest states.REF They account for 78 percent of U.S. GDP. The top 10 states account for 57 percent of GDP. They are all subject to lockdown orders.

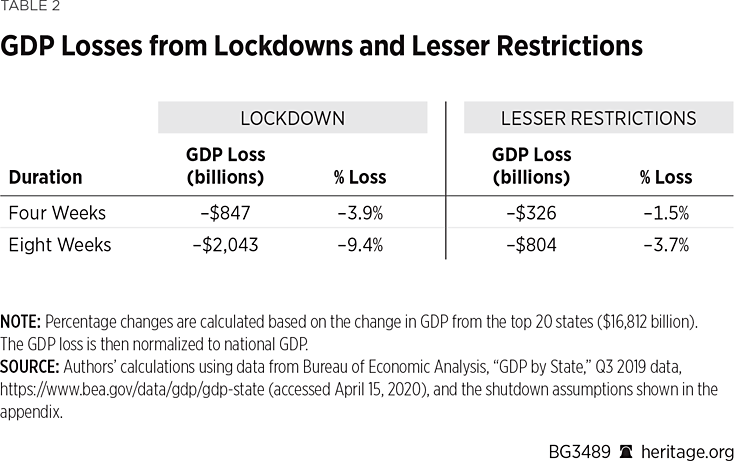
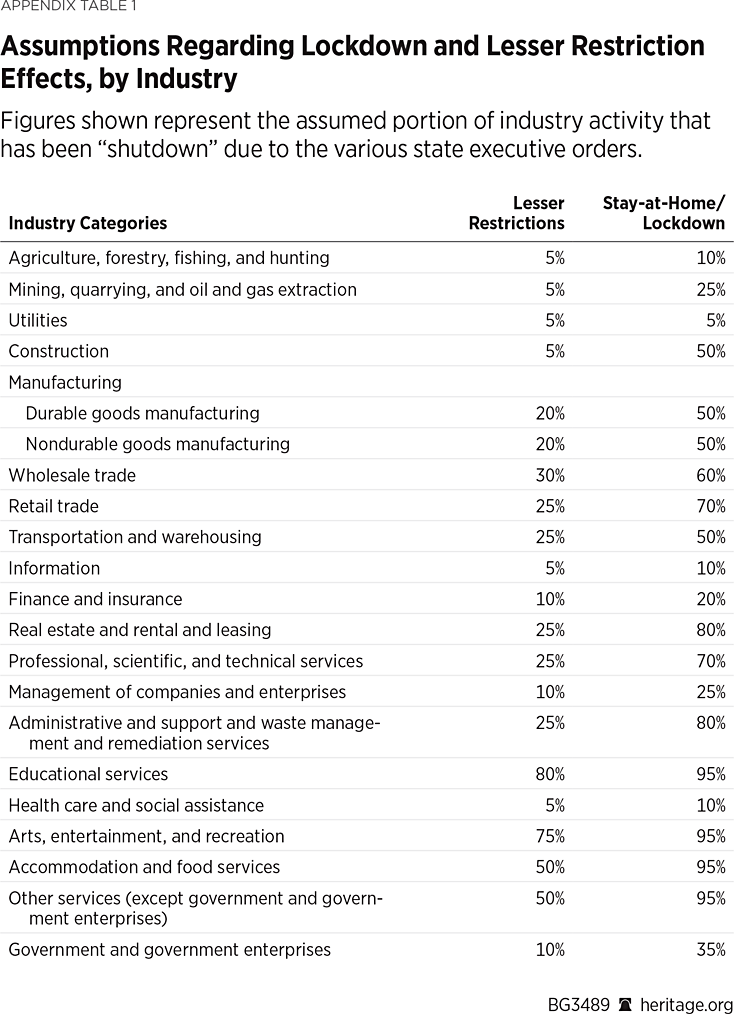
The numbers provided in Table 2 show the reduction in GDP associated with either four weeks or eight weeks of either lockdown orders or lesser restrictions. We assume that the composition of the economy in the largest 20 states that make up 78 percent of GDP is representative of the entire economy. Appendix Table 1 provides the full list of assumptions used for each industry, but the shutdown percentages range from a low of 5 percent for information-related industries to 95 percent for schools, arts, entertainment, recreation, accommodation, and food services.
Because there is no purely objective way to estimate the portion of each state’s industry that is “shut down,” we present two different sets of illustrations. The first assumes a “lesser restriction” scenario similar to many of the initial gubernatorial executive orders and those that are likely to be put back in place during the reopening of the economy. These orders closed large venues, entertainment establishments, dine-in restaurants, and the like. The second assumes a more severe shutdown similar to those currently in place in most of the country where all “non-essential” businesses are forced to shut down and people are required generally to stay at home.
Under both scenarios, the figures assume various shutdown percentages for a four-week period and an eight-week period, respectively, thus providing two ranges. It is unlikely that an eight-week shutdown will correspond to exactly twice the cost associated with a four-week shutdown. The effects are unlikely to be linear because business failures will accelerate as financial reserves are exhausted. We somewhat arbitrarily increased the eight-week cost figures by an additional 20 percent. A recent U.S. Chamber of Commerce poll of business owners indicated that 24 percent of businesses believe they will have to close permanently if the lockdowns last more than two months.REF The authors acknowledge that this exercise is extremely imprecise and invite readers to make their own assumptions utilizing the data set by means of an online calculator.REF
The numbers presented merely serve as an illustration to provide policymakers with an idea of the scope of economic costs involved in the current shutdowns. These illustrations are not predictions and do not account for the many economic and social factors that will undoubtedly affect the true total economic costs.
As the results on Table 2 show, the cost estimates for a four-week shutdown range from $326 billion for less restrictive orders to $847 billion for a more severe stay-at-home lockdown. These estimates represent a drop in annual GDP of between 1.5 percent and 3.9 percent. For an eight-week shutdown, the estimates range from a decline of $804 billion to $2.0 trillion (in percentage terms, a reduction in annual GDP from 3.7 percent to 9.4 percent). By way of comparison, the annual GDP decline from the third quarter of 2008 to the third quarter of 2009 during the Great Recession was 2.8 percent.REF

Naturally, these GDP figures should not be used as the sole metric of citizens’ welfare. Nonetheless, in terms of lost economic output, these costs should be expected to rise and be more difficult to predict the longer the shutdowns last. Moreover, it is unlikely that the economy will “snap back” immediately to the level before the crisis because reopening will take time; the behavior of consumers, workers, and firm management will no doubt change even absent legal requirements; and some firms will have failed.
A Snapshot of the Employment and Income Costs of the COVID-19 Shutdowns
Prior to the COVID-19 crisis, the U.S. economy exhibited very low unemployment, and a recession did not appear to be imminent. The crisis resulted in a dramatic change. For instance:
- The unemployment rate was only 3.5 percent in February and had been on a downward trend for nearly a full decade. However, for the week ending March 21, the number of initial unemployment insurance claims was 3.3 million, the highest level of seasonally adjusted initial claims ever recorded by the Bureau of Labor Statistics (BLS) and an increase of more than 3 million.REF
- Then, for the week ending March 28, seasonally adjusted initial unemployment insurance claims rose to 6.6 million, shattering the record set the previous week.REF
- For the week ending April 4, there were another 6.6 million seasonally adjusted initial unemployment compensation claims.REF
- For the week ending April 11, there were an additional 5.2 million seasonally adjusted initial unemployment compensation claims.REF
These changes indicate that the unemployment rate has risen to approximately 10.7 percent.REF The BLS has also reported that from February to March, employment declined by 3 million, from 158.8 million to 155.8 million, and the unemployment rate rose to 4.4 percent.REF One Federal Reserve economist estimates that the COVID-19 shutdowns could result in an unemployment rate that exceeds 30 percent.REF
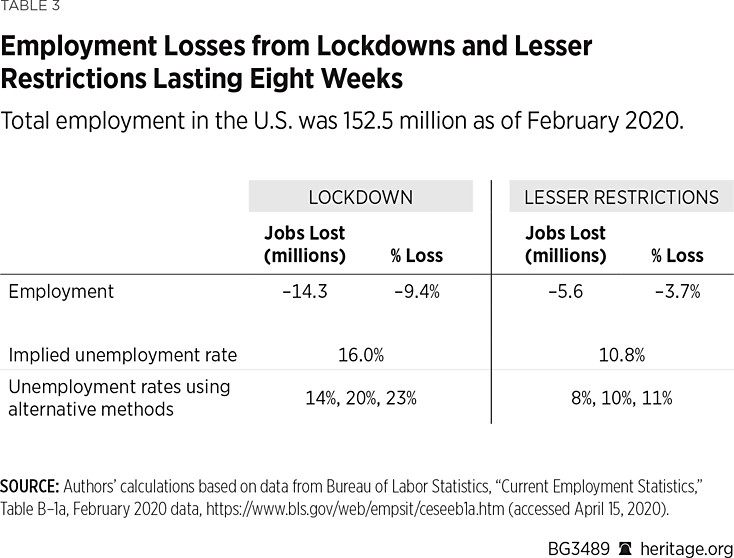
Table 3 provides estimated losses in employment and their corresponding unemployment rates based solely on the GDP reductions in Table 2. That is, we assume that the basic capital-to-labor ratio in the economy is unchanged over this short-run period and that a given percentage change in GDP will correspond to the same percentage change in employment.REF For an eight-week shutdown, the estimates range from a decline of 5.6 million to 14.3 million, corresponding to an unemployment rate that ranges from 10.8 percent to 16 percent.REF Given the fact that most states are on lockdown status, the lesser restrictions figure is an estimate of what would probably have happened with lesser restrictions.

Naturally, there are other ways to estimate the unemployment impact. For instance, a basic rule of thumb known as Okun’s law suggests that for every 1 percent drop in GDP, unemployment increases by approximately 2 percentage points.REF Applying this rule of thumb to the estimates in Table 2, the eight-week lockdown would result in an unemployment rate of about 23 percent. Similarly, examining the ratio of employment losses to GDP losses in the Great Recession implies unemployment rates of 14 percent to 20 percent after eight weeks of lockdown.REF
While these estimates illustrate the near-term impact that the shutdowns might have on national employment, other data made available by Homebase show that a pronounced change in the employment situation has already occurred for many smaller service-based companies. These data cover 60,000 businesses and 1 million hourly employees and capture mostly Main Street businesses consisting primarily of individually owned and operated shops in the restaurant, food and beverage, retail, and service sectors.
Homebase provides estimates of the effect that the COVID-19 crisis has had on Main Street businesses by calculating a rate of change for a given day after March 1 versus a given day in January.REF For instance, compared to the typical Sunday in January, the data show that hours worked by hourly employees decreased 17 percent for March 15.REF Similarly, compared to the typical Monday in January, hours worked by hourly employees decreased 60 percent for April 6.
This month-to-month comparison has shown a generally increasing trend throughout the second half of March and the beginning of April, reaching a maximum decline of 68 percent for April 4 and April 5. Using the same month-to-month comparison, the data show a similar trend in the number of local businesses open, with a 7 percent decline on March 15, a 45 percent drop for March 22, a 52 percent decrease on March 29, and a 54 percent decline for April 5. The Homebase data also show that there was a 12 percent decline in the number of hourly employees working for March 15, a 60 percent decline for March 22, a 66 percent decline for March 29, and a 67 percent drop for April 5.REF
The Homebase data also provide an estimate of what these employment declines and business closures mean in terms of lost income for employees of small businesses. For example, using the same month-to-month comparison as described previously (comparing to a typical day in January), the data show a $387 per worker loss of monthly income for March 15, a loss that rose to $1,559 per month for March 29 and $1,585 for April 5.REF On an industry basis, the Homebase data suggest that restaurant workers have been particularly hard hit, an unsurprising finding given the number of localities that have restricted restaurants to takeout and delivery.
The Homebase data also reveal a great deal of variation in losses across different states. For example, the data show that from February 24 to March 25, the aggregate monthly wage losses among these smaller establishments were $5.6 billion in California, $3.4 billion in New York, $291 million in Oklahoma, and $64 million in Wyoming.REF This is about 66.6 percent of monthly sales for California, 73.9 percent for New York, 44.0 percent for Oklahoma and 41.9 percent for Wyoming.REF
Responding to the Challenge Constructively
What we are experiencing is not a normal recession. Unemployment, business shutdowns or failures, and financial market declines are not a result of imbalances in the economy, changes in monetary policy, or external shocks to the demand for or supply of goods and services. They are the result of deliberate government decisions to shut down the economy.
Some of the policy responses to the economic distress have been highly constructive. Policies designed to address public health objectives, facilitate business continuity, and promote continued employee attachment to employers are constructive. These would include tax credits for paid leave for those who have contracted COVID-19 or are caring for those with the disease and payroll support mechanisms such as the forgiveness provisions in the enhanced Section 7(a) loan program.REF Others, unless changed, will exacerbate the duration and severity of the downturn. These would include unemployment insurance benefits that are higher than or nearly as high as workers’ wages.REF
As public health officials gain a better understanding of the virus and increasingly large numbers of people recover and therefore have virus antibodies protecting them from infection, the U.S. will be able to shift to a more targeted approach of mitigating the impact of the virus. As less severe restrictions are implemented, the employment situation can be expected to recover somewhat rapidly. This recovery will be hampered, however, unless unemployment compensation benefits are modified so that people have a continuing connection to their employers and a financial incentive to work.REF These policies run the risk of prolonging any economic downturn and making it more difficult for people to obtain the goods and services they need or want.
If, however, widespread shutdowns extend for much more than a few more weeks, it is reasonable to expect the employment situation to worsen. In an increasingly large number of cases, employers will fail and people will not have jobs to which they can return.
Conclusion
Although the shutdowns analyzed in this paper are a function of state and local executive orders, the United States is effectively subject to a national lockdown order. States representing 95 percent of the economy are subject to statewide shutdown orders. These orders have been motivated by legitimate public health concerns.
Lockdown orders lasting eight weeks could reduce economic output by as much as $2 trillion (about 9 percent). Under an eight-week shutdown, employment is likely to decline by around 9.5 percent. The unemployment rate is likely to reach 16 percent and may reach as high as 23 percent. Less restrictive orders will have substantially less impact. A longer shutdown would have a substantially greater adverse impact. The economic losses from shutdown orders accelerate over time because employers exhaust their financial reserves and fail. Workers will not have jobs to which they can return.
Policymakers need to consider these costs and the public health costs of severe economic reverses when determining the breadth and duration of public health–motivated shutdown orders or lesser restrictions.
Norbert J. Michel, PhD, is Director of the Center for Data Analysis, of the Institute for Economic Freedom, at The Heritage Foundation. David R. Burton is Senior Fellow in Economic Policy in the Thomas A. Roe for Economic Policy Studies, of the Institute for Economic Freedom.
Appendix
Assumptions for results in Table 2: The respective percentages used under the lesser restrictions and lockdown scenarios are uniform across all states in the analysis.


