Abstract: For decades, the U.S. Census Bureau has reported that over 30 million Americans were living in “poverty,” but the bureau’s definition of poverty differs widely from that held by most Americans. In fact, other government surveys show that most of the persons whom the government defines as “in poverty” are not poor in any ordinary sense of the term. The overwhelming majority of the poor have air conditioning, cable TV, and a host of other modern amenities. They are well housed, have an adequate and reasonably steady supply of food, and have met their other basic needs, including medical care. Some poor Americans do experience significant hardships, including temporary food shortages or inadequate housing, but these individuals are a minority within the overall poverty population. Poverty remains an issue of serious social concern, but accurate information about that problem is essential in crafting wise public policy. Exaggeration and misinformation about poverty obscure the nature, extent, and causes of real material deprivation, thereby hampering the development of well-targeted, effective programs to reduce the problem.
Each year for the past two decades, the U.S. Census Bureau has reported that over 30 million Americans were living in “poverty.” In recent years, the Census has reported that one in seven Americans are poor. But what does it mean to be “poor” in America? How poor are America’s poor?
For most Americans, the word “poverty” suggests destitution: an inability to provide a family with nutritious food, clothing, and reasonable shelter. For example, the Poverty Pulse poll taken by the Catholic Campaign for Human Development asked the general public: “How would you describe being poor in the U.S.?” The overwhelming majority of responses focused on homelessness, hunger or not being able to eat properly, and not being able to meet basic needs.[1] That perception is bolstered by news stories about poverty that routinely feature homelessness and hunger.
Yet if poverty means lacking nutritious food, adequate warm housing, and clothing for a family, relatively few of the more than 30 million people identified as being “in poverty” by the Census Bureau could be characterized as poor.[2] While material hardship definitely exists in the United States, it is restricted in scope and severity. The average poor person, as defined by the government, has a living standard far higher than the public imagines.
As scholar James Q. Wilson has stated, “The poorest Americans today live a better life than all but the richest persons a hundred years ago.”[3] In 2005, the typical household defined as poor by the government had a car and air conditioning. For entertainment, the household had two color televisions, cable or satellite TV, a DVD player, and a VCR. If there were children, especially boys, in the home, the family had a game system, such as an Xbox or a PlayStation.[4] In the kitchen, the household had a refrigerator, an oven and stove, and a microwave. Other household conveniences included a clothes washer, clothes dryer, ceiling fans, a cordless phone, and a coffee maker.
The home of the typical poor family was not overcrowded and was in good repair. In fact, the typical poor American had more living space than the average European. The typical poor American family was also able to obtain medical care when needed. By its own report, the typical family was not hungry and had sufficient funds during the past year to meet all essential needs.
Poor families certainly struggle to make ends meet, but in most cases, they are struggling to pay for air conditioning and the cable TV bill as well as to put food on the table. Their living standards are far different from the images of dire deprivation promoted by activists and the mainstream media.
Regrettably, annual Census reports not only exaggerate current poverty, but also suggest that the number of poor persons[5] and their living conditions have remained virtually unchanged for four decades or more. In reality, the living conditions of poor Americans have shown significant improvement over time.
Consumer items that were luxuries or significant purchases for the middle class a few decades ago have become commonplace in poor households. In part, this is caused by a normal downward trend in price following the introduction of a new product. Initially, new products tend to be expensive and available only to the affluent. Over time, prices fall sharply, and the product saturates the entire population, including poor households.
As a rule of thumb, poor households tend to obtain modern conveniences about a dozen years after the middle class. Today, most poor families have conveniences that were unaffordable to the middle class not too long ago.
Poverty: A Range of Living Conditions
However, there is a range of living conditions within the poverty population. The average poor family does not represent every poor family. Although most poor families are well housed, a small minority are homeless.
Fortunately, the number of homeless Americans has not increased during the current recession.[6] Although most poor families are well fed and have a fairly stable food supply, a sizeable minority experiences temporary restraints in food supply at various times during the year. The number of families experiencing such temporary food shortages has increased somewhat during the current economic downturn.
Of course, to the families experiencing these problems, their comparative infrequency is irrelevant. To a family that has lost its home and is living in a homeless shelter, the fact that only 0.5 percent of families shared this experience in 2009 is no comfort. The distress and fear for the future that the family experiences are real and devastating. Public policy must deal with that distress. However, accurate information about the extent and severity of social problems is imperative for the development of effective public policy.
In discussions about poverty, however, misunderstanding and exaggeration are commonplace. Over the long term, exaggeration has the potential to promote a substantial misallocation of limited resources for a government that is facing massive future deficits. In addition, exaggeration and misinformation obscure the nature, extent, and causes of real material deprivation, thereby hampering the development of well-targeted, effective programs to reduce the problem. Poverty is an issue of serious social concern, and accurate information about that problem is always essential in crafting public policy.
Living Conditions of the Poor
Each year, the U.S. Census Bureau releases its annual report on income and poverty.[7] This report, though widely publicized by the press, provides only a bare count of the number of Americans who are allegedly poor. It provides no data on or description of their actual living conditions.
This does not mean that such information is not available. The federal government conducts several other surveys that provide detailed information on the living conditions of the poor. These surveys provide a very different sense of American poverty.[8] They reveal that the actual standard of living among America’s poor is far higher than the public imagines and that, in fact, most of the persons whom the government defines as “in poverty” are not poor in any ordinary sense of the term. Regrettably, these detailed surveys are almost never reported in the mainstream press.
One of the most interesting surveys that measures actual living conditions is the Residential Energy Consumption Survey (RECS),[9] which the Department of Energy has conducted regularly since 1980.[10] The RECS survey measures energy consumption and ownership of various conveniences by U.S. households. It also provides information on households at different income levels, including poor households.
The first half of this paper uses RECS data to analyze and describe one aspect of the living standards of the poor: ownership and availability of household amenities.[11] The second half provides a broader description of the living standards of America’s poor.
Availability of Amenities in Poor Households
This section uses RECS data from 2005, the most recent year for which data are available, to analyze the amenities typically found in poor households.[12] The 2005 RECS data represent the living conditions of the poor before the current recession. Conditions are likely quite similar today.
Because the current recession has increased the number of poor persons in the U.S. since 2005, it might seem likely that poor households would have fewer amenities and conveniences today than in 2005. However, the increase in poverty during the recession is, to a considerable degree, the result of working-class families losing employment. One would not expect these families to dispose of their normal household conveniences in those circumstances. Thus, paradoxically, the increase in the number of working- and middle-class families who have become temporarily poor is likely to increase slightly the share of poor households that own various items. When the present recession ends, the living conditions of the poor are likely to continue to improve as they have in the past.
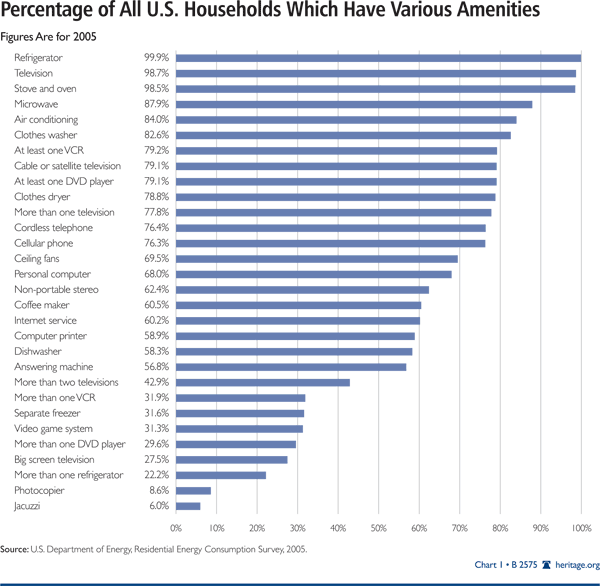
Chart 1 shows the percentage of all U.S. households that owned or had available various household amenities and conveniences in 2005. For example, it shows that 84 percent of all U.S. households had air conditioning, 79 percent had cable or satellite television, and 68 percent had a personal computer.[13]
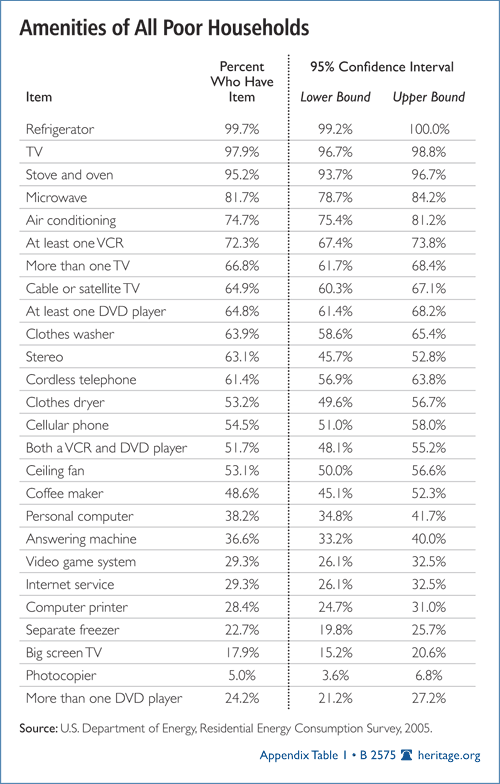
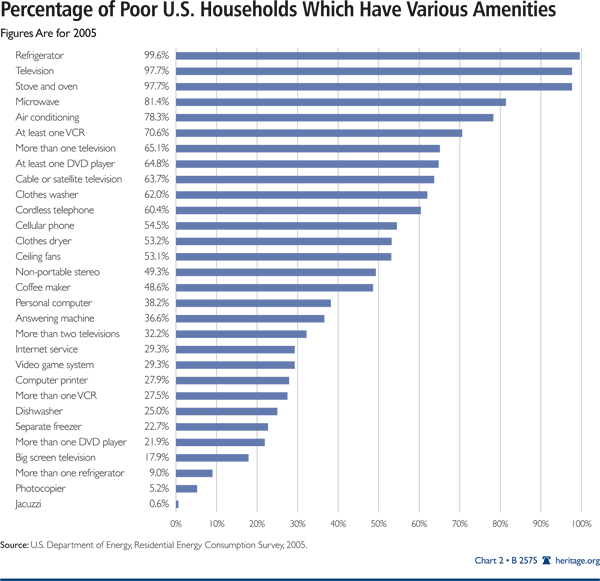
Chart 2 shows the same information for 2005 for poor U.S. households (those with cash incomes below the official poverty thresholds). While poor households were slightly less likely to have conveniences than the general population, most poor households had a wide range of amenities. As Chart 2 shows, 78 percent of poor households had air conditioning, 64 percent had cable or satellite TV, and 38 percent had a personal computer.[14]
The Household Amenity Scale. Living conditions can be analyzed by creating a household amenity scale based on the 30 items listed in Chart 1. The RECS database reports which households have each specific amenity. For each affirmative response that a household has a particular amenity, we gave the household one point. All the affirmative responses of the household were then summed to produce an overall amenity score for the household.
Thus, a household’s amenity score can range from 0 to 30. A household that responded negatively to all 30 items would have an amenity score of zero, a household that responded affirmatively to half the items would have an amenity score of 15, and a household that answered affirmatively to all 30 items would have a score of 30. The amenity score of a household is roughly equal to the number of amenities present in the household.[15]
Chart 3 provides the cumulative distribution of amenity scores for all U.S. households in 2005, showing the percentage of all households with an amenity score at or below each specified level. The median amenity score for all households is 19. This means that half of all households had a score at or below 19 and half of households had a score at or above 19.[16]
Having determined the median amenity score, we then examined every household with that score to determine which amenities appeared most frequently within the median group.
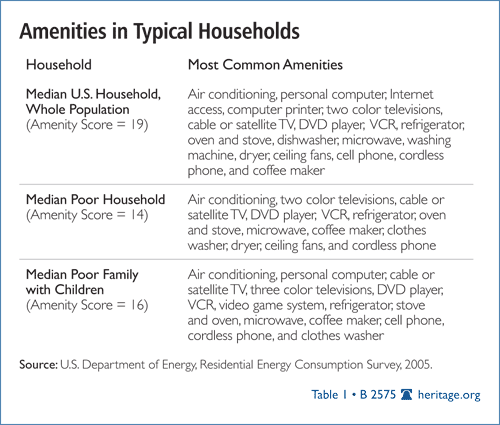
- The analysis showed that households with the median amenity score most frequently had the following 19 items: air conditioning, a personal computer, Internet access, a computer printer, a ceiling fan, a cell phone or phones, a cordless phone, and a coffee maker.
- For entertainment, these households had two color televisions, cable or satellite TV, a DVD player, and a VCR.
- In the kitchen, the households had a refrigerator, an oven and stove, an automatic dishwasher, and a microwave.
- In the laundry, they had a washing machine and dryer.
These amenities may then be considered representative of the living standards of the median or typical U.S. household in 2005.
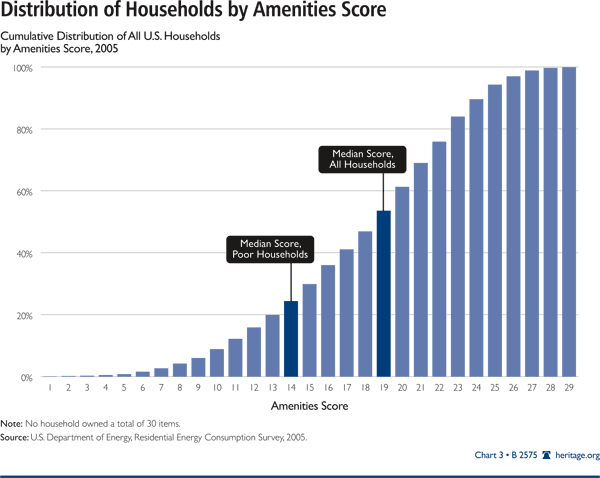
Amenities in the Median Poor Household. We then examined poor households, meaning households with a reported income below the official government poverty income thresholds in 2005. Analysis revealed that poor households had a median household amenity score of 14. This means that half of all poor households had a score at or below 14 and half of households had score at or above 14.
Having determined that the amenity score of the median poor household was 14, we then examined all poor households with that score to determine which amenities appeared most frequently within the median poor group.
- The analysis showed that median poor households most frequently had the following 14 items: air conditioning, a clothes washer, a clothes dryer, ceiling fans, and a cordless phone.
- For entertainment, these households had two color televisions, cable or satellite TV, a DVD player, and a VCR.
- In the kitchen, these poor households had a refrigerator, an oven and stove, a microwave, and a coffee maker.
These items may then be considered representative of the living standards of the median or typical poor U.S. household in 2005.
The median poor household had five fewer amenities than the median household in the general population. Specifically, the typical poor household lacked the following items that were in the typical middle-income household: a personal computer, Internet access, a computer printer, a dishwasher, and a cell phone.
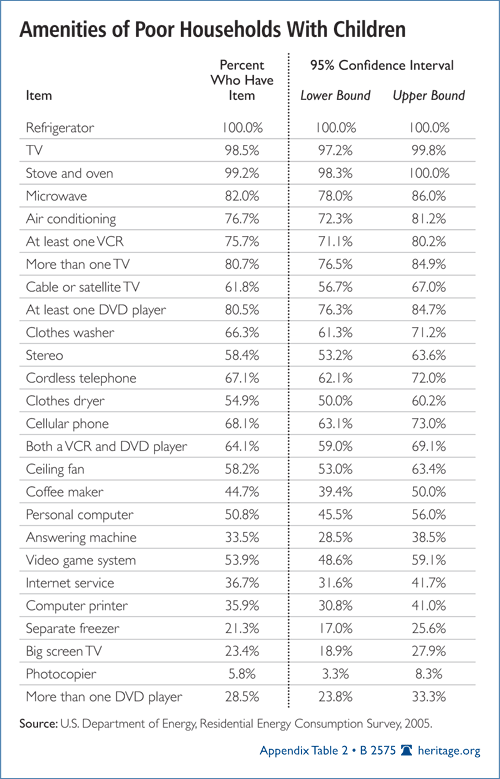
Amenities in Poor Families with Children. Poor families with children have more conveniences and amenities than other poor families. In 2005, the median amenity score for poor families with children was 16. We examined all poor families with children with an amenity score of 16 to determine which items appeared most frequently in these homes.
- These homes typically had both air conditioning and a personal computer.
- For entertainment, they typically had cable or satellite TV, three color televisions, a DVD player, a VCR, and a video game system, such as an Xbox or Play Station.
- In the kitchen, they had a refrigerator, a stove and oven, a microwave, and an automatic coffee maker.
- Other amenities included a cell phone, a cordless phone, and a clothes washer.[17]
These conveniences may be considered representative of the living standards of the median or typical poor family with children in 2005.
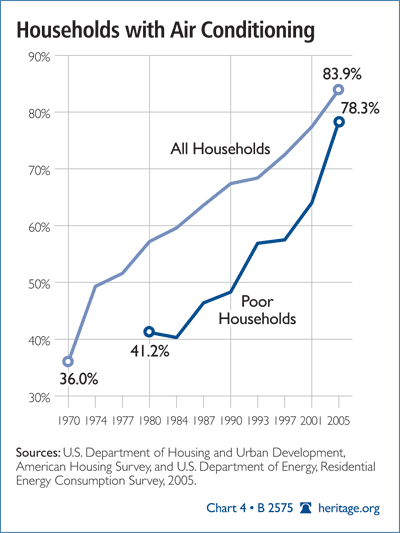
Improvement in Poor Households over Time. Because the RECS has reported on the living conditions of the poor for several decades, it is a useful tool for charting the improvement in living conditions among the poor over time. For example, Chart 4 shows the percentage of all households and the percentage of poor households that had any type of air conditioning between 1970 and 2005.[18] Although poor households were less likely to have air conditioning in any given year, the share of households with air conditioning increased steadily for both groups over the 25-year period. By 2005, the two rates converged as air conditioning became nearly universal in U.S. society.
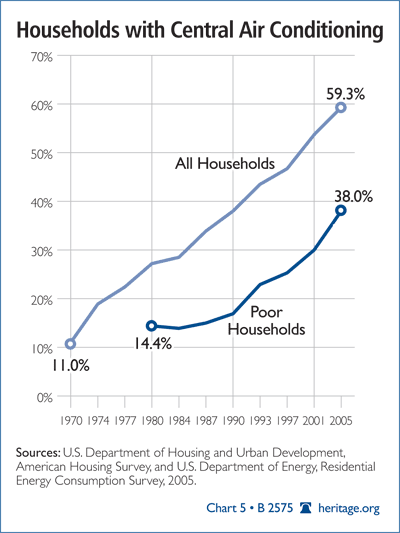
Chart 5 shows the percentage of all households and the percentage of poor households that had central air conditioning between 1970 and 2005. Because central air conditioning is more expensive than window units, it is less common in U.S. society. Nonetheless, the share of the general population and the share of poor households with central air conditioning have increased at a similar pace for the past 25 years.
Finally, Chart 6 shows the share of all households and the share of poor households that had a personal computer from 1990 to 2005. Personal computers were rare in 1990 but spread widely through society over the next 15 years. Computer ownership among the poor increased substantially during the period. In 1990, only 5 percent of poor households had a computer. By 2005, the number had risen to almost 40 percent.
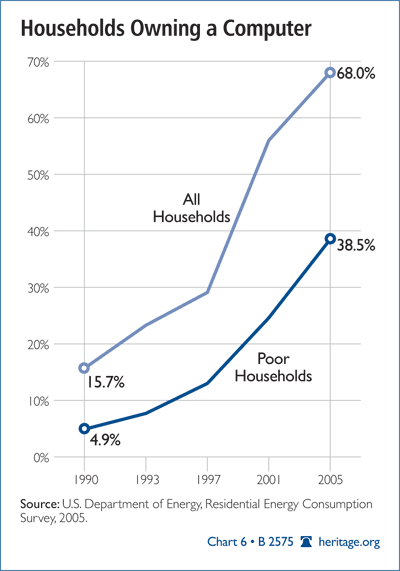
Charts 4, 5, and 6 show a common pattern. The share of poor households that have a given amenity tends to equal the share of all U.S. households that had the same amenity 10 to 15 years earlier. There seems to be a general lag effect in which poor households acquire a given amenity roughly a dozen years after the general population acquires it.
Housing and Poverty
Of course, the typical poor family could have a host of modern conveniences and still live in dilapidated, overcrowded housing. However, data from other government surveys show that this is not the case.[19] Poor Americans are well housed and rarely overcrowded.[20] In fact, the houses and apartments of America’s poor are quite spacious by international standards. The typical poor American has considerably more living space than does the average European.[21]
Forty-three percent of all poor households own their own homes. The average home owned by persons classified as poor by the Census Bureau is a three-bedroom house with one-and-a-half baths, a garage, and a porch or patio.[22]
Nearly all of the houses and apartments of the poor are in good condition. According to the government’s data, only one in 10 has moderate physical problems. Only 2 percent of poor domiciles have “severe” physical problems, the most common of which is sharing a bathroom with another household living in the building.[23]
Food Shortages, Nutrition, and Poverty
It is possible that most poor households could be well housed and have many modern conveniences but still face chronic food shortages and undernutrition. Poor families might have microwaves but a limited and sporadic supply of food to put in the microwave. Government surveys show that this is not the case for the overwhelming majority of poor families.
On average, the poor are well nourished. The average consumption of protein, vitamins, and minerals is virtually the same for poor and middle-class children. In most cases, it is well above recommended norms. Poor children actually consume more meat than higher-income children consume, and their protein intake averages 100 percent above recommended levels. In fact, most poor children are super-nourished and grow up to be, on average, one inch taller and 10 pounds heavier than the GIs who stormed the beaches of Normandy in World War II.[24]
However, even though the poor, in general, have an ample food supply, some do suffer from temporary food shortages. For example, a poor household with an adequate long-term food supply might need temporarily to cut back meals, eat cheap food, or go without if cash and food stamps run out at the end of the month.
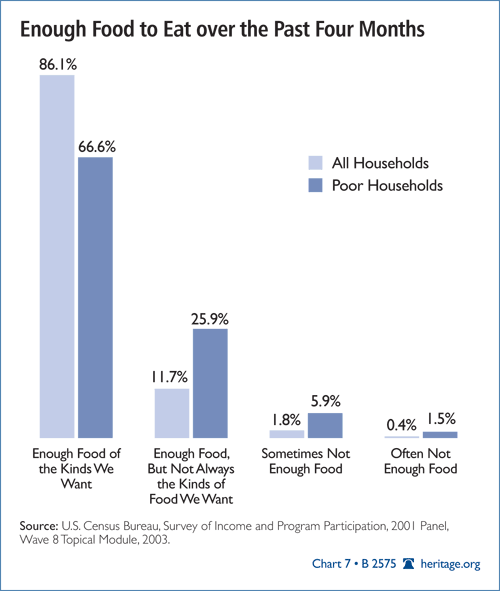
Still, government data show that most poor households do not suffer even from temporary food shortages. As Chart 7 shows, 92.5 percent of poor households assert that they always had “enough food to eat” during the previous four months, although 26 percent of these did not always have the foods that they would have preferred. Some 6 percent of poor households state that they “sometimes” did not have enough food, and 1.5 percent say they “often” did not have enough food.[25]
The bottom line is that, although a small portion of poor households report temporary food shortages, the overwhelming majority of poor households report that they consistently have enough food to eat.
Temporary food shortages have increased during the current recession but still remain atypical among poor households. During 2009, less than one poor household in five experienced even a single instance of “reduced food intake and disrupted eating patterns” due to a lack of financial resources.[26] Strikingly, only 4 percent of poor children experienced even a single instance of “reduced food intake and disrupted eating patterns” due to a lack of financial resources.[27]
Food Banks and Soup Kitchens
TV news stories that inform audiences that one in seven Americans are poor routinely depict “the poor” collecting free groceries at a food pantry or eating meals at a free food kitchen.[28] The audience is led to conclude that gathering free food from a charity pantry or eating free meals at a soup kitchen is the norm for those in poverty.
In fact, while the use of food pantries and emergency kitchens has increased during the current recession,[29] poor families generally did not use charity food pantries or soup kitchens. The U.S. Department of Agriculture (USDA) reports that only one poor family in five took food from a food pantry even once during all of 2009. Far fewer ate at a food kitchen.
In the whole U.S. population, 5.6 million households (4.8 percent of all households) used a food pantry at any point during 2009. Far fewer ate meals at a soup kitchen. Only 625,000 of all U.S. households (0.5 percent) had a member who ate a meal in a free-food kitchen at any time in 2009.[30]
Poverty and Homelessness
The mainstream press and activist groups also frequently conflate poverty with homelessness. News stories about poverty often feature homeless families living “on the street.”[31] This depiction is seriously misleading because only a small portion of persons “living in poverty” will become homeless over the course of a year. The overwhelming majority of the poor reside throughout the year in non-crowded housing that is in good repair.
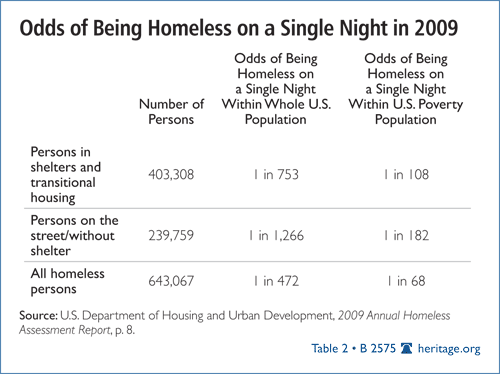
The 2009 Annual Homeless Assessment Report published by the U.S. Department of Housing and Urban Development (HUD) states that on a given night in 2009, some 643,000 persons in the U.S. were homeless (without permanent domicile).[32] This means that at any given time, one out of 470 persons in the general population or one out of 70 persons with incomes below the poverty level was homeless.[33]
Moreover, two-thirds of these 643,000 homeless persons were residing in emergency shelters or transitional housing. Only 240,000 were without shelter. These “unsheltered” individuals were “on the street,” meaning that they were living in cars, abandoned buildings, alleyways, or parks. At any point in 2009, roughly one person out of 1,250 in the general population or one out of 180 poor persons was homeless in the literal sense of being on the street and without shelter.
Homelessness is usually a transitional condition. Individuals typically lose housing, reside in an emergency shelter for a few weeks or months, and then reenter permanent housing. The transitional nature of homelessness means that many more people become temporarily homeless over the course of a year than are homeless at any single point in time.
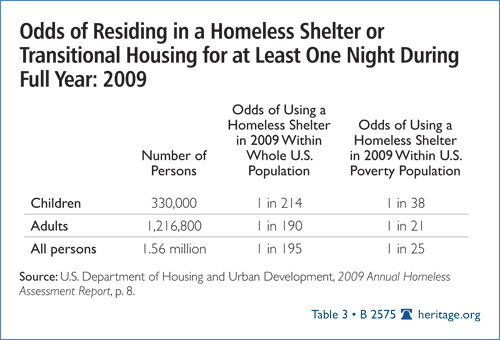
Thus, HUD reports that 1.56 million persons resided in an emergency shelter or transitional housing at least one night during 2009.[34] The year-round total of individuals who ever stayed in a shelter or transitional housing was nearly four times larger than the 403,000 who resided in such facilities on an average night.[35]
Based on the year-round data on shelter use, roughly one person in 195 in the general population resided in emergency shelter or transitional housing for at least one night during a full 12-month period. Roughly one in 25 poor persons (4 percent of all poor persons) resided in an emergency shelter or transitional housing for at least one night during the full year.[36]
Despite news stories that assert that the current recession has caused a great increase in homelessness, homeless shelter use, in general, has not increased during the current economic downturn.[37] In addition, shelters are not overcrowded. On a typical night, shelters have an average vacancy rate of 10 percent.[38]
While the overall number of homeless has not increased during the current recession, there has been a small increase in the number of families with children who use homeless shelters. Some 168,000 families with children resided in a homeless shelter for at least one night during all of 2010.[39] This figure was up from 130,000 in 2007. The increase of 38,000 families represents only one family out every 1,000 families with children. While the misfortune is real for the families involved, these numbers scarcely show a tidal wave of increased homelessness.
Although news stories often suggest that poverty and homelessness are similar, this is inaccurate. In reality, the gap between the living conditions of a homeless person and the typical poor household is proportionately as great as the gap between the poor household and a middle-class family in the suburbs.
Essential Needs
Although the public equates poverty with physical deprivation, the overwhelming majority of poor households do not experience any form of physical deprivation. Some 70 percent of poor households report that during the course of the past year, they were able to meet “all essential expenses,” including mortgage, rent, utility bills, and important medical care.
It is widely supposed that the poor are unable to obtain medical care, but in reality, only 13 percent of poor households report that a family member needed to go to a doctor or hospital at some point in the prior year but was unable because the family could not afford the cost.[40]
Public Understanding of Poverty
In 2005, the typical poor household, as defined by the government, had air conditioning and a car.[41] For entertainment, the household had two color televisions, cable or satellite TV, a DVD player, and a VCR. In the kitchen, it had a refrigerator, an oven and stove, and a microwave. Other household conveniences included a clothes washer, clothes dryer, ceiling fans, a cordless phone, and a coffee maker. The family was able to obtain medical care when needed. Their home was not overcrowded and was in good repair. By its own report, the family was not hungry and had sufficient funds during the past year to meet all essential needs.
The overwhelming majority of the public do not regard a family living in these conditions as poor. For example, a poll conducted in June 2009 asked a nationally representative sample of the public whether they agreed or disagreed with the following statement: “A family in the U.S. that has a decent, un-crowded house or apartment to live in, ample food to eat, access to medical care, a car, cable television, air conditioning and a microwave at home should not be considered poor.”[42]
A full 80 percent of Republicans and 77 percent of Democrats agreed that a family living in those living conditions should not be considered poor.
Census Poverty Reports Are Misleading and Inaccurate
Nonetheless, each year, the U.S. Census Bureau issues a report claiming that over 35 million Americans live in poverty. The annual Census poverty report is flawed in two respects.
First, the report provides no information on the actual living conditions of the persons identified as poor. It simply states that a specified number of persons are poor without giving any information on what poverty means in the real world. A detailed description of the living conditions of the poor would greatly enhance public understanding. In fact, without a detailed description of living conditions, public discussions of poverty are meaningless.
Second, the Census report massively undercounts the economic resources provided to poor people. The Census asserts that a household is poor if its “money income” falls below a specified threshold. In 2009, the poverty income threshold for a family of four was $21,756. However, in counting the money income of households, the Census ignores virtually the entire welfare state. For example, there are over 70 means-tested welfare programs that provide cash, food, housing, medical care, and social services to poor and low-income persons. Major means-tested welfare programs include Temporary Assistance for Needy Families; Supplemental Security Income; the Earned Income Tax Credit; food stamps; the Women, Infants, and Children food program; public housing; and Medicaid. (Social Security and Medicare are not means-tested welfare programs.)
In 2008, federal and state governments spent $714 billion on means-tested welfare programs, but the Census counted only about 4 percent of this as “money income” for purposes of determining whether a household was poor. The bottom line is that the economic resources available to poor persons are vastly greater than the Census claims.
In fact, the U.S. Department of Labor finds that the lowest-income one-fifth of households appear to spend $1.87 for every $1.00 of income that the Census says these households have. If the free medical care and public housing subsidies given to these households were counted, then the gap between expenditure and income would be even greater.[43]
Misrepresenting Poverty in America
As noted, for the average American, the word “poverty” implies significant material hardship and deprivation. Politicians, activists, and the mainstream media reinforce this image, asserting that each year, over 35 million Americans live in chronic material deprivation, unable to obtain “the basic material necessities of life.”
For example, former Senator and Vice Presidential candidate John Edwards made poverty the centerpiece of his repeated campaigns for the presidency. Edwards proclaimed that 37 million Americans “struggle with incredible poverty.”[44] He explicitly equated poverty as defined by the Census Bureau with dramatic unfulfilled material need. According to Edwards, America’s poor, who number “one in eight of us…do not have enough money for the food, shelter, and clothing they need.” The poor, he said, were forced to live in “terrible” circumstances.[45]
In Edwards’s stump speeches, the “plague of poverty”[46] in America was typified by a 10-year-old girl who lacked food and clothing. Edwards proclaimed, “Tonight, a 10-year-old little girl will go to bed hungry, hoping and praying that tomorrow will not be as cold as today because she doesn’t have the coat to keep her warm.”[47] Confronted by skeptics, Edwards’s staff ultimately admitted that the girl was “metaphorical,”[48] but Edwards continued to feature her in speech after speech.
Liberal advocacy groups routinely echo Edwards’s claims. For example, the Children’s Defense Fund equates government-defined poverty with daily hardship and suffering. CDF President Marian Wright Edelman states, “It is a moral outrage that in the wealthiest nation on earth there are still 12.8 million children living in poverty” and “inexcusable that 12.8 million children are forced to suffer through hardship every day.”[49]
In a campaign to promote higher welfare spending, Catholic Charities USA tells the public that the government-defined poor lack the basic material necessities of life:
We speak of [the United States] being the land of plenty: a country with living standards so high that others wish to emulate our success. But for nearly 37 million Americans there is another story. What is life like in this other America? How can it be that millions of us lack the basic material necessities of life?[50]
Advocacy groups often equate official poverty with hunger, malnutrition, and homelessness. When asked what it means for children to live in official U.S. poverty, Marion Wright Edelman informed TV audiences that official child poverty means “hopelessness for too many, it means homelessness; it means being hungry.”[51] The activist Web site Spotlight on Poverty asserts, “An increasing number of Americans face poverty and, as a result, hunger.… In all, 15 percent of American households…did not have the resources to obtain adequate nutrition and lead a healthy lifestyle.”[52]
Confusing Poverty and Deprivation
Protestations by anti-poverty activists almost always involve two incompatible ideas: that poverty in America is widespread, affecting as many as one in seven Americans, and that being poor in this country means serious material deprivation. The fusion of these two notions leads to a profound misrepresentation of the actual living conditions in the nation.
For example, confusion of this sort can be found in Just Generosity: A New Vision for Overcoming Poverty in America by evangelical Ronald J. Sider.[53] Sider begins his book with a chapter entitled “What Does Poverty Look Like?” in which he informs his readers, “In 2005, in the United States, 37 million people lived in poverty in the richest society in human history.” He asks, “Who are the poor? Where do they live?”[54] and proceeds to answer these questions with a lengthy description of the home of Mrs. Onita Skyles, a 68-year-old widow:
The foundation was collapsing. Sections of the floor had rotted. The walls and ceiling were cracked. The tub and toilet had sunk below the floor level and were unusable, and there was no running water. Mrs. Styles cooked with a hot plate and carried water in gallon jugs from a neighbor’s house.[55]
He then describes the shack where the Perez family lives: “The walls are old doors, tar paper, chicken wire, and rotting boards. The ground provides a dirt floor. There is no bathroom, no running water, no electricity, no heat. Their toilet is a reeking outhouse across the street.”[56]
The descriptions of these two individual households are indeed appalling, but Sider is seriously misleading when he implies that such living conditions are representative of 37 million poor people.[57] In fact, the situations he presents are not at all representative of the poor in America. The described conditions are very unusual and probably found in no more than one in 500 households.[58]
Confronted with this fact, activists usually respond that the exact numbers are irrelevant because no American should live in such deplorable conditions. This may be true, but when formulating effective public policy, it matters a great deal whether one in seven households or one in 500 households live in such conditions.
However, if the goal is greater income redistribution—rather than policies that precisely and effectively target those truly in need—then big numbers matter a lot. Liberal activists continue to insist that very large numbers of Americans live in severe deprivation.
This is no accident. The interlocking assertions that poverty is widespread, affecting one in seven Americans, and that the poor live in desperate conditions are both ideologically necessary for the Left. Together, they provide justification for policies to greatly expand the welfare state and further “spread the wealth.” But if one or both assertions proves to be untrue, the impetus for expanding the welfare state is greatly undermined.
Depictions of Poverty in the News Media
Mainstream news media also present poverty in America as severe material hardship. For example:
- A CBS News story on the “faces of poverty” features a mother living with five small children in a “27 square foot camper” beside the railroad tracks.[59]
- An NBC News story on “poverty in America” depicts the poor as homeless or feeding themselves from food pantries.[60]
- An ABC News story represents poverty as families who are homeless or living with empty refrigerators.[61]
- A moving ABC News story on poverty in Appalachia focuses on a 12-year-old girl whose single mother is a drug-addicted high school dropout. The girl lives in a tiny house with 11 other people, with no car and limited food.[62]
- Another network news story features an unemployed couple living in a tent in Reno, Nevada.[63]
The families in these stories are real. Their suffering is real and a cause for serious concern. But such families are clearly atypical of America’s poor. To the extent that the networks suggest that the living standards of these families are representative of the living conditions of 35 million poor people across the nation, they are profoundly misleading viewers.
The ongoing use of examples of severe hardship in TV news should not be surprising. TV news thrives on drama, and reporters naturally seek out the starkest and most sympathetic examples of poverty to build the most compelling stories. By contrast, a realistic portrayal of the living conditions of the typical poor family in America would not make compelling viewing. In fact, the audience would be unlikely to regard such a family as seriously deprived.
While substantial hardship does occur in U.S society, it is limited in scope. At any given time, only a small portion of the more than 35 million “poor” Americans will experience the sort of dramatic deprivation presented in the above newscasts. Moreover, when dramatic hardship does occur, it is generally temporary or caused by multiple behavioral problems in the home.
Ironically, suggesting that tens of millions of poor Americans suffer from chronic substantial deprivation actually makes solving social problems more difficult. Such misrepresentation leads to a misallocation of resources and, by obscuring the causes of deprivation, impedes the development of effective countermeasures.
Official Government Poverty Numbers Misrepresent U.S. Around the Globe
One of the most regrettable aspects of official U.S. government poverty statistics is the misleading negative image that they project around the world. U.S. government poverty numbers are like a Potemkin village in reverse, suggesting to the rest of the globe that living conditions in the U.S. are much worse than they actually are.
For example, Al Jazeera uses U.S. government poverty numbers to tell the world what a terrible place the U.S. is. Al Jazeera tells a global audience: “37 million people—that is one in eight Americans—live below the official poverty line. That means these people are often homeless, hungry, and have no health insurance.”[64] Al Jazeera shows a representative poor American family: six people living in a one-bedroom apartment.[65] Other stories go farther. An Al Jazeera special report on “poverty in America” shows America’s poor as homeless or living in rat-infested, crumbling shacks while suffering from life-threatening malnutrition.[66]
Al Jazeera is not alone. The Teheran Times informs its readers:
According to the U.S. Census Bureau, an astonishing 47 million Americans out of a population of about 310 million live in poverty in the Unites [sic] States, a number equivalent to one out of every seven people…. [O]ne in five children in the United States live in poverty, with almost half of them living in extreme poverty. [67]
Similarly, the Chinese government uses the U.S. Census Bureau’s misleading poverty reports to condemn the U.S. government for human rights violations. In its official report on The Human Rights Record of the United States in 2010, the Chinese government asserts:
The United States is the world’s richest country, but Americans’ economic, social and cultural rights protection is going from bad to worse….The U.S. Census Bureau reported on September 16, 2010 that a total of 44 million Americans found themselves in poverty in 2009, four million more than that of 2008.[68]
Beijing fumes that, in America, the number of “[p]eople in hunger increased sharply…. About 50 million Americans experienced food shortage [in 2009]” and that “nearly one in four children struggles with hunger.”[69]
Russia Today (RT) is a multilingual television news network funded by the Russian government. RT broadcasts news in English, Spanish, and Arabic to over 100 nations around the globe. Like Al Jazeera, Russia Today has a fascination for U.S. government poverty figures, which it uses to project a horrifying picture of the U.S. around the globe. Using official Census figures, RT informs audiences that “one in seven Americans [are] living in poverty.” It then gives “a perfect example of the face of poverty in the United States”: a tent village for homeless people in the woods in New Jersey that is run by a church group. According to RT, the homeless living there apparently work without ceasing for less than the minimum wage.[70] RT leads viewers to believe that one in seven Americans crowd into charity soup kitchens each day to fend off starvation.[71] The network gleefully tells viewers that widespread poverty in America is “like a third world nightmare.”[72]
Al Jazeera and the governments of Iran, China, and Russia have their own ideological and geopolitical goals. Their depictions of the U.S. as a failed, nightmare society are no surprise. However, it is ironic that the U.S. government’s own misleading poverty report has become a major prop in anti-American propaganda around the world. Poverty in America is far from the nightmare of extreme material deprivation that it is portrayed to be, but the U.S. government has yet to explain that fact to the rest of the world or even to the American public.
Increasing the Misinformation: Obama’s New “Poverty” Measure
There is a vast gap between poverty as understood by the American public and poverty as currently measured by the government. Sadly, President Barack Obama plans to make this situation worse by creating a new “poverty” measure that deliberately severs all connection between “poverty” and actual deprivation. This new measure will serve as a propaganda tool in Obama’s endless quest to “spread the wealth” and will eventually displace the current poverty measure.
Under the new measure, a family will be judged poor if its income falls below certain specified income thresholds or standards. There is nothing new in this, but unlike the current poverty income standards, the new income thresholds will have a built-in escalator clause. They will rise automatically in direct proportion to any rise in the living standards of the average American.
The current poverty measure counts (albeit inaccurately) absolute purchasing power (how much meat and potatoes a person can buy). The new measure will count comparative purchasing power (how much meat and potatoes a person can buy relative to other people). As the nation becomes wealthier, the poverty standards will increase in proportion. In other words, Obama will employ a statistical trick to give a new meaning to the saying that “the poor will always be with you.”
The new poverty measure will produce very odd results. For example, if the real income of every single American were to triple magically overnight, the new poverty measure would show no drop in poverty because the poverty income standards would also triple. Under the Obama system, poverty can be reduced only if the incomes of the “poor” are rising faster than the incomes of everyone else. Another paradox of the new poverty measure is that countries such as Bangladesh and Albania will have lower poverty rates than the U.S.—even though the actual living conditions in those countries are extremely low—simply because they have narrower distribution of incomes, albeit very low incomes.
According to Obama’s measure, economic growth has no impact on poverty. Since the beginning of the 20th century, the incomes of nearly all Americans have increased sevenfold after adjusting for inflation. However, from Obama’s perspective, this increase in real incomes had no effect on poverty because the incomes of those at the bottom of the income distribution did not rise faster than the incomes of those in the middle.
In plain English, Obama’s new poverty-measure system will measure income “inequality,” not “poverty.” But he cannot call it an inequality index because the American voter is unwilling to support massive welfare increases, soaring deficits, and tax increases just to equalize incomes. However, if the goal of income leveling is camouflaged as a desperate struggle against poverty, malnutrition, hunger, and dire deprivation, then the political prospects improve.
The new measure is a public relations Trojan horse, smuggling in a “spread-the-wealth” agenda under the ruse of fighting significant material deprivation—a condition that is already rare in American society.
Poverty as traditionally defined by the Census Bureau has little connection with poverty as understood by the average American. The new Obama poverty measure will stretch this semantic gap, artificially swelling the number of poor Americans and severing any link between the government’s concept of poverty and even modest deprivation. It will make grappling with the real deprivation that does exist even more difficult.
Conclusion: What is Poverty?
In 2010, the U.S. Census Bureau declared that one in seven Americans lived “in poverty.” Catholic Charities has declared, “The existence of such widespread poverty amidst such enormous wealth is a moral and social wound in the soul of the country.”[73]
To the average American, the word “poverty” implies significant material deprivation, an inability to provide a family with adequate nutritious food, reasonable shelter, and clothing. Activists reinforce this view, declaring that being poor in the U.S. means being “unable to obtain the basic material necessities of life.”[74] The news media amplify this idea: Most news stories on poverty feature homeless families, people living in crumbling shacks, or lines of the downtrodden eating in soup kitchens.
The actual living conditions of America’s poor are far different from these images. In 2005, the typical household defined as poor by the government had a car and air conditioning. For entertainment, the household had two color televisions, cable or satellite TV, a DVD player, and a VCR. If there were children, especially boys, in the home, the family had a game system, such as an Xbox or PlayStation. In the kitchen, the household had a refrigerator, an oven and stove, and a microwave. Other household conveniences included a clothes washer, a clothes dryer, ceiling fans, a cordless phone, and a coffee maker.
The home of the typical poor family was not overcrowded and was in good repair. The family was able to obtain medical care when needed. By its own report, the family was not hungry and had sufficient funds during the past year to meet all essential needs.
Poor families clearly struggle to make ends meet, but in most cases, they are struggling to pay for air conditioning and cable TV while putting food on the table. The current recession has increased the number of Americans who are poor, but it does not appear to have greatly reduced the living standards of the average poor family.
True, the average poor family does not represent every poor family. There is a range of living conditions among the poor. Some poor households fare better than the average household described above. Others are worse off. Although the overwhelming majority of the poor are well housed, at any single point in time during the recession in 2009, around one in 70 poor persons was homeless. Although the majority of poor families have an adequate and reasonably steady supply of food, many worry about keeping food on the table, and one in five experienced temporary food shortages at various times in 2009.
Those who are without food or homeless will find no comfort in the fact that their condition is relatively infrequent. Their distress is real and a serious concern.
Nonetheless, wise public policy cannot be based on misinformation or misunderstanding. Anti-poverty policy must be based on an accurate assessment of actual living conditions and the causes of deprivation. In the long term, grossly exaggerating the extent and severity of material deprivation in the U.S. will benefit neither the poor, the economy, nor society as a whole.
—Robert Rector is Senior Research Fellow in the Domestic Policy Studies Department, and Rachel Sheffield is a Research Assistant in the Richard and Helen DeVos Center for Religion and Civil Society, at The Heritage Foundation.
Appendix