Executive Summary
Unlawful immigration and amnesty for current unlawful immigrants can pose large fiscal costs for U.S. taxpayers. Government provides four types of benefits and services that are relevant to this issue:
- Direct benefits. These include Social Security, Medicare, unemployment insurance, and workers’ compensation.
- Means-tested welfare benefits. There are over 80 of these programs which, at a cost of nearly $900 billion per year, provide cash, food, housing, medical, and other services to roughly 100 million low-income Americans. Major programs include Medicaid, food stamps, the refundable Earned Income Tax Credit, public housing, Supplemental Security Income, and Temporary Assistance for Needy Families.
- Public education. At a cost of $12,300 per pupil per year, these services are largely free or heavily subsidized for low-income parents.
- Population-based services. Police, fire, highways, parks, and similar services, as the National Academy of Sciences determined in its study of the fiscal costs of immigration, generally have to expand as new immigrants enter a community; someone has to bear the cost of that expansion.
The cost of these governmental services is far larger than many people imagine. For example, in 2010, the average U.S. household received $31,584 in government benefits and services in these four categories.
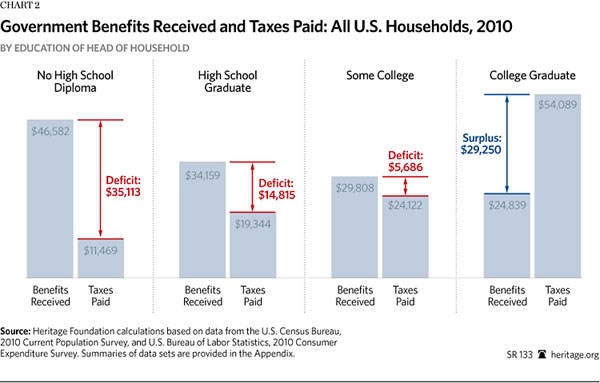
The governmental system is highly redistributive. Well-educated households tend to be net tax contributors: The taxes they pay exceed the direct and means-tested benefits, education, and population-based services they receive. For example, in 2010, in the whole U.S. population, households with college-educated heads, on average, received $24,839 in government benefits while paying $54,089 in taxes. The average college-educated household thus generated a fiscal surplus of $29,250 that government used to finance benefits for other households.
Other households are net tax consumers: The benefits they receive exceed the taxes they pay. These households generate a “fiscal deficit” that must be financed by taxes from other households or by government borrowing. For example, in 2010, in the U.S. population as a whole, households headed by persons without a high school degree, on average, received $46,582 in government benefits while paying only $11,469 in taxes. This generated an average fiscal deficit (benefits received minus taxes paid) of $35,113.
The high deficits of poorly educated households are important in the amnesty debate because the typical unlawful immigrant has only a 10th-grade education. Half of unlawful immigrant households are headed by an individual with less than a high school degree, and another 25 percent of household heads have only a high school degree.
Some argue that the deficit figures for poorly educated households in the general population are not relevant for immigrants. Many believe, for example, that lawful immigrants use little welfare. In reality, lawful immigrant households receive significantly more welfare, on average, than U.S.-born households. Overall, the fiscal deficits or surpluses for lawful immigrant households are the same as or higher than those for U.S.-born households with the same education level. Poorly educated households, whether immigrant or U.S.-born, receive far more in government benefits than they pay in taxes.
In contrast to lawful immigrants, unlawful immigrants at present do not have access to means-tested welfare, Social Security, or Medicare. This does not mean, however, that they do not receive government benefits and services. Children in unlawful immigrant households receive heavily subsidized public education. Many unlawful immigrants have U.S.-born children; these children are currently eligible for the full range of government welfare and medical benefits. And, of course, when unlawful immigrants live in a community, they use roads, parks, sewers, police, and fire protection; these services must expand to cover the added population or there will be “congestion” effects that lead to a decline in service quality.
In 2010, the average unlawful immigrant household received around $24,721 in government benefits and services while paying some $10,334 in taxes. This generated an average annual fiscal deficit (benefits received minus taxes paid) of around $14,387 per household. This cost had to be borne by U.S. taxpayers. Amnesty would provide unlawful households with access to over 80 means-tested welfare programs, Obamacare, Social Security, and Medicare. The fiscal deficit for each household would soar.
If enacted, amnesty would be implemented in phases. During the first or interim phase (which is likely to last 13 years), unlawful immigrants would be given lawful status but would be denied access to means-tested welfare and Obamacare. Most analysts assume that roughly half of unlawful immigrants work “off the books” and therefore do not pay income or FICA taxes. During the interim phase, these “off the books” workers would have a strong incentive to move to “on the books” employment. In addition, their wages would likely go up as they sought jobs in a more open environment. As a result, during the interim period, tax payments would rise and the average fiscal deficit among former unlawful immigrant households would fall.
After 13 years, unlawful immigrants would become eligible for means-tested welfare and Obamacare. At that point or shortly thereafter, former unlawful immigrant households would likely begin to receive government benefits at the same rate as lawful immigrant households of the same education level. As a result, government spending and fiscal deficits would increase dramatically.
The final phase of amnesty is retirement. Unlawful immigrants are not currently eligible for Social Security and Medicare, but under amnesty they would become so. The cost of this change would be very large indeed.
- As noted, at the current time (before amnesty), the average unlawful immigrant household has a net deficit (benefits received minus taxes paid) of $14,387 per household.
- During the interim phase immediately after amnesty, tax payments would increase more than government benefits, and the average fiscal deficit for former unlawful immigrant households would fall to $11,455.
- At the end of the interim period, unlawful immigrants would become eligible for means-tested welfare and medical subsidies under Obamacare. Average benefits would rise to $43,900 per household; tax payments would remain around $16,000; the average fiscal deficit (benefits minus taxes) would be about $28,000 per household.
- Amnesty would also raise retirement costs by making unlawful immigrants eligible for Social Security and Medicare, resulting in a net fiscal deficit of around $22,700 per retired amnesty recipient per year.
In terms of public policy and government deficits, an important figure is the aggregate annual deficit for all unlawful immigrant households. This equals the total benefits and services received by all unlawful immigrant households minus the total taxes paid by those households.
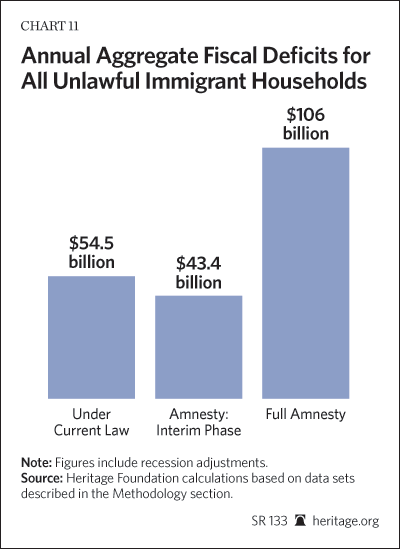
- Under current law, all unlawful immigrant households together have an aggregate annual deficit of around $54.5 billion.
- In the interim phase (roughly the first 13 years after amnesty), the aggregate annual deficit would fall to $43.4 billion.
- At the end of the interim phase, former unlawful immigrant households would become fully eligible for means-tested welfare and health care benefits under the Affordable Care Act. The aggregate annual deficit would soar to around $106 billion.
- In the retirement phase, the annual aggregate deficit would be around $160 billion. It would slowly decline as former unlawful immigrants gradually expire.
These costs would have to be borne by already overburdened U.S. taxpayers. (All figures are in 2010 dollars.)
The typical unlawful immigrant is 34 years old. After amnesty, this individual will receive government benefits, on average, for 50 years. Restricting access to benefits for the first 13 years after amnesty therefore has only a marginal impact on long-term costs.
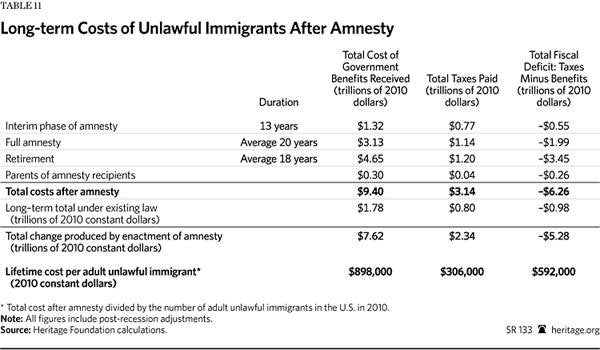
If amnesty is enacted, the average adult unlawful immigrant would receive $592,000 more in government benefits over the course of his remaining lifetime than he would pay in taxes.
Over a lifetime, the former unlawful immigrants together would receive $9.4 trillion in government benefits and services and pay $3.1 trillion in taxes. They would generate a lifetime fiscal deficit (total benefits minus total taxes) of $6.3 trillion. (All figures are in constant 2010 dollars.) This should be considered a minimum estimate. It probably understates real future costs because it undercounts the number of unlawful immigrants and dependents who will actually receive amnesty and underestimates significantly the future growth in welfare and medical benefits.
The debate about the fiscal consequences of unlawful and low-skill immigration is hampered by a number of misconceptions. Few lawmakers really understand the current size of government and the scope of redistribution. The fact that the average household gets $31,600 in government benefits each year is a shock. The fact that a household headed by an individual with less than a high school degree gets $46,600 is a bigger one.
Many conservatives believe that if an individual has a job and works hard, he will inevitably be a net tax contributor (paying more in taxes than he takes in benefits). In our society, this has not been true for a very long time. Similarly, many believe that unlawful immigrants work more than other groups. This is also not true. The employment rate for non-elderly adult unlawful immigrants is about the same as it is for the general population.
Many policymakers also believe that because unlawful immigrants are comparatively young, they will help relieve the fiscal strains of an aging society. Regrettably, this is not true. At every stage of the life cycle, unlawful immigrants, on average, generate fiscal deficits (benefits exceed taxes). Unlawful immigrants, on average, are always tax consumers; they never once generate a “fiscal surplus” that can be used to pay for government benefits elsewhere in society. This situation obviously will get much worse after amnesty.
Many policymakers believe that after amnesty, unlawful immigrants will help make Social Security solvent. It is true that unlawful immigrants currently pay FICA taxes and would pay more after amnesty, but with average earnings of $24,800 per year, the typical unlawful immigrant will pay only about $3,700 per year in FICA taxes. After retirement, that individual is likely to draw more than $3.00 in Social Security and Medicare (adjusted for inflation) for every dollar in FICA taxes he has paid.
Moreover, taxes and benefits must be viewed holistically. It is a mistake to look at the Social Security trust fund in isolation. If an individual pays $3,700 per year into the Social Security trust fund but simultaneously draws a net $25,000 per year (benefits minus taxes) out of general government revenue, the solvency of government has not improved.
Following amnesty, the fiscal costs of former unlawful immigrant households will be roughly the same as those of lawful immigrant and non-immigrant households with the same level of education. Because U.S. government policy is highly redistributive, those costs are very large. Those who claim that amnesty will not create a large fiscal burden are simply in a state of denial concerning the underlying redistributional nature of government policy in the 21st century.
Finally, some argue that it does not matter whether unlawful immigrants create a fiscal deficit of $6.3 trillion because their children will make up for these costs. This is not true. Even if all the children of unlawful immigrants graduated from college, they would be hard-pressed to pay back $6.3 trillion in costs over their lifetimes.
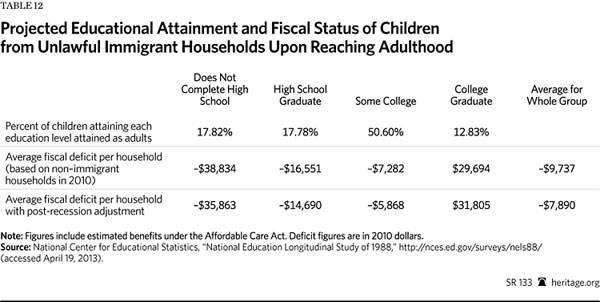
Of course, not all the children of unlawful immigrants will graduate from college. Data on intergenerational social mobility show that, although the children of unlawful immigrants will have substantially better educational outcomes than their parents, these achievements will have limits. Only 13 percent are likely to graduate from college, for example. Because of this, the children, on average, are not likely to become net tax contributors. The children of unlawful immigrants are likely to remain a net fiscal burden on U.S. taxpayers, although a far smaller burden than their parents.
A final problem is that unlawful immigration appears to depress the wages of low-skill U.S.-born and lawful immigrant workers by 10 percent, or $2,300, per year. Unlawful immigration also probably drives many of our most vulnerable U.S.-born workers out of the labor force entirely. Unlawful immigration thus makes it harder for the least advantaged U.S. citizens to share in the American dream. This is wrong; public policy should support the interests of those who have a right to be here, not those who have broken our laws.
Introduction
Each year, families and individuals pay taxes to the government and receive back a wide variety of services and benefits. A fiscal deficit occurs when the benefits and services received by one group exceed the taxes paid. When such a deficit occurs, other groups must pay for the services and benefits of the group in deficit. Each year, therefore, government is involved in a large-scale economic transfer of resources between different social groups.
Fiscal distribution analysis measures the distribution of total government benefits and taxes in society. It provides an assessment of the magnitude of government transfers between groups.
This paper provides a fiscal distribution analysis of households headed by unlawful immigrants: individuals who reside in the U.S. in violation of federal law. The paper measures the total government benefits and services received by unlawful immigrant households and the total taxes paid. The difference between benefits received and taxes paid represents the total resources transferred by government on behalf of unlawful immigrants from the rest of society.
Identifying the Unlawful Immigrant Population
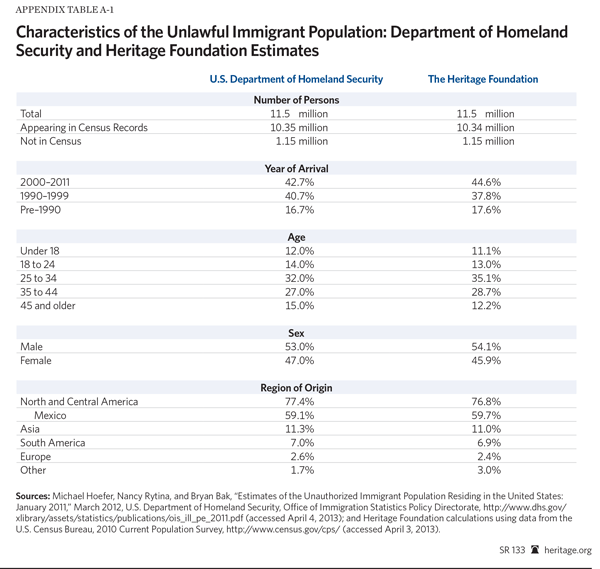
The U.S. Department of Homeland Security (DHS) estimates that there were 11.5 million undocumented, or unlawful, foreign-born persons in the U.S. in January 2011.[1] These estimates are based on the fact that the number of foreign-born persons appearing in U.S. Census surveys is considerably greater than the actual number of foreign-born persons who are permitted to reside lawfully in the U.S. according to immigration records.
For example, in January 2011, some 31.95 million foreign-born persons (who arrived in the country after 1980) appeared in the annual Census survey, but the corresponding number of lawful foreign-born residents in that year (according to government administrative records) was only 21.6 million.[2] DHS estimates that the difference—some 10.35 million foreign-born persons appearing in the Census American Community Survey (ACS)—was comprised of unauthorized or unlawful residents. DHS further estimates that an additional 1.15 million unlawful immigrants resided in the U.S. but did not appear in the Census survey, for a total of 11.5 million unlawful residents.[3]
DHS employs a “residual” method to determine the characteristics of the unlawful immigrant population. First, immigration records are used to determine the gender, age, country of origin, and time of entry of all foreign-born lawful residents. Foreign-born persons with these characteristics are subtracted from the total foreign-born population in Census records; the leftover, or “residual,” foreign-born population is assumed to be unlawful. This procedure enables DHS to estimate the age, gender, country of origin, date of entry, and current U.S. state of residence of the unlawful immigrant population in the U.S.
The current Heritage Foundation study uses the DHS reports on the characteristics of unlawful immigrants to identify in the Current Population Survey (CPS) of the U.S. Census a population of foreign-born persons who have a very high probability of being unlawful immigrants.[4] (The Current Population Survey is used in place of the similar American Community Survey because it has more detailed income and benefit information.)
The procedures used to identify unlawful immigrants in the CPS are similar to those used in studies of the unlawful immigrant population produced by the Pew Hispanic Center, the Center for Immigration Studies, and the Migration Policy Institute. Selection procedures included the following:
- The unlawful immigrant population identified in the CPS matched as closely as possible the age, gender, country of origin, year of arrival, and state of residence of the unlawful immigrant population identified by DHS.
- Foreign-born persons who were current or former members of the armed forces of the U.S. or current employees of federal, state, and local governments were assumed to be lawful residents.
- Since it is unlawful for unlawful immigrants to receive government benefits such as Social Security, Medicare, Medicaid, and public housing, individuals reporting personal receipt of such benefits were assumed to be lawfully resident.
- Principles of consistency were applied within families; for example, children of lawful residents were assumed to be lawful.
Additional information on the procedures used to identify unlawful immigrants in the CPS is provided in Appendix B. It should also be noted that the Heritage Foundation analysis matched the DHS figures as closely as possible.[5]
The characteristics of the unlawful immigrant population estimated for the present analysis are shown in text Table 1. In 2010, there were 11.5 million unlawful immigrants in the U.S. Some 10.34 million of these appeared in the annual Current Population Survey and were identified by the residual method described above. Following the DHS estimate, an additional 1.15 million unlawful immigrants were assumed to reside in the U.S. but not to appear in Census surveys.
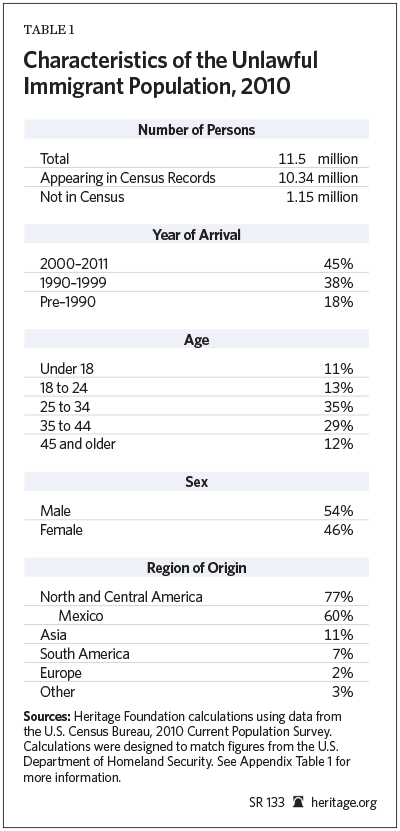
As Table 1 shows, 84 percent of unlawful immigrants came from Mexico, the Caribbean, and Central or South America; 11 percent came from Asia; and 5 percent came from the rest of the world. Unlawful immigrants were almost equally split by gender: 54 percent were males, and 46 percent were females.
Characteristics of Unlawful Immigrants and Unlawful Immigrant Households
Any analysis of the fiscal costs of unlawful immigration must deal with the fact that a great many unlawful immigrants are parents of U.S.-born children. For example, the Pew Hispanic Center estimates that in 2010, there were 5.5 million children residing in the U.S. who have unlawful immigrant parents. Among these children, some 1 million were born abroad and were brought into the U.S. unlawfully; the remaining 4.5 million were born in the U.S. and are treated under law as U.S. citizens. Overall, some 8 percent of the children born in the U.S. each year have unlawful immigrant parents.[6]
The presence of these 4 million native-born children with unlawful immigrant parents is a direct result of unlawful immigration. These children would not reside in the U.S. if their parents had not chosen to enter and remain in the nation unlawfully. Obviously, any analysis of the fiscal cost of unlawful immigration must therefore include the costs associated with these children, because those costs are a direct and inevitable result of the unlawful immigration of the parents. The costs would not exist in the absence of unlawful immigration.
To address that issue, the present study analyzes the fiscal costs of all households headed by unlawful immigrants. (Throughout this study, the terms “households headed by an unlawful immigrant” and “unlawful immigrant households” are used synonymously.)
In 2010, 3.44 million such households appeared in the CPS. These households contained 12.7 million persons including 7.4 million adults and 5.3 million children. Among the children, some 930,000 were unlawful immigrants, and 4.4 million were native-born or lawful immigrants.[7]
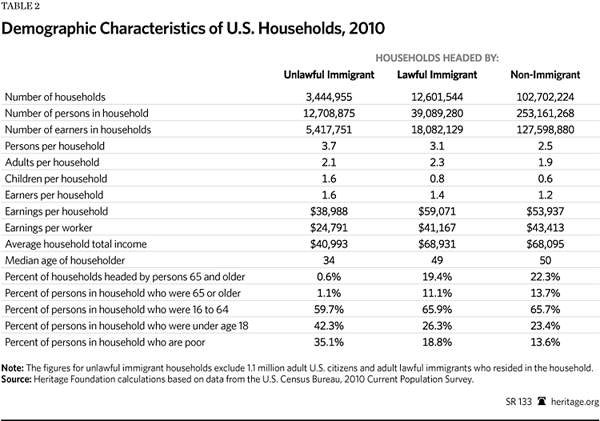
Table 2 shows the characteristics of unlawful immigrant households in comparison to non-immigrant and lawful immigrant households. Unlawful immigrant households are larger than other households, with an average of 3.7 persons per household compared to 2.5 persons in non-immigrant households.[8]
Unlawful immigrant households have more wage earners per household: 1.6 compared to 1.2 among non-immigrant households. However, the average earnings per worker are dramatically lower in unlawful immigrant households: $24,791 per worker compared to $43,413 in non-immigrant households. Contrary to conventional wisdom, non-elderly adult unlawful immigrants are not more likely to work than are similar non-immigrants.
The heads of unlawful immigrant households are younger, with a median age of 34 compared to 50 among non-immigrant householders. Partly because they are younger, unlawful immigrant households have more children, with an average of 1.6 children per household compared to 0.6 among non-immigrant households. The higher number of children tends to raise governmental costs among unlawful immigrant households. (Both lawful and unlawful children in unlawful immigrant households are eligible for public education, and the large number of children who were born in the U.S. are also eligible for means-tested welfare benefits such as food stamps, Medicaid, and Children’s Health Insurance Program benefits.)
By contrast, there are very few elderly persons in unlawful immigrant households. Only 1.1 percent of persons in those households are over 65 years of age compared to 13.7 percent of persons in non-immigrant households. The absence of elderly persons in unlawful immigrant households significantly reduces current government costs; however, if unlawful immigrants remain in the U.S. permanently, the number who are elderly will obviously increase significantly.
Unlawful immigrant households are far more likely to be poor. Over one-third of unlawful immigrant households have incomes below the federal poverty level compared to 18.8 percent of lawful immigrant households and 13.6 percent of non-immigrant households.
Education Level of Unlawful Immigrant Households
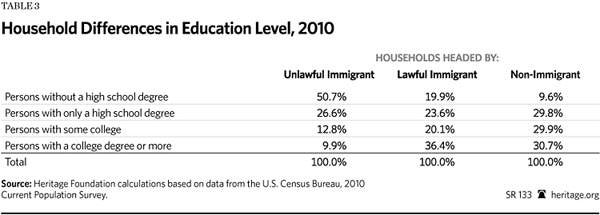
The low wage level of unlawful immigrant workers is a direct result of their low education levels. As Table 3 shows, half of unlawful immigrant households are headed by persons without a high school degree; more than 75 percent are headed by individuals with a high school degree or less. Only 10 percent of unlawful immigrant households are headed by college graduates. By contrast, among non-immigrant households, 9.6 percent are headed by persons without a high school degree, around 40 percent are headed by persons with a high school degree or less, and nearly one-third are headed by college graduates.
The current unlawful immigrant population thus contains a disproportionate share of poorly educated individuals. These individuals will tend to have low wages and pay comparatively little in taxes.
There is a common misconception that the low education levels of recent immigrants are part of a permanent historical pattern and that the U.S. has always admitted immigrants who were poorly educated relative to the native-born population. Historically, this has not been the case. For example, in 1960, recent immigrants were no more likely than non-immigrants to lack a high school degree. By 1998, recent immigrants were almost four times more likely to lack a high school degree than were non-immigrants.[9]
As the relative education level of immigrants fell in recent decades, so did their relative wage levels. In 1960, the average immigrant male in the U.S. actually earned more than the average non-immigrant male. As the relative education levels of subsequent waves of immigrants fell, so did relative wages. By 1998, the average immigrant earned 23 percent less than the average non-immigrant earned.[10]
Aggregate Cost of Government Benefits and Services
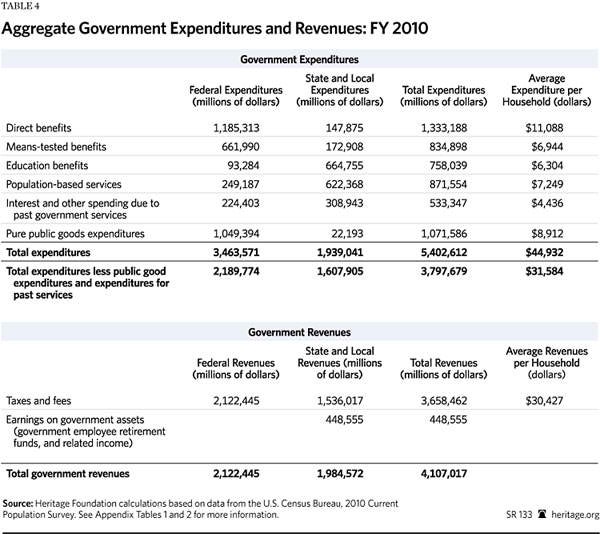
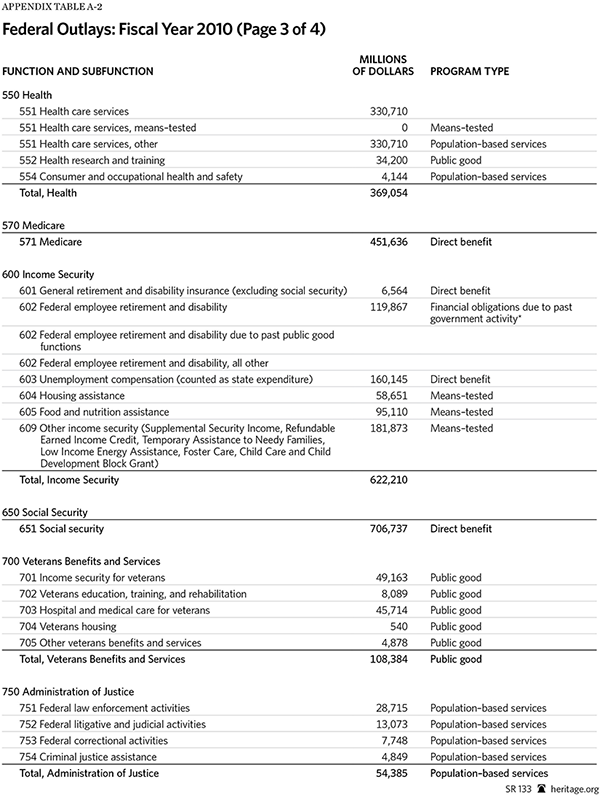
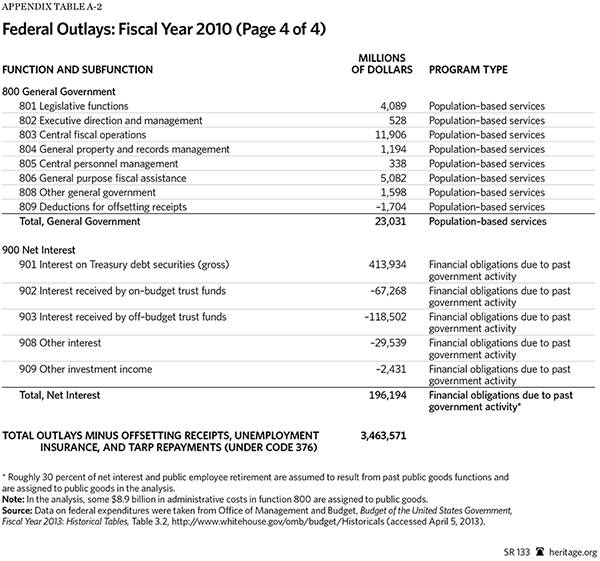
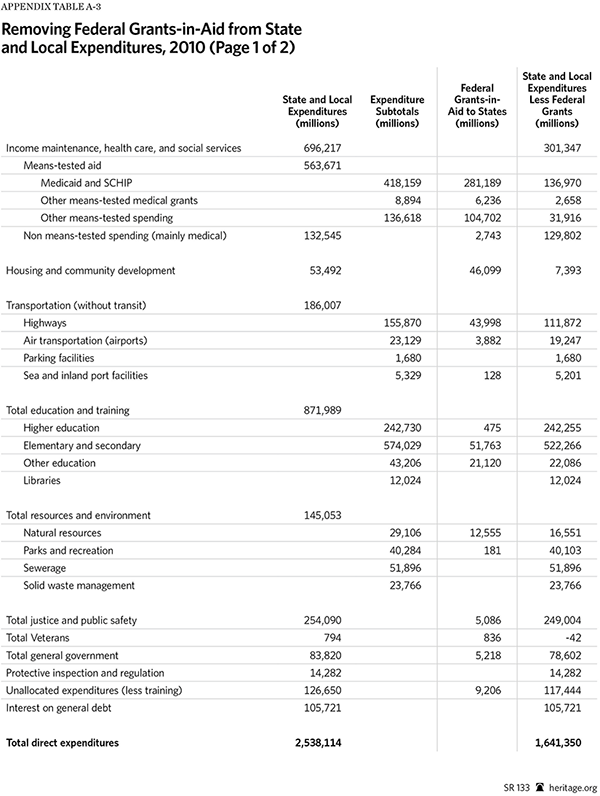
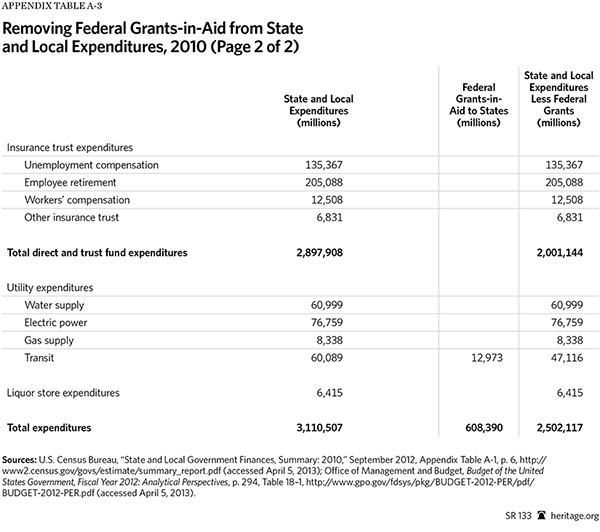
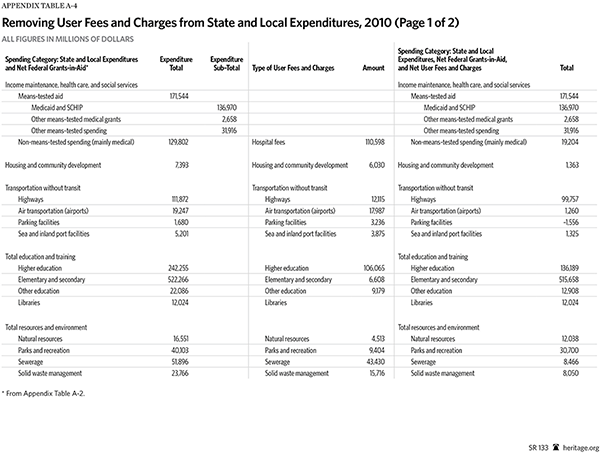
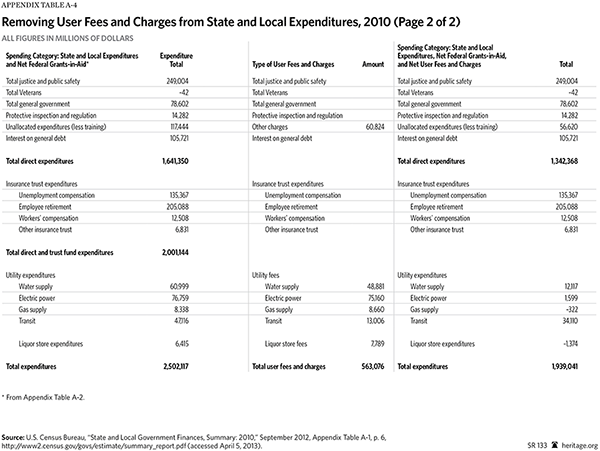
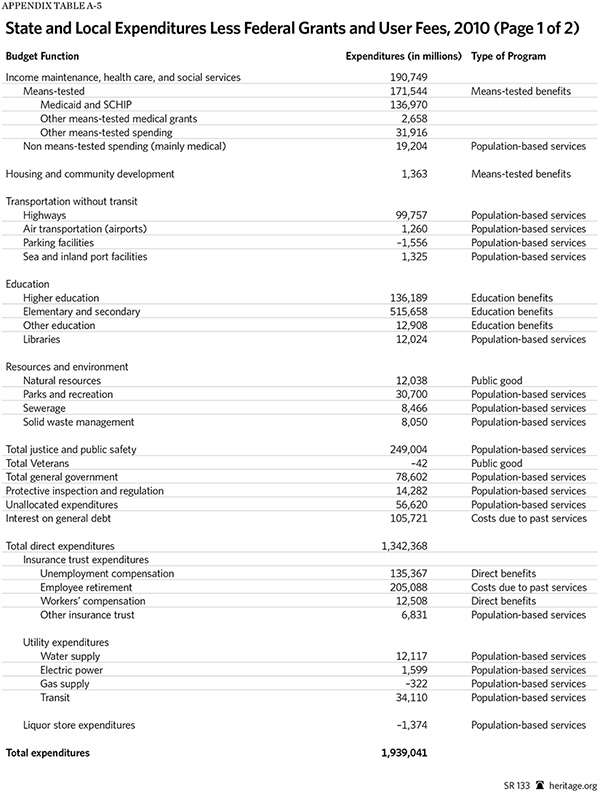
Any analysis of the distribution of benefits and taxes within the U.S. population must begin with an accurate count of the cost of all benefits and services provided by the government. The size and cost of government is far larger than many people imagine. In fiscal year (FY) 2010, the expenditures of the federal government were $3.46 trillion. In the same year, expenditures of state and local governments were $1.94 trillion. The combined value of federal, state, and local expenditures in FY 2010 was $5.4 trillion.[11]
This sum is so large that it is difficult to comprehend. One way to grasp the size of government more readily is to calculate average expenditures per household. In 2010, there were 120.2 million households in the U.S.[12] (This figure includes both multi-person families and single persons living alone.) The average cost of government spending thus amounted to $44,932 per household across the U.S. population.[13]
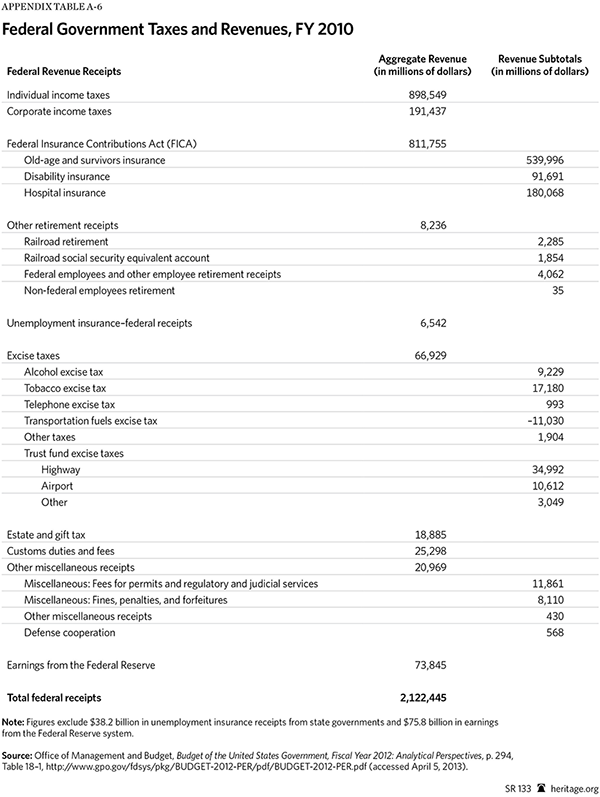
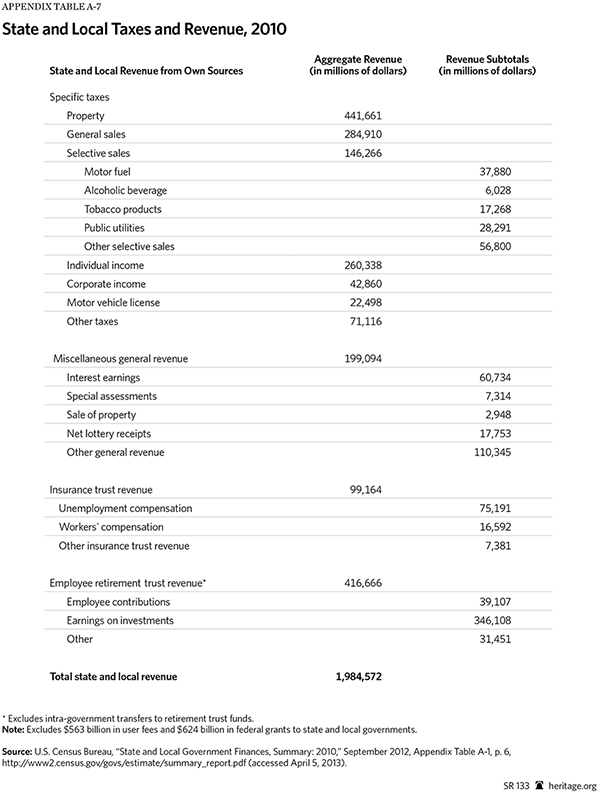
The $5.4 trillion in government expenditure is not free; it must be paid for by taxing or borrowing economic resources from Americans or by borrowing from abroad. In FY 2010, federal taxes amounted to $2.12 trillion. State and local taxes and related revenues amounted to $1.98 trillion.[14] Together, federal, state, and local taxes amounted to $4.11 trillion. Taxes and related revenues came to 75 percent of the $5.4 trillion in expenditures. The gap between taxes and spending was financed by government borrowing.
Types of Government Expenditure
After the full cost of government benefits and services has been determined, the next step in analyzing the distribution of benefits and taxes is to determine the beneficiaries of specific government programs. Some programs, such as Social Security, neatly parcel out benefits to specific individuals. With programs such as these, it is relatively easy to determine the identity of the beneficiary and the cost of the benefit provided. On the other hand, other government functions such as highway construction do not neatly parcel out benefits to individuals. Determining the proper allocation of the benefits of that type of program is more complex.
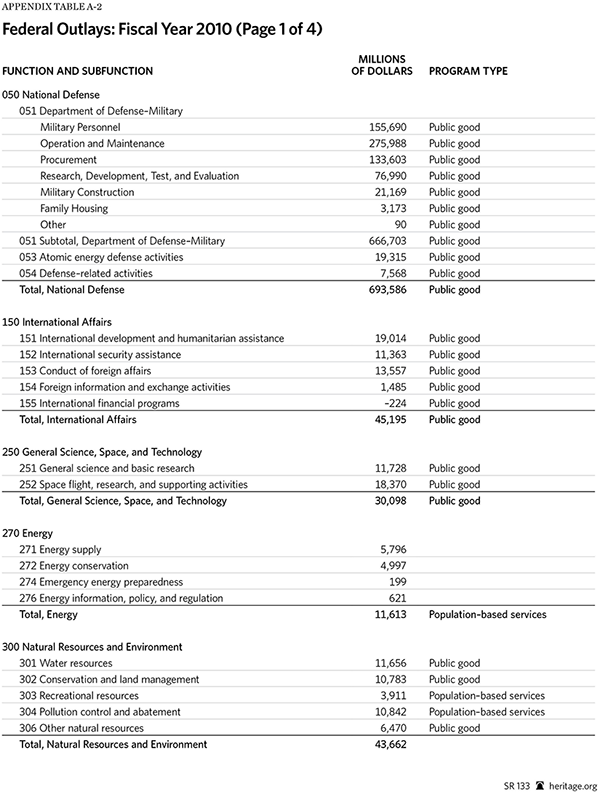
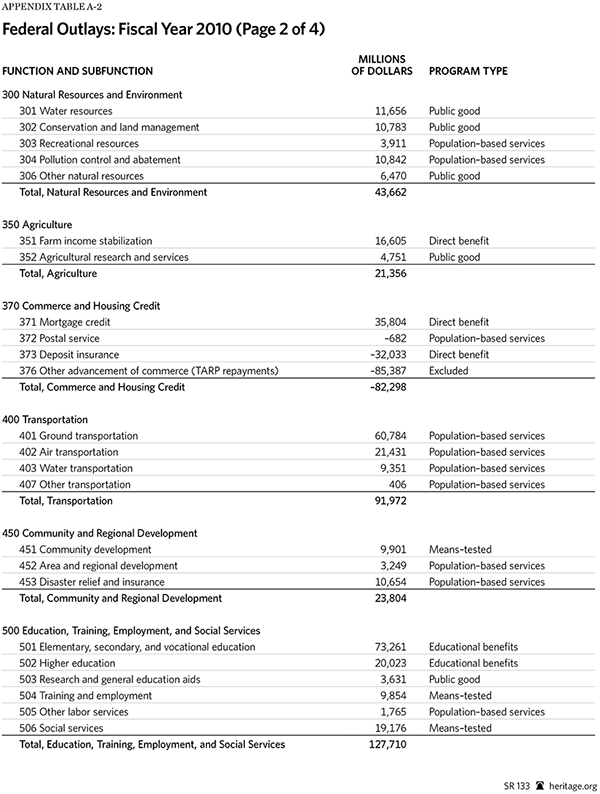
To determine the distribution of government benefits and services, this study begins by dividing government expenditures into six categories: direct benefits, means-tested benefits, educational services, population-based services, interest and other financial obligations resulting from prior government activity, and pure public goods.
Direct Benefits. Direct benefit programs involve either cash transfers or the purchase of specific services for an individual. Unlike means-tested programs, direct benefit programs are not limited to low-income persons. By far the largest direct benefit programs are Social Security and Medicare. Other substantial direct benefit programs are unemployment insurance and workers’ compensation.
Direct benefit programs involve a fairly transparent transfer of economic resources. The benefits are parceled out discretely to individuals in the population; both the recipient and the cost of the benefit are relatively easy to determine. In the case of Social Security, the cost of the benefit would equal the value of the Social Security check plus the administrative costs involved in delivering the benefit.
Calculating the cost of Medicare services is more complex. Ordinarily, government does not seek to compute the particular medical services received by an individual. Instead, government counts the cost of Medicare for an individual as equal to the average per capita cost of Medicare services. (This number equals the total cost of Medicare services divided by the total number of recipients.[15]) Overall, government spent $1.33 trillion on direct benefits in FY 2010.
Means-Tested Benefits. Means-tested programs are typically termed welfare programs. Unlike direct benefits, means-tested programs are available only to households that fall below specific income thresholds. Means-tested welfare programs provide cash, food, housing, medical care, and social services to poor and low-income persons.
The federal government operates over 80 means-tested aid programs.[16] The largest are Medicaid; the Earned Income Tax Credit (EITC); food stamps; Supplemental Security Income (SSI); Section 8 housing; public housing; Temporary Assistance for Needy Families (TANF); school lunch and breakfast programs; the WIC (Women, Infants, and Children) nutrition program; and the Social Services Block Grant (SSBG). Many means-tested programs, such as SSI and the EITC, provide cash to recipients. Others, such as public housing or SSBG, pay for services that are provided to recipients.
The value of Medicaid benefits is usually counted much as the value of Medicare benefits is counted. Government does not attempt to itemize the specific medical services given to an individual; instead, it computes an average per capita cost of services to individuals in different beneficiary categories such as children, elderly persons, and disabled adults. (The average per capita cost for a particular group is determined by dividing the total expenditures on the group by the total number of beneficiaries in the group.) Overall, the U.S. spent $835 billion on means-tested aid in FY 2010.[17]
Public Education. Government provides primary, secondary, post-secondary, and vocational education to individuals. In most cases, the government pays directly for the cost of educational services provided. In other cases, such as the Pell Grant program, the government in effect provides money to an eligible individual who then spends it on educational services.
Education is the single largest component of state and local government spending, absorbing roughly a third of all state and local expenditures. The average cost of public primary and secondary education per pupil is now around $12,300 per year. Overall, federal, state, and local governments spent $758 billion on education in FY 2010.
Population-Based Services. Whereas direct benefits, means-tested benefits, and education services provide discrete benefits and services to particular individuals, population-based programs generally provide services to a whole group or community. Population-based expenditures include police and fire protection, courts, parks, sanitation, and food safety and health inspections. Another important population-based expenditure is transportation, especially roads and highways.
A key feature of population-based expenditures is that such programs generally need to expand as the population of a community expands. (This quality separates them from pure public goods.) For example, as the population of a community increases, the number of police and firefighters will generally need to expand proportionally.
In The New Americans, a study of the fiscal costs of immigration published by the National Academy of Sciences, the National Research Council (NRC) argued that if service remains fixed while the population increases, a program will become “congested,” and the quality of service for users will deteriorate. Thus, the NRC uses the term “congestible goods” to describe population-based services.[18] Highways are an obvious example. In general, the cost of population-based services can be allocated according to an individual’s estimated utilization of the service or at a flat per capita cost across the relevant population.
A subcategory of population-based services is government administrative support functions such as tax collections and legislative activities. Few taxpayers view tax collection as a government benefit; therefore, assigning the cost of this “benefit” appears to be problematic.
The solution to this dilemma is to conceptualize government activities into two categories: primary functions and secondary functions.
- Primary functions provide benefits directly to the public; they include direct and means-tested benefits, education, ordinary population-based services such as police and parks, and public goods.
- By contrast, secondary or support functions do not provide direct benefits to the public but do provide necessary support services that enable the government to perform primary functions. For example, no one can receive food stamp benefits unless the government first collects taxes to fund the program. Secondary functions can thus be considered an inherent part of the “cost of production” of primary functions, and the benefits of secondary support functions can be allocated among the population in proportion to the allocation of benefits from government primary functions.
Government spent $871 billion on population-based services in FY 2010. Of this amount, some $769.6 billion went for ordinary services such as police and parks, and $101.4 billion went for administrative support functions.
Interest and Other Financial Obligations Relating to Past Government Activities. Often, tax revenues are insufficient to pay for the full cost of government benefits and services. In that case, government will borrow money and accumulate debt. In subsequent years, interest payments must be paid to those who lent the government money. Interest payments for the government debt are in fact partial payments for past government benefits and services that were not fully paid for at the time of delivery.
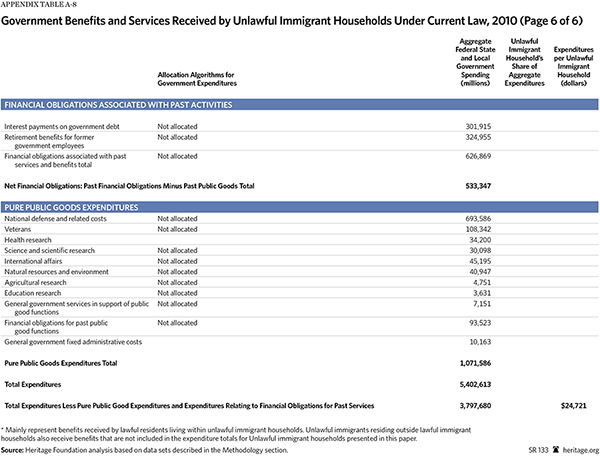
Similarly, government employees deliver services to the public. Part of the cost of the service is paid for immediately through the employee’s salary, but government employees are also compensated by future retirement benefits. To a considerable degree, expenditures of public-sector retirement are therefore present payments in compensation for services delivered in the past. The expenditure category “interest and other financial obligations relating to past government activities” thus includes interest and principal payments on government debt and outlays for government employee retirement. Total government spending on these items equaled $533.3 billion in FY 2010.[19]
While direct benefits, means-tested benefits, public education, and population-based services will grow as more immigrants take up residence in the United States, this is not the case for interest payments on the debt and related costs. These costs were fixed by past government spending and borrowing and are largely unaffected, at least in the intermediate term, by immigrants’ entry into the United States. While an increased inflow of immigrants will lead to an increase in most forms of government spending, it will not cause an increase in interest payments on government debt in the short term.
To assess the fiscal impact of unlawful immigrants, therefore, the present report follows the procedures used by the National Research Council in The New Americans: That is, it ignores the costs of interest on the debt and similar financial obligations when calculating the net tax burden imposed by lawful and unlawful immigrant households.[20]
On the other hand, while unlawful immigrant households do not increase government debt immediately, such households will, on average, increase government debt significantly over the long term. For example, if an unlawful immigrant household generated a net fiscal deficit (benefits received minus taxes paid) of $20,000 per year and roughly 20 percent of that amount was financed each year by government borrowing, then the immigrant household would be responsible for adding roughly $4,000 to government debt each year. After 50 years, the family’s contribution to growth in government debt would be around $200,000. While these potential costs are significant, they are outside the scope of the current paper and are not included in the calculations presented here.
Pure Public Goods. Economic theory distinguishes between “private consumption goods” and pure public goods. Economist Paul Samuelson is credited with first making this distinction. In his seminal 1954 paper “The Pure Theory of Public Expenditure,”[21] Samuelson defined a pure public good (or what he called a “collective consumption good”) as a good “which all enjoy in common in the sense that each individual’s consumption of such a good leads to no subtractions from any other individual’s consumption of that good.” By contrast, a “private consumption good” is a good that “can be parceled out among different individuals.” Its use by one person precludes or diminishes its use by another.
A classic example of a pure public good is a lighthouse: The fact that one ship perceives the warning beacon does not diminish the usefulness of the lighthouse to other ships. Another clear example of a governmental pure public good would be a future cure for cancer produced by government-funded research: The fact that non-taxpayers would benefit from this discovery would neither diminish its benefit nor add extra costs to taxpayers. By contrast, an obvious example of a private consumption good is a hamburger: When one person eats it, it cannot be eaten by others.
Direct benefits, means-tested benefits, and education services are private consumption goods in the sense that the use of a benefit or service by one person precludes or limits the use of that same benefit by another. (Two people cannot cash the same Social Security check.) Population-based services such as parks and highways are often mentioned as “public goods,” but they are not pure public goods in the strict sense described above. In most cases, as the number of persons using a population-based service (such as highways and parks) increases, the service must either expand (at added cost to taxpayers) or become “congested,” in which case its quality will be reduced. Consequently, use of population-based services such as police and fire departments by non-taxpayers does impose significant extra costs on taxpayers.
Government pure public goods are rare; they include scientific research, defense, spending on veterans, international affairs, and some environmental protection activities such as the preservation of endangered species. Each of these functions generally meets the criterion that the benefits received by non-taxpayers do not result in a loss of utility for taxpayers. Government pure public good expenditures on these functions equaled $978 billion in FY 2010. Interest payments on government debt and related costs resulting from public good spending in previous years add an estimated additional cost of $93.5 billion, bringing the total public goods cost in FY 2010 to $1,071.5 billion.
An immigrant’s entry into the country neither increases the size and cost of public goods nor decreases the utility of those goods to taxpayers. In contrast to direct benefits, means-tested benefits, public education, and population-based services, the fact that unlawful and low-skill immigrant households may benefit from public goods that they do not pay for does not add to the net tax burden on other taxpayers.
This report therefore follows the same methods employed by the National Research Council in The New Americans and excludes public goods from the count of benefits received by unlawful immigrant households.[22] (For a further discussion of pure public goods, see Appendix G.)
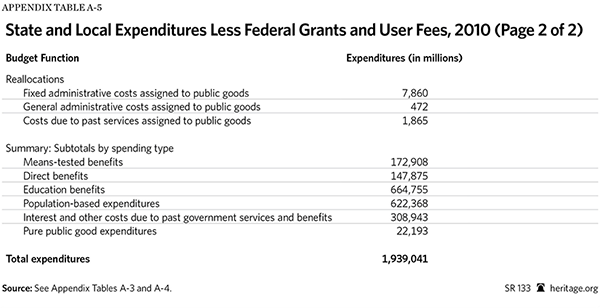
Summary: Total Expenditures. As Table 4 shows, overall government spending in FY 2010 came to $5.40 trillion. Direct benefits had an average cost of $11,088 per household across the whole population, while means-tested benefits had an average cost of $6,944 per household. Education benefits and population-based services cost $6,304 and $7,249 per household, respectively. Interest payments on government debt and other costs relating to past government activities cost $4,436 per household. Pure public good expenditures comprised 20 percent of all government spending and had an average cost of $8,912 per household.
Excluding spending on public goods, interest on the debt, and related financial obligations, total spending came to $31,584 per household across the entire population.
Taxes and Revenues
Total taxes and revenues for federal, state, and local governments amounted to $4.107 trillion in FY 2010. The federal government received $2.12 trillion in revenue, while state and local governments received $1.98 trillion.
A detailed breakdown of federal, state, and local taxes is provided in Appendix Tables 6 and 7. The biggest revenue generator was the federal income tax, which cost taxpayers $899 billion in 2010, followed by Federal Insurance Contribution Act (FICA) taxes, which raised $812 billion. Property tax was the biggest revenue producer at the state and local levels, generating $442 billion, while general sales taxes gathered $285 billion.
Over 90 percent of the revenues shown in Appendix Tables 6 and 7 are conventional taxes and revenues; the remaining 9 percent ($449 billion) are earnings from government assets, primarily assets held in state and local government employee pension funds. About one-quarter of these revenues were used to fund current retirement benefits; the rest were accumulated for future use.
Unlike general taxes, these earnings are not mandatory transfers from the population to the government, but rather represent an economic return on assets the government owns or controls. Because they do not represent payments made by households to the government, these earnings are not included in the fiscal balance analysis presented in the body of this paper. If they were included, they would alter the fiscal balance of current government retirees; therefore, they are irrelevant to the main topic of this paper: the fiscal balance of unlawful immigrants.
Summary of Estimation Methodology
The accounting framework used in the present analysis is the same framework employed by the National Research Council of the National Academy of Sciences in The New Americans.[23] Following that framework, the present study:
- Excludes public goods costs such as defense and interest payments on government debt;
- Treats population-based or congestible services as fully private goods and assigns the cost of those services to immigrant households based either on estimated use or on the immigrant share of the population.[24]
- Includes the welfare and educational costs of immigrant and non-immigrant minor children and assigns those costs to the child’s household;
- Assigns the welfare and educational costs of minor U.S.-born children of immigrant parents in the immigrant household; and
- Assigns the cost of means-tested and direct benefits according to the self-reported use of those benefits in the CPS.
Clearly, any study that does not follow this framework may reach very different conclusions. For example, any study that excludes the welfare benefits and educational services received by the minor U.S.-born children of unlawful immigrant parents from the costs assigned to unlawful immigrant households will reach very different conclusions about the fiscal consequences of unlawful immigration.
An important principle in the analysis is that receipt of means-tested benefits and direct benefits was not imputed or assigned to households arbitrarily. Rather, the cost of benefits received was based on the household’s self-report of benefits in the U.S. Census Bureau’s Current Population Survey.[25] For example, the cost of the food stamp benefits received is based on the food stamp benefits data provided by the household. If the household stated it did not receive food stamps, then the value of food stamps within the household would be zero.
Data on attendance in public primary and secondary schools were also taken from the CPS; students attending public school were then assigned educational costs equal to the average per-pupil expenditures in their state. Public post-secondary education costs were calculated in a similar manner.
Wherever possible, the cost of population-based services was based on the estimated utilization of the service by unlawful immigrant households. For example, each household’s share of public transportation expenditures was assumed to be proportional to its share of spending on public transportation as reported in the Bureau of Labor Statistics Consumer Expenditure Survey (CEX). When data on utilization of a service were not available, the household’s share of population-based services was assumed to equal its share of the total U.S. population.
Federal and state income taxes were calculated based on data from the CPS. FICA taxes were also calculated from CPS data; both the employer and employee share of FICA taxes were assumed to fall on workers. Corporate income taxes were assumed to be borne partly by workers and partly by owners; the distribution of these taxes was estimated according to the distribution of earnings and property income in the CPS.
Sales, excise, and property tax payments were based on consumption data from the Consumer Expenditure Survey.[26] For example, if the CEX showed that households headed by persons without a high school degree accounted for 10 percent of all sales of tobacco products in the U.S., those households were assumed to pay 10 percent of all tobacco excise taxes.
Certain specific adjustments were made for unlawful immigrant households. Since 45 percent of unlawful immigrants are believed to work “off the books,” the federal and state income tax and FICA tax payments that Census imputes for each household were reduced by 45 percent among unlawful immigrant households. The values of the Earned Income Tax Credit and Additional Child Tax Credit that Census imputes based on family income were reduced to zero for unlawful immigrant families since they are not eligible for those benefits. Immigrant children enrolled in government medical programs were assumed to have half the actual cost of non-immigrant children.[27] And unlawful immigrant families were assumed to use parks, highways, and libraries less than lawful households with the same income.
Finally, about 9 percent of the persons in unlawful immigrant households are adult lawful immigrants or U.S. citizens. The benefits received and taxes paid by these individuals have been excluded from the analysis. The overall methodology of the study is described in detail in the Appendices.
Distribution of Government Benefits and Taxes in the U.S. Population
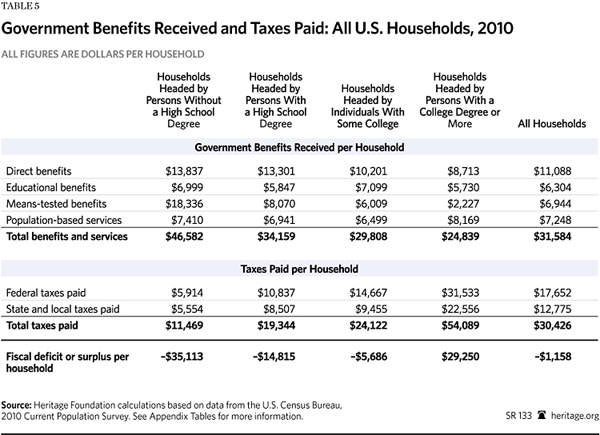
Table 5 shows government benefits received and taxes paid by the average household in the whole U.S. population. In FY 2010, the average household received a total of $31,584 in government direct benefits, means-tested benefits, education, and population-based services. The household paid $30,426 in federal, state, and local taxes. Since the benefits received exceeded taxes paid, the average household had a fiscal deficit of $1,158 that had to be financed by government borrowing.
If earnings in government employee retirement funds were included in the analysis, this small average household deficit would be largely erased. Nonetheless, these figures show that the taxes paid by U.S. households overall barely cover the cost of immediate services received (direct benefits, means-tested aid, education, and population-based services).[28] Public goods such as defense and interest on government debt are funded by government borrowing.
However, these average household figures mask great differences between different types of households. Individual households have different fiscal balances. Many households are net tax contributors: The taxes they pay exceed the direct and means-tested benefits, education, and population-based services they receive. These households generate a “fiscal surplus” that government uses to finance benefits and services for other households. By contrast, other households are net tax consumers: The government benefits and services received by these households exceed taxes paid. These households generate a “fiscal deficit” that must be financed by taxes from other households or by government borrowing.
Table 5 shows that a critical factor in determining the fiscal balance of a household is the education of the head of household. Individuals with higher education levels earn more, pay more in taxes, and receive fewer government benefits. Less-educated individuals tend to receive more in government benefits and pay less in taxes.
Chart 2 shows the average fiscal balance for all U.S. households based on the education level of the head of household. At one extreme are households with college-educated heads; on average, these households receive $24,839 in government benefits while paying $54,089 in taxes. The average college-educated household thus generates a fiscal surplus of $29,250 that government uses to finance benefits for other households.
At the other extreme are households headed by persons without a high school degree. On average, these households receive $46,582 in government benefits (direct, means-tested, education, and population-based services) while paying only $11,469 in taxes. This generates an average fiscal deficit (benefits received minus taxes paid) of $35,113.
The large average fiscal deficit of less-educated households has a bearing on the immigration debate because immigrant families (both lawful and unlawful) have, on average, far lower education levels than non-immigrants. For example, as Table 3 shows, half of unlawful immigrant household heads do not have a high school degree, and another 27 percent have only a high school diploma.
Household Fiscal Balances and Immigration
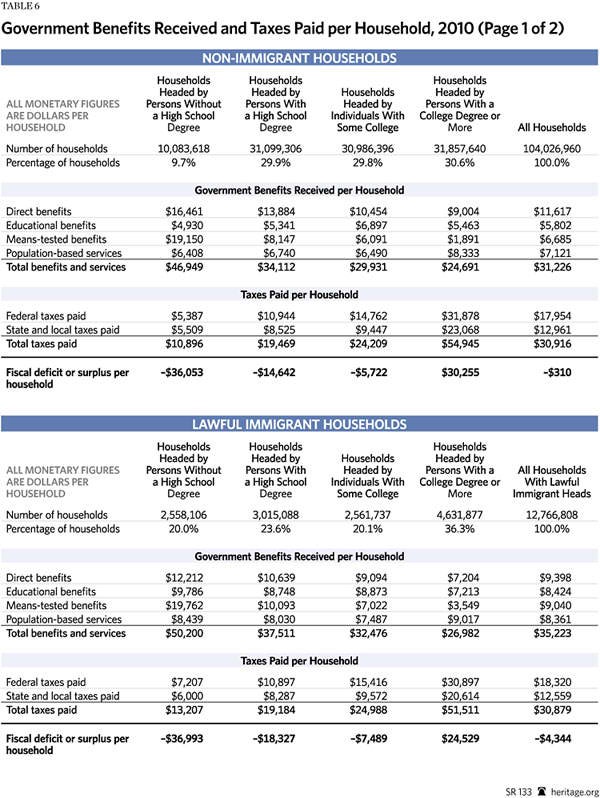
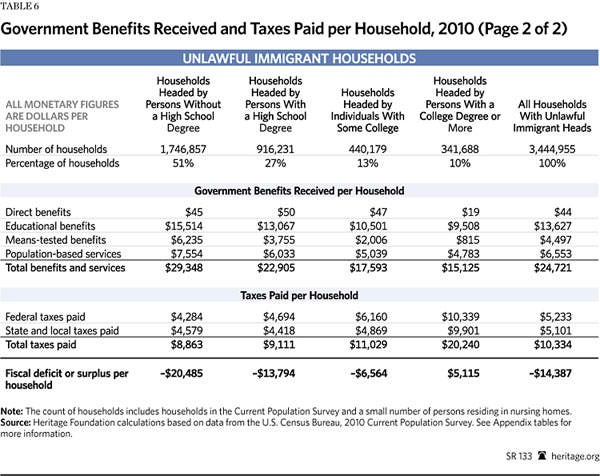
Table 6 shows the fiscal balance for non-immigrant, lawful immigrant, and unlawful immigrant households. Unlawful immigrant households have the largest annual fiscal deficits at $14,387 per household. Lawful immigrant households have an average annual fiscal deficit of $4,344, and non-immigrant households have a deficit of $310, meaning that taxes paid roughly equal benefits received.[29]
Lawful immigrant households have higher fiscal deficits than non-immigrants for two reasons. The first is lower education levels; 20 percent of lawful immigrant households are headed by individuals without a high school diploma, compared to 10 percent among non-immigrant households. The second reason is high levels of welfare use. There is a popular misconception that immigrants use little welfare. The opposite is true. In fact, lawful immigrants receive the highest level of welfare benefits.
At $9,040, lawful immigrants’ annual welfare benefits are a third higher than non-immigrants’ benefits. This seems paradoxical because lawful immigrants are barred from receiving nearly all means-tested welfare during their first five years in the U.S. As Table 6 shows, this temporary ban has virtually no impact on the overall use of welfare because (a) the ban does not apply to children born inside the U.S. and (b) receipt of welfare occurs continually throughout a lifetime and therefore is little affected by a five- or 10-year moratorium on receipt of aid.
The lack of effectiveness of the five-year ban on welfare receipt in controlling total welfare costs has a direct bearing on the debate about amnesty legislation. It is noteworthy that the highest level of welfare use shown in Table 6 is $19,762 per household per year among lawful immigrant households headed by individuals without a high school diploma. This figure is important because similar levels of welfare use can be expected among unlawful immigrant households receiving amnesty.
Another important point is that the level of welfare benefits received by unlawful immigrant households is significant, despite the fact that unlawful immigrants themselves are ineligible for nearly all welfare aid. The welfare benefits received by unlawful immigrant households go to U.S.-born children within these homes. If undocumented adults within these households are given access to means-tested welfare programs, per-household benefits will reach very high levels.
Cost of Government Benefits and Services Received by Unlawful Immigrant Households
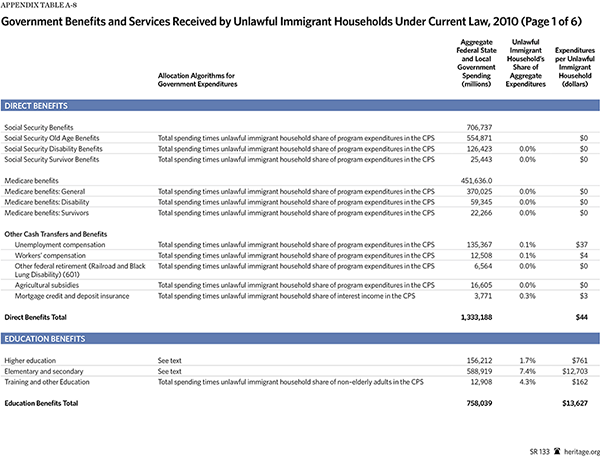
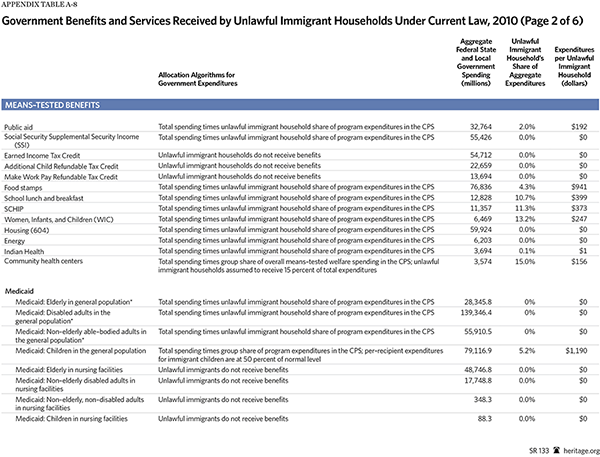
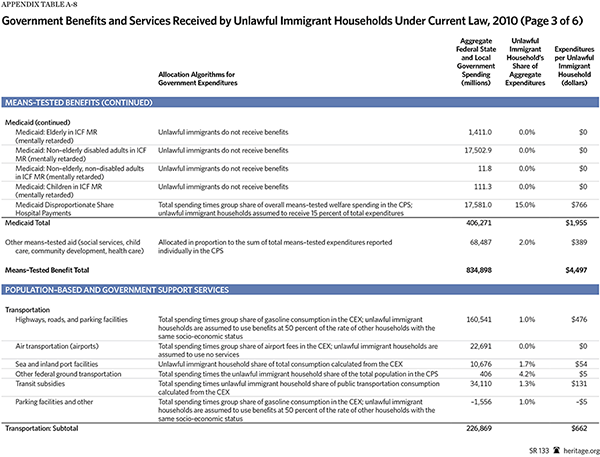
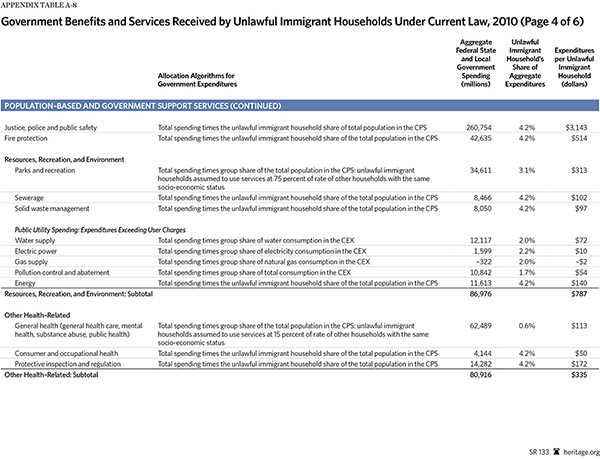
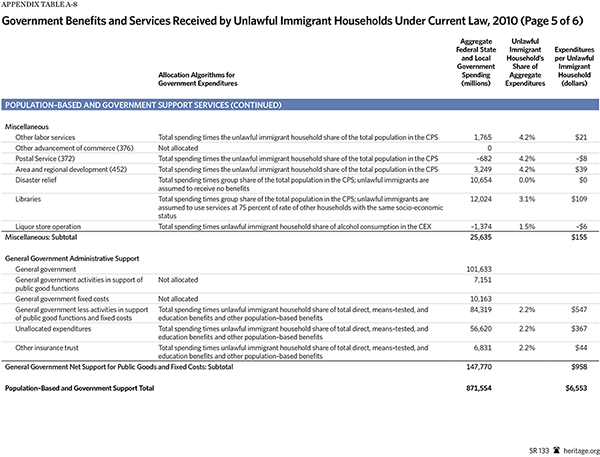
As noted, in 2010, some 3.44 million unlawful immigrant households appeared in Census surveys. Appendix Table 8 shows the estimated costs of government benefits and services received by these households in 73 separate expenditure categories. The results are summarized in Chart 3.
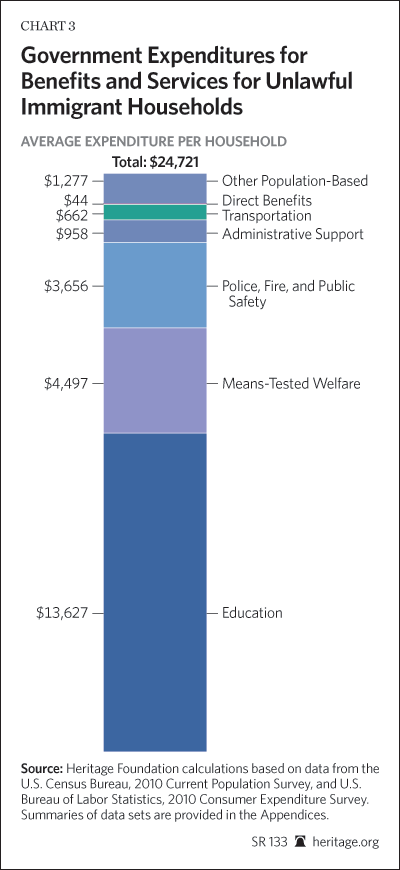
Overall, households headed by an unlawful immigrant received an average of $24,721 per household in direct benefits, means-tested benefits, education, and population-based services in FY 2010. Education spending on behalf of these households averaged $13,627, and means-tested aid (going mainly to the U.S.-born children in the family) averaged $4,497. Spending on police, fire, and public safety came to $3,656 per household. Transportation added another $662, and administrative support services cost $958. Direct benefits came to $44. Miscellaneous population-based services added a final $1,277.
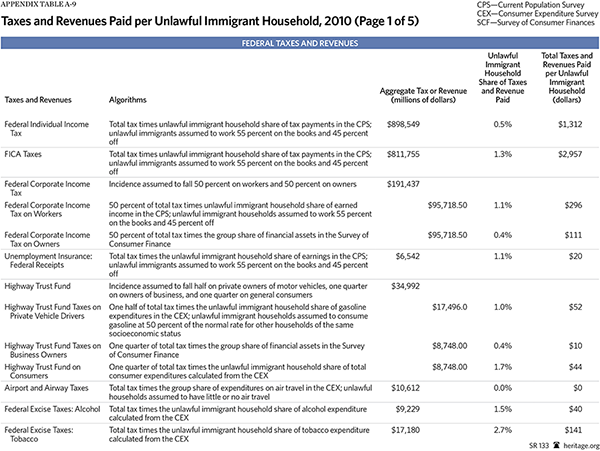
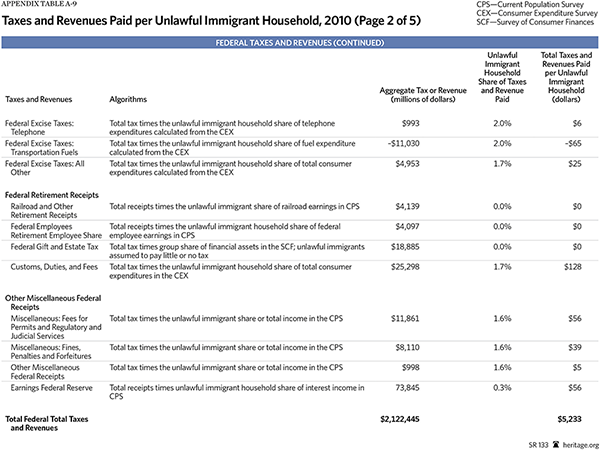
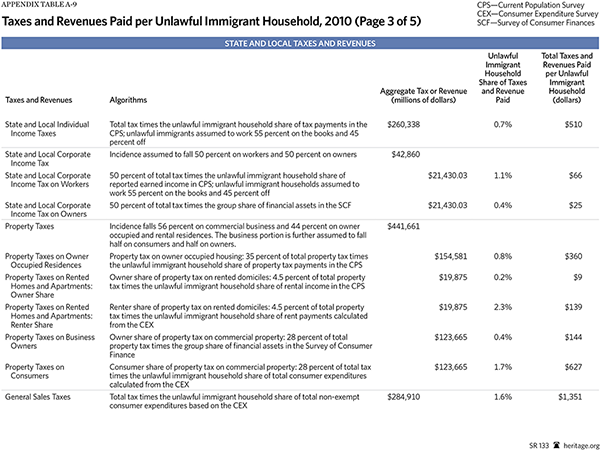
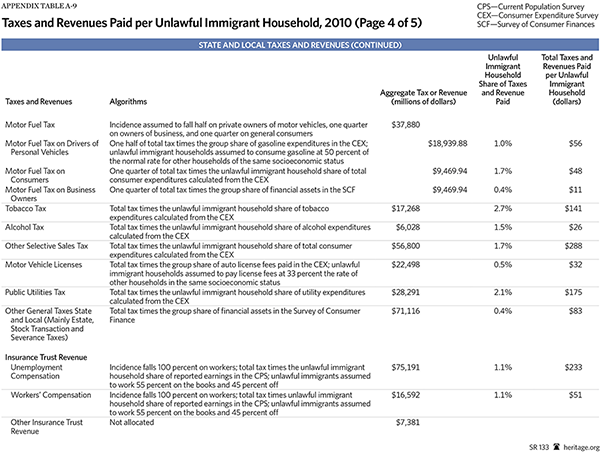
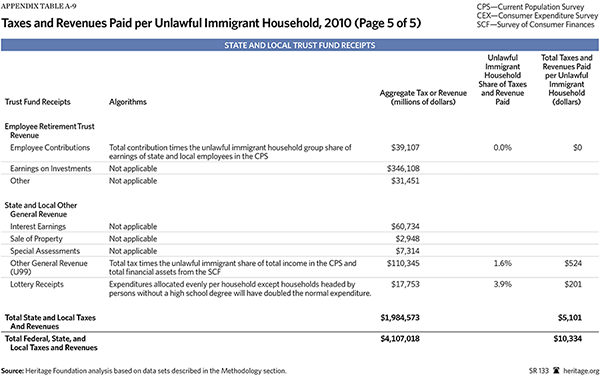
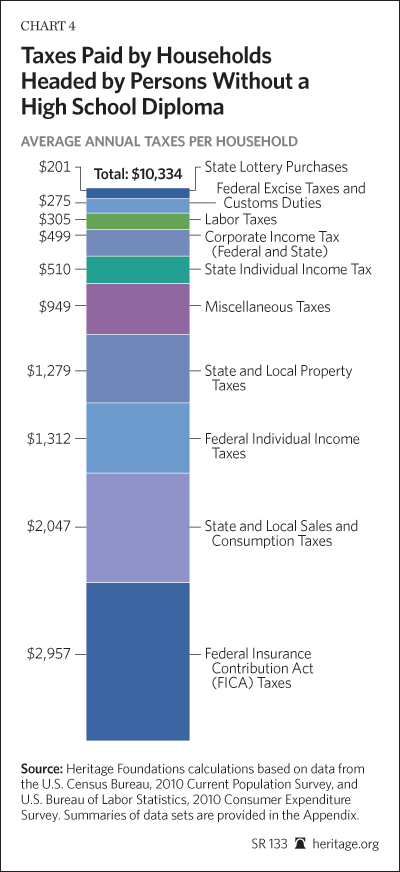
Taxes and Revenues Paid by Unlawful Immigrant Households. Appendix Table 9 details the estimated taxes and revenues paid by unlawful immigrant households in 34 categories. The results are summarized in Chart 4.
Total federal, state, and local taxes paid by unlawful immigrant households averaged $10,334 per household in 2010. Federal and state individual income taxes comprised less than a fifth of total taxes paid. Instead, taxes on consumption and employment (FICA) produced nearly half of the tax revenue for unlawful immigrant households. (The analysis assumes that workers pay both the employer and employee share of FICA tax.) Property taxes (shifted to renters) and corporate profit taxes (shifted to workers) also form a significant part of the tax burden.
It is worth noting that FICA and income taxes reported in Chart 4 have been reduced because the analysis assumes that 45 percent of unlawful immigrant earners work off the books. If all unlawful immigrant workers were employed on the books, these tax payments would increase significantly.
Balance of Taxes and Benefits. On average, unlawful immigrant households received $24,721 per household in government benefits and services in FY 2010. This figure includes direct benefits, means-tested benefits, education, and population-based services received by the household but excludes the cost of public goods, interest on the government debt, and other payments for prior government functions. By contrast, unlawful immigrant households on average paid only $10,334 in taxes. Thus, unlawful immigrant households received $2.40 in benefits and services for each dollar paid in taxes.
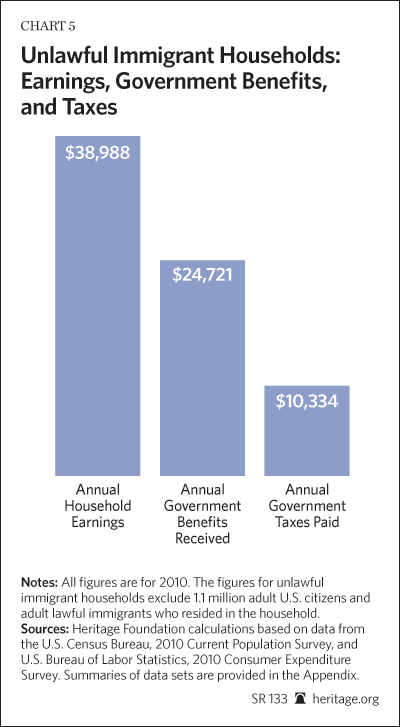
Many politicians believe that households that maintain steady employment are invariably net tax contributors, paying more in taxes than they receive in government benefits. Chart 5 shows why this is not the case. As Table 2 shows, unlawful immigrant households have high levels of employment, with 1.6 earners per household and average annual earnings of around $39,000 for all workers in the household. But with average government benefits at $24,721, unlawful immigrant households actually receive 63 cents in government benefits for every dollar of earnings.
To achieve fiscal balance, with taxes equal to benefits, the average unlawful immigrant household would have to pay nearly two-thirds of its income in taxes. Given this simple fact, it is obvious that unlawful immigrant households can never pay enough taxes to cover the cost of their current government benefits and services.
Net Annual Fiscal Deficit. The net fiscal deficit of a household equals the cost of benefits and services received minus taxes paid. As Chart 6 shows, when the costs of direct and means-tested benefits, education, and population-based services are counted, the average unlawful immigrant household had a fiscal deficit of $14,387 (government expenditures of $24,721 minus $10,334 in taxes) in 2010.
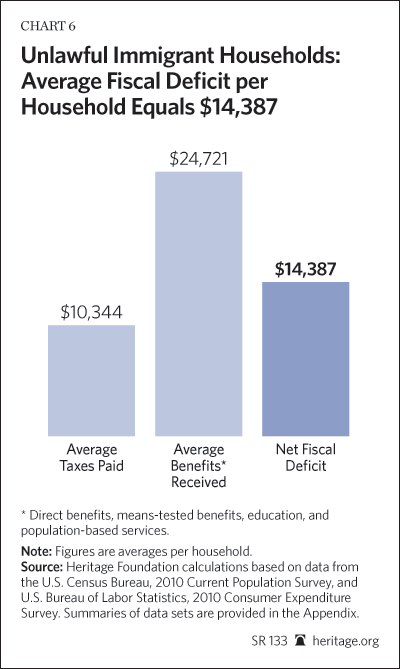
For the average unlawful immigrant household to become fiscally solvent, with taxes paid equaling immediate benefits received, it would be necessary to increase the household’s tax payments to 240 percent of current levels. Alternatively, unlawful immigrant households could become solvent only if all means-tested welfare and nearly all public education benefits were eliminated.
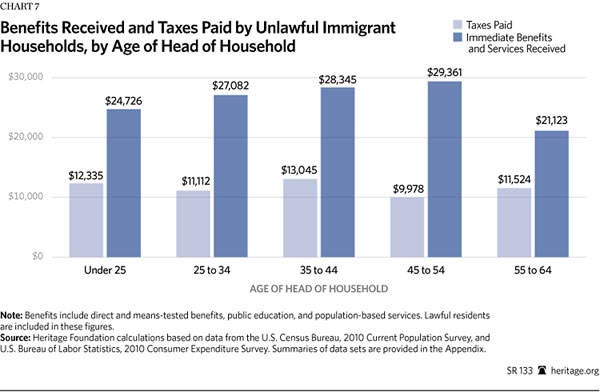
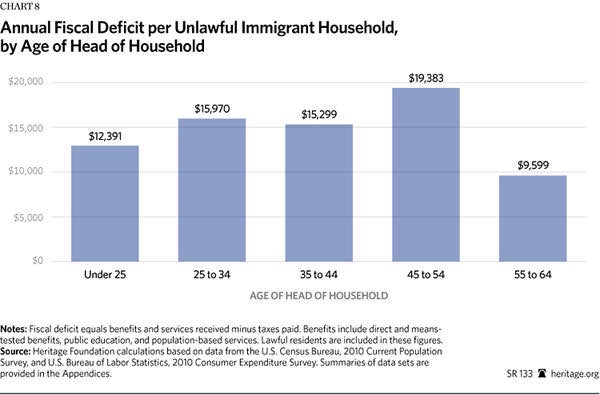
Age Distribution of Benefits and Taxes Among Unlawful Immigrant Households. Many political decision makers believe that because unlawful immigrant workers are comparatively young, they can help to relieve the fiscal strains of an aging society. Charts 7 and 8 show why this is not the case. These charts separate the 3.44 million unlawful immigrant households into five categories based on the age of the head of household.
The benefits levels in Chart 7 again include direct benefits, means-tested benefits, public education, and population-based services. These benefits start at $24,726 for households headed by immigrants under 25 years of age and rise to $28,000 to $29,000 per year as the heads of household reach their 30s and 40s. The increase is driven by a rise in the number of children in each home. As the age of the head of household reaches the late 50s, the number of children in the home falls, and benefits dip to around $21,000 per year. Annual tax payments vary little by the age of the householder, averaging around $12,000 per year in each age bracket.
The critical fact shown in Chart 7 and Chart 8 is that, for each age category, the benefits received by unlawful immigrant households exceed the taxes paid. At no point in the life cycle does the average unlawful immigrant household pay more in taxes than it takes out in benefits. In each age category, unlawful immigrant households receive roughly $2.00 in government benefits for each dollar paid in taxes. Between ages 45 and 54 (generally considered prime earning years), unlawful immigrants actually receive nearly $3.00 in benefits for each dollar paid in taxes.
These figures belie the notion that government can relieve financial strains in Social Security and other programs simply by importing younger unlawful immigrant workers. The fiscal impact of an immigrant worker is determined far more by education and skill level than by age. Low-skill immigrant workers (whether lawful or unlawful) impose a net drain on government finance as soon as they enter the country and add significantly to those costs every year they remain.
Chart 8 shows the net fiscal deficits (benefits minus taxes) for each age category. The fiscal deficits reach a peak of over $19,000 per year for households with heads between 45 and 54 years old. The average deficit then falls to around $10,000 per year for households with heads between 55 and 64 years old. The number of unlawful immigrant households declines sharply with age. There are very few unlawful immigrant households with heads over age 65.
Aggregate Annual Net Fiscal Costs. In 2010, 3.44 million unlawful immigrant households appeared in the Current Population Survey. The average net fiscal deficit per household was $14,387. Most experts believe that at least 350,000 more unlawful immigrant households resided in the U.S. but were not reported in the CPS.
Assuming that the fiscal deficit for these unreported households was the same as the fiscal deficit for the unlawful immigrant households in the CPS, the total annual fiscal deficit (total benefits received minus total taxes paid) for all 3.79 million unlawful immigrant households together equaled $54.5 billion (the deficit of $14,387 per household times 3.79 million households). This sum includes direct and means-tested benefits, education, and population-based services.
Adjusting Future Deficit Estimates for the Potential Impact of the 2010 Recession
In 2010, the economy was in recession. In a recession, overall income and tax revenue will be lower; some benefits such as unemployment insurance will be dramatically higher. The recession may therefore have increased the fiscal deficit of unlawful immigrant households relative to non-recession years. However, the impact of a recession will not be uniform across all socioeconomic groups.
Evidence suggests that the recession had at best a modest impact on the fiscal status of unlawful immigrant households. For example, while incomes dropped significantly during the recession, most of the drop occurred in property income; the National Income and Product Accounts (which measure the whole economy) show that total nominal wages fell by only 2.3 percent from 2008 to 2010. Some 95 percent of the income of unlawful immigrant households comes from wages.
As measured in the CPS, the constant-dollar income of the average unlawful immigrant household was the same in 2010 as in 2006. The measured income of unlawful immigrants may be comparatively stable during a recession because unemployed unlawful immigrants return to their country of origin and thereby disappear from Census records. If the average unlawful immigrant household lost income during the recession, the drop was modest.
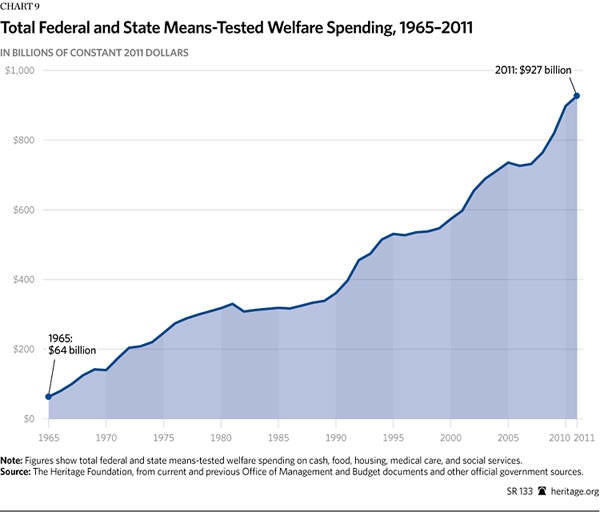
What about welfare spending? There is a popular conception that welfare spending is like a roller coaster, rising sharply during a recession and falling when the recession ends. This pattern applies somewhat to food stamps but not to means-tested welfare in general. Historically, overall means-tested spending does rise during a recession but does not fall noticeably when the recession ends.
This pattern is shown in Chart 9, which shows total means-tested spending over time adjusted for inflation. The chart shows a dramatic rise in costs over time. Periods of rapid increase are followed by spending plateaus, but there are no significant dips in post-recession periods. Following this pattern, the Obama budget shows that constant-dollar per capita means-tested spending will not decline over the next decade.[30]
Despite these caveats, the estimates of future fiscal deficits in the rest of this paper will be adjusted for the potential effects of the recession on the 2010 data. Specifically, the analysis reduces future unemployment benefits and food stamp benefits by 66 percent and 25 percent below 2010 levels, respectively. These adjustments are firmly backed by evidence and included in all of the figures on future-year deficits.
In addition, the analysis increases future tax payments by unlawful immigrants upward by 5 percent and reduces future overall means-tested welfare benefits downward by 5 percent to compensate for the impact of the recession on 2010 data. These adjustments are more speculative; their impact is shown separately in Table 7 and in subsequent tables. The latter adjustments reduce projected future fiscal deficits among unlawful immigrant households by about 5 percent.
Fiscal Impact of Amnesty or “Earned Citizenship”
In recent years, Congress has considered various comprehensive immigration reform proposals. One key feature of these proposals has been that all or most current unlawful immigrants would be allowed to stay in the U.S. and become U.S. citizens.
In most legislative proposals, amnesty or “earned citizenship” would have three phases. First, unlawful immigrants would be placed in a provisional status that would allow them to remain in the U.S. lawfully. After five to 10 years in this provisional status, most former unlawful immigrants would be granted legal permanent resident (LPR) status. After five years in LPR status, the individuals would be allowed to become U.S. citizens. The interval between initial amnesty and citizenships would thus stretch for 10 to 15 years or longer.
The fiscal impact of amnesty would vary greatly depending on the time period examined. The present paper will analyze the fiscal consequences of amnesty in four phases.
- Phase 1: Current Law or Status Quo. This is the fiscal status at the present time prior to amnesty.
- Phase 2: The Interim Phase. This phase would include the period in which amnesty recipients were in provisional status followed by the first five years of legal permanent residence. During the interim phase, tax revenues would go up as more former unlawful immigrants began to work “on the books” but would remain barred from receiving means-tested welfare and probably Obamacare health care subsidies. The overall net fiscal cost of the former unlawful immigrant population could be expected to decline slightly during this period. The length and programmatic boundaries of the interim phase would obviously vary in different bills, but five to 15 years would be typical.
- Phase 3: Full Implementation of Amnesty. At the end of the interim phase, all amnesty bills would provide the amnesty recipients (former unlawful immigrants) with full eligibility for more than 80 means-tested welfare programs as well as health care subsidies under the Affordable Care Act (ACA, or Obamacare). The resulting increase in outlays would be substantial.
- Phase 4: Retirement Years. Under current law, unlawful immigrants are not eligible for Social Security and Medicare benefits. All amnesty legislation would allow recipients of amnesty to obtain eligibility for these programs. Immediately after enactment of amnesty, former unlawful immigrants with jobs would begin to acquire credits toward future Social Security and Medicare eligibility. Once they had completed 40 quarters (or 10 years) of employment, they would become eligible for Social Security old age benefits and Medicare and would begin to receive benefits upon reaching retirement age.
In addition, under amnesty, former unlawful immigrants would probably be able to obtain credits toward Social Security for work performed during their time of unlawful residence if they could show that FICA taxes were paid for that employment. Upon reaching the retirement age of 67, former unlawful immigrants could begin to draw Social Security and Medicare benefits. They would also be eligible for other government benefits such as public housing, food stamps, and Medicaid payments for nursing home care. Given the present age of most unlawful immigrants, these retirement costs would not emerge for several decades, but they would be quite large when they did occur.
The median age for current adult unlawful immigrants is 34. Given amnesty, these individuals would, on average, continue to pay taxes and receive benefits for five decades. From this perspective, placing a temporary moratorium on receipt of welfare and Obamacare subsidies would have only a marginal impact on overall costs.
Postponing the date when amnesty recipients would receive welfare and Obamacare is important politically, however, because it hides the real costs of amnesty during the all-important 10-year “budget window” employed by the Congressional Budget Office (CBO). Concealing the actual costs of legislation by delaying program expansion until after the end of the CBO 10-year budget window is a time-worn legislative trick in Washington. This budgetary ploy can be very effective in deluding both politicians and the public about the actual costs of legislation.
When amnesty legislation is rolled out in Congress, the public should expect to see this strategy of deception in full force. Nearly all fiscal discussion in Congress and the press will focus on the deliberately low temporary costs during the interim phase. The far more significant longer-term costs will be largely ignored. No politician who is serious about government spending and deficits should promote this deceptive budgetary gimmick, and the public should not be fooled by it.
Fiscal Changes During the Interim Phase
During the initial interim phase, amnesty would produce three fiscal changes: an increase in tax revenue, an increase in Social Security and Medicare payments for disabled persons and survivors, and an increase in some population-based costs as former unlawful immigrants become more comfortable using government services. This section analyzes those changes.
As noted earlier, nearly all experts believe that much employment of unlawful immigrants occurs “off the books.” Since taxes are not paid on this hidden employment, the result is less government revenue. After amnesty, former unlawful immigrants would have a strong incentive to shift to “on the books” employment because a consistent record of official employment would probably be necessary for these individuals to remain in the U.S. and to progress toward LPR status.
The present analysis assumes that at the current time, some 55 percent of unlawful immigrant workers work on the books and 45 percent work off the books. The analysis assumes that if amnesty were enacted, 95 percent of future employment of the former unlawful immigrants would occur on the books. This would increase payments of federal and state income taxes, FICA taxes, and other labor taxes (such unemployment and work compensation fees) by nearly $14 billion per year.
After amnesty, former unlawful immigrants would be able to seek employment more openly and compete for a wider range of positions. Research from the amnesty in 1986 shows that this led to significant wage gains among amnesty recipients, but amnesty also made individuals eligible for unemployment insurance and other programs that support individuals when they are not working, and this led to a decline in employment among workers receiving amnesty. These two effects offset each other, yielding a net overall gain of 5 percent in wages.[31] This 5 percent wage boost is included in the analysis and leads to an increase in income, FICA, and consumption tax payments of around $3 billion per year.
The analysis also assumes that after amnesty, former unlawful immigrant households would be more likely to use highways, autos, and airports; this would result in an increase in related taxes and fees of roughly $800 million per year. Overall, amnesty would increase tax revenue and fees by some $18 billion per year, or roughly $4,700 per former unlawful immigrant household.
As former unlawful immigrants began to work on the books using their own names and Social Security numbers, their eligibility for unemployment insurance benefits and workers’ compensation would increase. These benefits would likely reach levels comparable to those received by lawful immigrant families with similar socioeconomic characteristics.[32]
In contrast to old age benefits, Social Security disability, survivor’s benefits, and related Medicare are available well before retirement age. Any amnesty law would make former unlawful immigrants and their kin eligible for these benefits. For example, a worker who had five years of credited employment would receive disability benefits if he became unable to work. Ten years of credited employment would make a worker’s family eligible for survivor benefits upon the worker’s death.
Former unlawful immigrants would begin to receive these benefits not long after amnesty, and the number receiving benefits would grow over time. Eventually, the per-household disability and survivor benefits and accompanying Medicare received by former unlawful immigrant households would likely equal the benefits received by current lawful immigrants: roughly $1,600 per household per year.[33] However, during the first decade after amnesty, the benefit increase would be much less.
The present analysis assumes that unlawful immigrant households are less likely to use certain government services such as parks, highways, libraries, and airports than are lawful households with the same level of income. However, if unlawful immigrant households are granted amnesty, their utilization of these government services will increase.
Over time, the use of these services by former unlawful households would likely match their use by current lawful immigrant and non-immigrant households with similar demographic characteristics. The resulting increase in population-based government services would raise government costs by around $2,000 per household. Increased receipt of unemployment insurance, workers’ compensation, disability benefits, and population-based services would increase the overall government benefits received by former unlawful immigrant households by nearly $11 billion per year.
Fiscal Impact of the Full Implementation of Amnesty
Federal and state governments currently spend over $830 billion per year on more than 80 different means-tested aid programs. U.S.-born children of unlawful immigrants are currently eligible for aid through most of these programs, but foreign-born children who are in the country unlawfully and adult unlawful immigrants are generally not eligible for aid.
At present, all amnesty proposals would make adult unlawful immigrants and their foreign-born children fully eligible for these programs at the end of the waiting period. As a result, welfare benefits in former unlawful households would likely rise to the level of those received by current lawful immigrant families with similar socioeconomic characteristics. This would mean a sharp increase in benefits from programs such as Temporary Assistance for Needy Families, the Earned Income Tax Credit, Medicaid, public housing, and food stamps.
Overall, annual welfare costs would rise to around $13,700 per household among former unlawful households. Amnesty would increase overall welfare costs to $51 billion per year for this group.[34]
Starting in 2014, the Affordable Care Act will begin to provide various forms of aid, including expanded Medicaid, premium subsidies, and cost-sharing subsidies, to lower-income individuals who lack health insurance. Unlawful immigrants are currently ineligible for this aid. Under amnesty or “earned citizenship,” unlawful immigrants would obtain full eligibility for these benefits, although access to aid would probably be delayed until the end of the interim period.
The estimated cost of benefits from Obamacare to former unlawful immigrant households would be $24 billion per year.[35]
Overall Fiscal Impact of Amnesty or “Earned Citizenship”
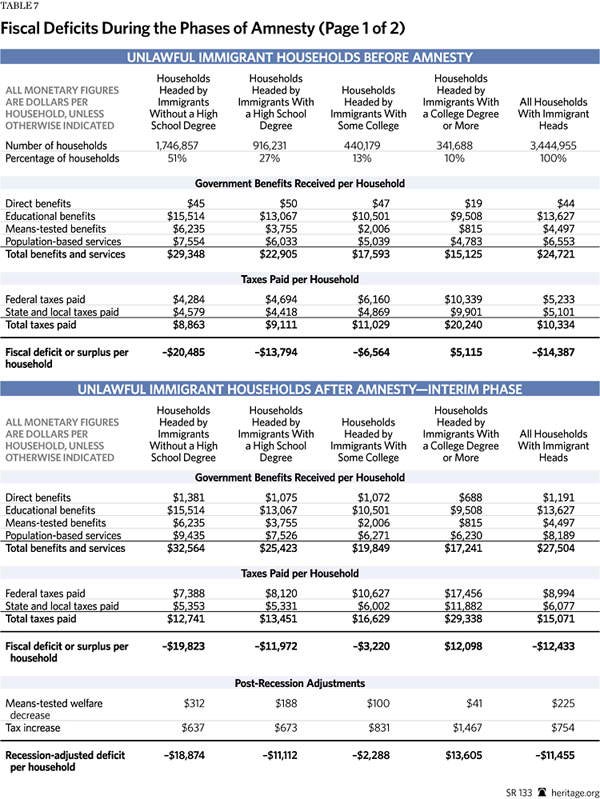
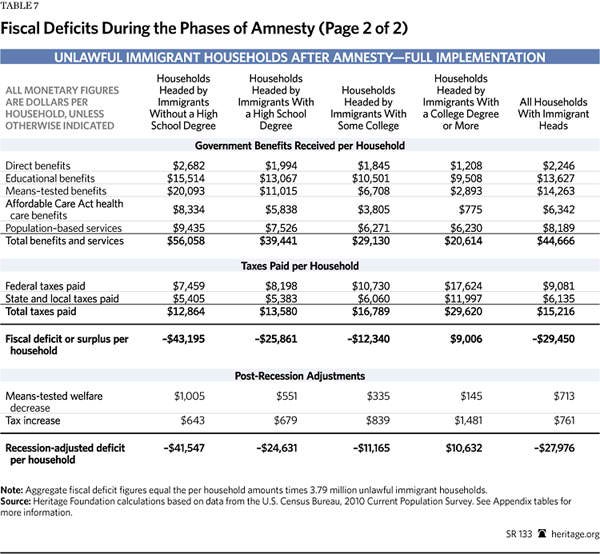
Table 7 and Chart 10 show the average fiscal balances of unlawful immigrant households during the three stages: before amnesty, the interim period after amnesty, and full implementation of amnesty. At the current time, before amnesty, the average unlawful immigrant household has a fiscal deficit of $14,387 per year. During the interim period immediately following amnesty, tax revenues would increase more than government benefits, and the average fiscal deficit among the former unlawful households would fall to $11,455 per household.[36] (This figure, however, assumes there would be no expansion of government medical care to poor amnesty recipients for a full decade after amnesty is enacted; this seems politically implausible.)
When the interim phase ends, amnesty recipients would become eligible for means-tested welfare and health care benefits under the Affordable Care Act. At that point, annual government benefits would rise to around $43,900 for the average former unlawful immigrant household.[37] Tax payments would remain at around $16,000 per household, yielding an annual fiscal deficit (benefits minus taxes paid) of around $28,000 per household.[38]
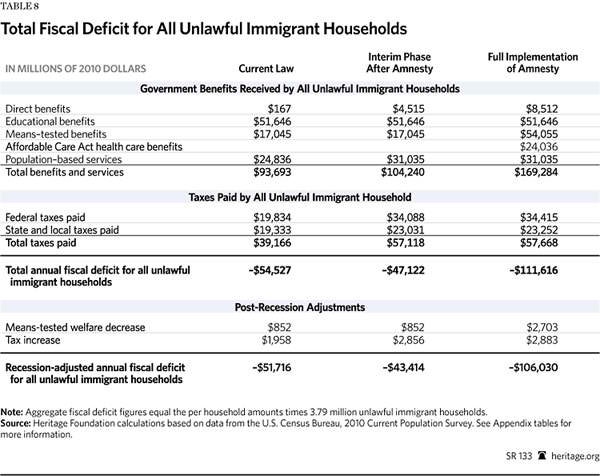
Table 8 and Chart 11 show the aggregate fiscal balance for all unlawful immigrant households in the three stages.[39] All of the figures in Table 8 and Charts 10 and 11 are adjusted for future inflation and presented in 2010 constant dollars.[40]
- Before amnesty, all unlawful immigrant households together received $93.7 billion per year in government benefits and services and paid $39.2 billion, yielding an aggregate annual deficit of $54.5 billion.
- In the interim phase after amnesty, aggregate government benefits and services would rise to $103.4 billion per year, but tax revenue would rise to around $60 billion; as a consequence, the aggregate annual deficit would fall slightly to $43.4 billion. (These figures include all post-recession adjustments.)
- At the end of the interim phase, former unlawful immigrant households would become fully eligible for means-tested welfare and health care benefits under the Affordable Care Act. Total annual government benefits and services would soar to $166.5 billion; tax revenue would remain at around $60.5 billion, yielding an aggregate annual fiscal deficit of $106 billion. (These figures include all post-recession adjustments.)
Long-Term Retirement Costs for Former Unlawful Immigrants Under Amnesty
One major fiscal consequence of amnesty is that nearly all current unlawful immigrants would become eligible for Social Security and Medicare and would receive benefits from those programs when they reach retirement age. In most cases, the few who did not obtain eligibility for Social Security and Medicare would receive support from Supplemental Security Income and Medicaid. As they aged, former unlawful immigrants would also be eligible for nursing home care funded by Medicaid. The cost of these benefits would be quite large.
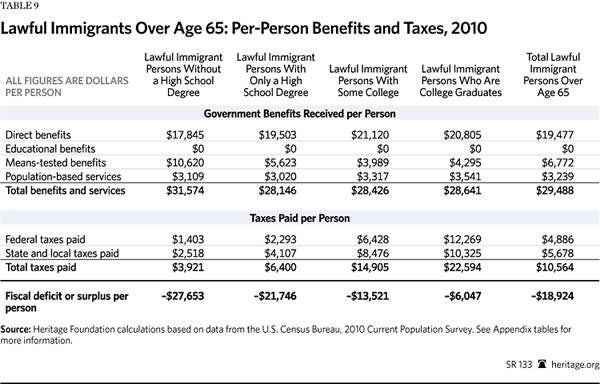
One way to estimate the future retirement costs of unlawful immigrants under amnesty is to examine the average benefits currently received by lawful immigrants over age 65 whose education levels match those of unlawful immigrants. The figures for lawful immigrants over age 65 are shown in Table 9. (Once individuals move into retirement years, it is more accurate to analyze persons rather than households. Thus, in contrast to the previous tables in this paper, Table 9 presents benefits and taxes per immigrant rather than per household.)
Table 9 reports the actual benefits received and taxes paid per person in 2010 by lawful immigrants over age 65. For example, the average elderly lawful immigrant who lacked a high school degree received $31,574 in annual government benefits and services and paid $3,921 in taxes, yielding an annual fiscal deficit of $27,653.
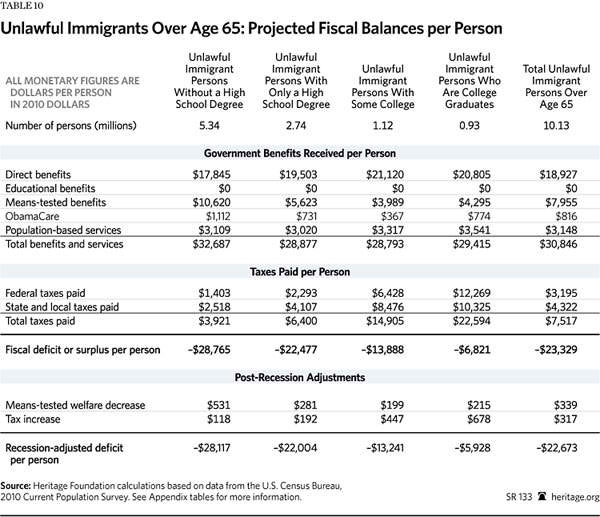
Table 10 shows the estimated fiscal balances of adult amnesty recipients over age 65 if amnesty were enacted. (Again, the estimated benefits received and taxes paid are modeled on the actual current figures for elderly lawful immigrants.) Given amnesty, the average former unlawful immigrant age 65 or older would receive around $30,500 per year in benefits. Social Security benefits would come to around $10,000 per year; Medicare would add another $9,000. Retirees would receive some $7,600 in means-tested welfare, primarily in Medicaid nursing home benefits, general Medicaid, and SSI.[41] Population-based benefits would add another $3,100 in costs. The average amnesty recipient would pay around $7,800 in taxes, resulting in an average annual fiscal deficit of roughly $22,700 per retiree.[42] (All figures include post-recession adjustments.)
Retiring at age 67, amnesty recipients could be expected to receive benefits for 18 to 19 years on average.[43] This would produce a long-term fiscal deficit cost of $420,000 per person during retirement.
Parents of Amnesty Recipients
An additional consequence of legalization is that when amnesty recipients become citizens, they would have the unconditional right to bring their parents to the U.S. On arrival, the parents would become legal permanent residents with the right to obtain citizenship in five years. They would probably be eligible for Obamacare immediately; after five years, they would become eligible for Supplemental Security Income (at $8,500 per year) and other means-tested benefits. The right to bring parents to the U.S. to become citizens is automatic and unlimited. As many as 15 million to 20 million parents would become eligible for legal permanent residence under an amnesty law.
Not all of these individuals would come to the U.S. Historically, one parent has been brought to the U.S. for every seven non-elderly adult immigrants. Following this ratio, 10 million adult amnesty recipients would be likely to bring 1.5 million parents to the country as lawful residents.
For the most part, these parents would be poor and heavily dependent on taxpayers. Typical costs would probably be around $20,000 per parent per year for welfare and medical care. The parents would be elderly on arrival and might receive benefits for five to 10 years. In that case, the total cost to taxpayers would be about $260 billion.[44]
Lifetime Fiscal Costs of Unlawful Immigrants Following Amnesty
Most discussions of the fiscal consequences of unlawful immigration and amnesty focus on the next five to 10 years, but amnesty, by definition, entitles each unlawful immigrant with lifetime eligibility for the full array of government benefits. The average adult unlawful immigrant is currently 34 years old and has a life expectancy of 50 more years. Under amnesty, that means 50 years of government benefits funded by U.S. taxpayers.
If amnesty is enacted, some 3.74 million unlawful immigrant households will be given eventual access to welfare and other entitlements. Of course, amnesty recipients will not live forever. Given standard mortality statistics, it is possible to estimate the decline in the number of adult unlawful immigrants/amnesty recipients and corresponding households year by year in the future.[45] Table 7 gave the estimated fiscal deficit per household during the interim period and during full implementation of amnesty. By combining these per-household deficit figures with the expected number of surviving households headed by amnesty recipients, it is possible to estimate the total lifetime fiscal costs of current unlawful households after amnesty but prior to retirement age.
Table 10 gave the estimated per-person fiscal cost of amnesty recipients after retirement. Combining this per-person deficit figure with the expected number of surviving individuals in each year after retirement yields an estimated total fiscal cost for amnesty recipients after retirement. If the total fiscal costs in the interim, full amnesty, and retirement periods are summed, the result is the estimated lifetime fiscal costs for unlawful immigrants after amnesty.
Table 11 shows the lifetime costs. During the interim phase, the former unlawful immigrant households would generate a net fiscal cost (benefits received minus tax paid) of $550 billion. During the full phase of amnesty (but prior to retirement), the net fiscal deficit would be $1.99 trillion. After retirement, amnesty recipients would run a fiscal deficit of $3.45 trillion. Parents brought into the U.S. by amnesty recipients would generate another $260 billion in net fiscal costs.
If amnesty were enacted tomorrow, current unlawful immigrants (along with their minor children and dependent parents) would subsequently receive around $9.4 trillion in government benefits over the span of a lifetime.[46] The lifetime taxes paid by the amnesty recipients would come to $3.1 trillion. The total fiscal deficit (total benefits received minus taxes paid) would equal $6.3 trillion. (All figures are in constant 2010 dollars.)
Put another way, if amnesty were enacted, the average adult unlawful immigrant would subsequently receive $898,000 in government benefits over the course of a lifetime and pay $306,000 in taxes over the same period. The average lifetime fiscal deficit (benefit received minus taxes paid) would be around $592,000 for each adult amnesty recipient.
These costs would be spread over the lifetime of the amnesty recipients. More than 90 percent of the fiscal costs would occur during a 50-year period after amnesty.
The policy of barring amnesty recipients from receiving welfare and Obamacare during a short period after amnesty is usually trumpeted as a means of eliminating the potential costs of amnesty. In reality, postponing access to government benefits has only a marginal impact on fiscal costs. If amnesty recipients are barred from receiving welfare aid and health benefits from Obamacare for 13 years after initial amnesty, the total fiscal deficit falls by 12 percent from $7.1 trillion to $6.3 trillion.
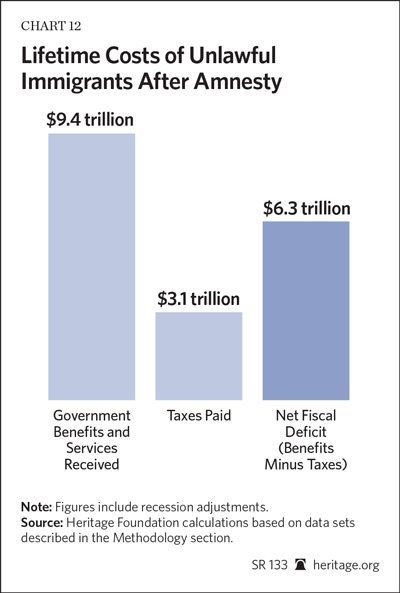
How Much Does Amnesty Add to Existing Costs?
The $6.3 trillion figure represents the lifetime fiscal costs of unlawful immigrant households after amnesty. It does not represent the increased fiscal costs caused by amnesty alone. The increased lifetime costs caused by amnesty would equal $6.3 trillion minus the estimated lifetime fiscal costs of unlawful immigrant households under current law. Calculating the latter figure is not easy.
As noted, there currently are few unlawful immigrants over age 50. This may be because unlawful immigrants, arriving as young adults over the past 15 to 20 years, have simply not yet reached age 50. It may also be that unlawful immigrants, being unable to access the U.S. welfare and retirement systems under current law, simply go back to their country of origin as they get older. If one assumes that under current law, most unlawful immigrants will return to their country of origin around age 55, the lifetime fiscal costs of unlawful immigrants under current law are comparatively low: only around $1 trillion. The net increased fiscal costs generated by amnesty would be around $5.3 trillion ($6.3 trillion minus $1 trillion.)
However, there is a loophole in existing law that may allow many or most current unlawful immigrants to achieve lawful status and obtain benefits from the welfare system, Social Security, Medicare, Obamacare, and Medicaid. Given access to the U.S entitlement system, it seems unlikely that most unlawful immigrants would choose to return to their native countries empty-handed. The loophole in existing law is the open-ended provision of green cards to the foreign-born parents of U.S. citizens.
A majority of adult unlawful immigrants have children who were born in the U.S. When these children reach age 21, they can immediately demand that their unlawful immigrant parents be given a green card (legal permanent residence) as parents/immediate relatives. The number of green cards (or visas for legal permanent residence) available to parents is unlimited, and the visas will be granted almost automatically. Once the parent spends five years in legal permanent residence, he immediately becomes eligible for welfare and citizenship. As a legal resident, the parent may also be given credit in the Social Security system for work performed previously as an unlawful immigrant. This would contribute to future eligibility for Social Security and Medicare benefits.
If millions of unlawful immigrants utilize the parent visa option in the future and thereby obtain legal permanent residence and/or citizenship, the cost to the taxpayers could run into the trillions. Thus, ironically, the increased fiscal costs generated by amnesty may be reduced by the fact that many unlawful immigrants already have potential long-term access to Social Security, Medicare, Obamacare, and means-tested welfare through a loophole in current law.
Policymakers who are interested in future government solvency should close this loophole by prohibiting any individual who has fathered or mothered a child in the U.S while he or she was an unlawful immigrant from ever receiving an immediate relative/parent visa. This would prevent unlawful immigrants from gaining legal permanent residence and citizenship simply because they have children born in the U.S.
Will the Children of Unlawful Immigrants Repay Their Parents’ Costs?
It is often argued that the fiscal burdens produced by unlawful immigrants are irrelevant because their children will become vigorous net tax contributors, producing fiscal surpluses that will more than pay for any costs their parents have generated. This is not true. As this paper has shown, the degree to which the children of unlawful immigrants become net fiscal contributors (rather than tax consumers) will depend largely on their educational attainment. Moreover, even if all of the children of unlawful immigrants became college graduates, they would be very hard-pressed to pay back $6.3 trillion in net costs even over the course of their entire lives.
Of course, not all of these children will graduate from college; many will have substantially lower educational achievements. The National Educational Longitudinal Study (NELS) reports the intergenerational educational attainment of U.S. children based on the educational attainment of their parents.[47] Table 12 uses data from the NELS survey to predict the educational attainment of the children of unlawful immigrants based on ethnicity and their parents’ education level. Although these children will clearly do better than their parents, 18 percent are still likely to leave school without a high school degree, and only 13 percent are likely to graduate from college.
Based on this level of educational attainment, the children of unlawful immigrants, on average, will become net tax consumers rather than net taxpayers: The government benefits they receive will exceed the taxes they pay.[48] If the children of unlawful immigrants were adults today and had the levels of education predicted in Table 12, they would have an average fiscal deficit of around $7,900 per household.
The odds that the children of unlawful immigrants, on average, will become strong net taxpayers are minimal. Indeed, for these children even to become fiscally neutral (taxes paid equal to benefits received), the percent that graduate from college would need to rise to 30 percent, and the percent without a high school diploma would need to fall to 10 percent. In reality, unlawful immigrants will be net tax consumers, placing a fiscal burden on other taxpayers not only in the first generation, but in the second generation as well.
Will Unlawful Immigrants Contribute to the Solvency of Social Security and Medicare?
It is often argued that unlawful immigrants have a positive impact on U.S. taxpayers because they pay taxes into the Social Security trust fund. Unlawful immigrant workers do pay Social Security or FICA taxes; the median unlawful immigrant worker currently pays about $2,070 per year in FICA taxes.[49]
If amnesty encouraged all former unlawful immigrant workers to work on the books, that number would rise to around $3,770. A worker who paid this amount into Social Security for 35 years would contribute $132,000. Upon retiring, this individual would receive $14,650 per year in Social Security benefits and $10,074 per year in Medicare benefits.[50] Over an average span of 18 years of retirement, the total Social Security and Medicare benefits received by this individual would come to $445,000. Thus, the retirement benefits received would be more than three times the taxes paid into the system.[51]
Moreover, taxes and benefits must be viewed holistically. It is a mistake to look at the Social Security trust fund in isolation. Unlawful immigrants draw benefits from many other government programs besides Social Security. If an individual pays $3,700 per year into the Social Security trust fund but simultaneously draws a net $25,000 per year (benefits minus taxes) out of general government revenue, the solvency of government has not improved. In reality, other taxpayers, including many Social Security recipients, will face higher taxes in order to subsidize unlawful immigrant households.
Caveat: Understating Future Welfare and Medical Benefits
The fiscal analysis in this paper, presented in Table 11 and Chart 12, takes the current fiscal status of households and projects that status forward into future years. All figures are presented in 2010 dollars. One problem with this approach is that it assumes that means-tested welfare and medical benefits per household will grow no faster than general inflation for the next 50 years. Households are assumed to receive no greater welfare benefits in 2035 than they did in 2010. The historical record suggests that this is highly unlikely.
For nearly every year for the past half-century, welfare spending per capita has increased much faster than inflation. In fact, constant-dollar spending per person today is six times higher than it was 50 years ago. By contrast, the analysis in this paper assumes that for the next 50 years, per capita welfare benefits will rise no faster than inflation. While this assumption simplifies the analysis, it is likely an underestimate.
The same problem applies to medical benefits. The inflation rate is higher for medical care than for other goods. In addition, when new medical treatment and technology become available, they are provided through government medical programs, broadening the scope of service and increasing costs for taxpayers. The main analysis in this paper assumes that the cost of medical services per beneficiary will grow no faster than inflation for the next 50 years. This is likely an underestimate and probably results in an understatement of future spending.[52]
Additional Factors That Could Raise Future Fiscal Costs
There are a number of demographic, economic, and policy factors that could raise the short-term and long-term fiscal deficit estimates presented in Tables 8 and 11. These include demographic variables that affect the number of amnesty recipients and their dependents and economic factors that would affect the future economic growth rate.
- Potential Undercount of Unlawful Immigrants. The analysis in this paper assumes that there are currently 11.5 million immigrants in the U.S. based on DHS estimates. The DHS estimates that there are some 10.4 million unlawful immigrants recorded in Census surveys and 1.1 million more who are not reported by the Census. While the first number is based on firm evidence, the second is merely a guess. The number of unlawful immigrants who reside in the U.S. but do not respond to Census surveys may be far more than 1.1 million. These extra unlawful immigrants would tend to be single adults, since children would show up in birth or school records.
The fact that the actual number of unlawful immigrants can be far greater than 11.5 million is another reason that amnesty is a bad policy. If the number of unlawful immigrants is actually 20 percent greater than the 11.5 million assumed in this paper, the long-term fiscal cost of amnesty would increase proportionately, adding perhaps $1.2 trillion to the lifetime fiscal deficit.[53]
- Cheating in Amnesty. In the 1986 amnesty, an estimated 25 percent of the amnesties granted were fraudulent.[54] In the past 20 years, the underground industry producing fraudulent documents has grown vastly larger and more sophisticated. In the proposed new amnesty, the fraud rate could be as high as or higher than in 1986, resulting in far more than 11 million amnestied individuals. If cheating increased the number of amnesty recipients by 25 percent, the added lifetime fiscal cost would be $1.5 trillion.
- Exclusion of 20 Percent of Unlawful Immigrants During the Interim and Full Implementation Phases of the Analysis. This analysis estimates costs for persons living in households headed by unlawful immigrants during the interim and full amnesty phases. However, about 20 percent of unlawful immigrants do not reside in those households. Any fiscal costs associated with that 20 percent are therefore omitted from the analysis; this is likely to lead to an underestimate of total costs. (In the retirement phase, however, all unlawful immigrants who were adults in 2010 are included in the analysis, not just those residing in unlawful immigrant households.)
- Spouses and Children Brought from Abroad. Any amnesty or legalization will automatically grant amnesty recipients the right to bring spouses and minor children from abroad to reunify families. This reunification would probably occur during the interim phase. Once admitted to the U.S., the children would receive heavily subsidized public education; over time, both children and spouses would become eligible for means-tested welfare and Obamacare. The number of spouses and dependent children who would be brought into the U.S as a result of amnesty is uncertain, but the added fiscal costs could be considerable. If an additional one million spouses and dependent children were brought to the U.S as a result of amnesty, the added lifetime fiscal cost would be around $600 billion.
- Triggering of Additional Chain Migration by Relatives. Social and kinship networks are important factors in increasing immigration flows. Once unlawful immigrant households were legalized, there would be an increased tendency for brothers, sisters, and cousins to migrate from abroad both lawfully and unlawfully to join their relatives. Thus, other things being equal, amnesty would likely increase future unlawful immigration, in turn increasing future fiscal costs.
- Amnesty as a Magnet for Future Unlawful Immigration. The U.S. enacted a much smaller amnesty for unlawful immigrants in 1986. The public was promised that the 1986 amnesty was a one-time affair that would never be repeated. Despite this promise, the 1986 amnesty was probably a factor in encouraging the subsequent surge in unlawful immigration, since it signaled that the U.S. might take a lenient stance toward unlawful immigrants in the future. If the U.S now enacts a second amnesty, it will have established a very strong precedent for serial amnesties. The prospect of recurring amnesties would certainly make future unlawful immigration more attractive, drawing more unlawful immigrants into the country and significantly increasing long-term fiscal costs.
- Dynamic Effects of Increased Fiscal Deficits. The core analysis in this paper indicates that amnesty would increase net governmental costs by perhaps $6.3 trillion. These added costs would have to be financed either by higher taxes or by greater government borrowing leading to a higher national debt. Higher taxes or a higher national debt in turn would reduce future economic growth, thereby lowering future tax revenues. This dynamic feedback effect has not been included in the calculations in the paper.
Additional Factors That Could Reduce Future Fiscal Costs
- Reduced Number of Amnesty Recipients. Not all current unlawful immigrants will necessarily receive amnesty. Some individuals may not apply. Others may not be able to demonstrate residence. Others will fail the criminal background check. If 10 percent of the unlawful immigrants currently residing in the U.S. did not receive amnesty and instead returned to their country of origin, lifetime fiscal costs would be reduced proportionately, resulting in roughly $600 billion in savings.
- Increased Emigration. The core long-term analysis presented in Table 11 assumes an emigration rate of 5 percent among amnesty recipients. Certainly, amnesty recipients would have a very strong financial incentive to remain in the country to receive nearly free education for their children and eventually obtain access to welfare, Obamacare, Social Security, and Medicare. Nonetheless, some amnesty recipients would return to their country of origin.
If this emigration occurred before the individual obtained eligibility for Social Security and Medicare, there would be considerable cost savings. If the individual emigrated after establishing eligibility for those programs, the cost saving would be less. The core analysis assumes that 5 percent of unlawful immigrants would emigrate before establishing eligibility for Social Security and Medicare. If, instead, 10 percent emigrated, the lifetime fiscal costs might be reduced by roughly $300 billion.
- Increased Recessionary Adjustments. The recession in 2010 may have reduced tax payments from unlawful immigrants and temporarily increased welfare assistance. In response to this issue, the analysis has reduced estimated future benefits in the unemployment insurance and food stamp programs, increased future estimated tax revenues by 5 percent, and decreased long-term receipt of welfare benefits by 5 percent. All of these adjustments are included in the lifetime fiscal cost figures appearing in table 11.
There is considerable evidence that the last two adjustments are not absolutely necessary; nonetheless, some may argue that even greater post-recessionary adjustments should be considered. In general, an increase of one percentage point in the tax loss estimate, combined with a one percentage point decrease in the future welfare benefits will lower the estimated lifetime deficit of amnesty recipients by 1 percent. Setting the post-recessionary tax loss estimate at 10 percent (rather than 5 percent) and reducing future welfare benefits by 10 percent (rather than 5 percent) would thus increase the estimated lifetime fiscal deficit by an added 5 percent, or $315 billion.
Altogether, the variables discussed above suggest that the number of amnesty recipients and dependents may well be much higher than the numbers assumed in this paper. This could have a considerable impact on future costs. If the number were 30 percent greater, for example, the lifetime fiscal costs could rise to nearly $9 trillion.
Possible Indirect Fiscal Effects
The analysis presented in this paper reflects the direct fiscal impact of unlawful immigrants. It reports the benefits received and taxes paid by those immigrants. However, there can be other indirect fiscal consequences of unlawful immigration. For example, unlawful immigrants augment the U.S. labor force and thereby expand the gross domestic product (GDP) by roughly 2 percent. Unlawful immigrants themselves capture most of the gain from this expanded production through their wages, and taxes on the immigrants’ wages and consumption are already incorporated into the analysis.
But the owners of businesses that employ the unlawful immigrants also receive income from their investment in the enterprises in which the immigrants work. The difficulty lies in determining whether the investment in enterprises employing unlawful immigrants represents a net expansion of the stock of investment or merely a reallocation of investment that would have existed without the presence of the immigrant labor. New investment would be unlikely to occur unless the increased labor supply had reduced wages. New net investment would result in new income, and this added income would be taxed by government in a variety of ways. Even though the unlawful immigrants would not pay these taxes themselves, their employment would have triggered the extra tax revenue.
In the extreme case, one might assume that all of the investment associated with unlawful immigrant labor represents a net increase in capital stock. Since unlawful immigrants earn about 2 percent of all wages in the U.S. economy, this might coincide with a 2 percent increase in business profits and capital income. If this were the case, the result would be a roughly $8.5 billion increase in federal, state, and local revenue from a variety of different taxes; this indirect tax gain would amount to roughly $2,500 per unlawful immigrant household.[55] The future lifetime tax gain due to unlawful immigrants from this source could be around $280 billion. Again, the difficulty with this calculation lies in the assumption that all of the capital invested in the employment of unlawful immigrants represents a net increase rather than a reallocation of capital stock.
Conversely, there may be other indirect effects that substantially increase the fiscal drain created by unlawful immigrants. An additional indirect fiscal effect would occur if the presence of immigrant workers in the U.S. reduced the wages or employment of competing non-immigrant workers. For example, Harvard professor George Borjas has estimated that the very large influx of immigrant workers between 1980 and 2000 lowered the wages of the average non-immigrant worker by 3.2 percent. In particular, the disproportionate influx of low-skill immigrants was estimated to reduce the wages of low-skill native workers by 8.9 percent.[56]
The National Research Council has estimated that a 10 percent increase in the labor supply lowers the wage for similarly skilled workers by 3 percent.[57] In 2010, unlawful immigrants constituted about 25 percent of employed adults with less than a high school degree. This means that unlawful immigrants have increased the labor supply of individuals without a high school degree by one-third.
Applying the NRC ratio, the wages of legal residents without a high school diploma have been reduced by about 10 percent due to unlawful immigration. This amounts to $23.1 billion in lost income, or about $2,300 per worker. A wage loss of $23 billion would result in around $8 billion in lost tax revenue (income, FICA, and consumption taxes) and perhaps $6 billion in added welfare costs. The overall indirect fiscal loss to government would be around $14 billion per year.
Another potential impact of unlawful immigration is a reduction in employment rates for native workers. This may be of particular importance for youth and black male workers.[58] Heavy competition for jobs can discourage less-skilled workers, leading them to leave the labor force. As immigrants become the majority of workers in certain occupations, networking and word-of-mouth regarding job openings[59] may increasingly exclude natives. Finally, the abundance of unlawful immigrant labor helps employers to avoid expending effort on recruiting potential U.S.-born workers from underemployed areas, such as Appalachia or Midwestern industrial towns.
Even if just one out of five unlawful immigrant workers displaced a legal resident from a job, wage losses could amount to $14 billion annually. The tax loss and added welfare costs from this could reach $10 billion per year. The lifetime fiscal loss to government due to wage and job loss among U.S. citizens and lawful immigrants might be around $790 billion. In addition, the decline in jobs and wages for lower-skill males may contribute to the long-term decline in marriage in low-income communities; the social and fiscal consequences of this decline are enormous.
Because figures are imprecise, none of the indirect fiscal effects discussed in this section is included in the fiscal analysis in this paper.
Potential Economic Gains and Losses from Unlawful Immigration
While the fiscal consequences of unlawful immigration are strongly negative, some argue that unlawful immigrants create economic benefits that partially compensate for the net tax burdens they create. For example, it is frequently argued that unlawful immigration is beneficial because unlawful immigrant workers expand the gross domestic product. While it is true that unlawful immigrants enlarge GDP by roughly 2 percent, the problem with this argument is that the immigrants themselves capture most of the gain from expanded production in their own wages.[60] Metaphorically, while unlawful immigrants make the American economic pie larger, they themselves consume most of the slice that their labor adds.
The central issue in the debate over the costs and benefits of unlawful immigration is not whether such immigration makes U.S. GDP larger (clearly, it does), but whether unlawful immigration raises the post-tax income of the average non-immigrant American. Given the very large net tax burden that unlawful immigrants impose on U.S. society, such immigrants would have to raise the incomes of non-immigrants to a remarkable degree to have a net beneficial effect.
Policy Issues
There are approximately 3.7 million unlawful immigrant households in the U.S. These households impose a net fiscal burden (benefits received minus taxes paid) of around $54.5 billion per year. The fiscal cost of unlawful and low-skill immigrants will be increased in the future by government policies that increase the number of low-skill immigrants, the immigrants’ length of stay in the U.S., or the access of unlawful immigrants to government benefits. Conversely, fiscal costs will be reduced by policies that decrease these variables.
Clearly, immigration policy has enormous fiscal implications. Consistent with principles for immigration reform laid out elsewhere.[61] immigration policy should be changed in the following ways to reduce the costs of unlawful and low-skill immigration to the taxpayer:
- Enforce the current law against employing unlawful immigrants. Unlawful immigrants are predominantly low-skilled. Over time, they impose large costs on the taxpayer. In 1986, the U.S. gave amnesty to 3 million unlawful aliens in exchange for a prohibition on hiring unlawful immigrants in the future. While amnesty was granted, the law against hiring unlawful immigrants was never enforced in more than a token manner. As a result, there are now at least 11.5 million unlawful immigrants in the U.S.
Because the majority of unlawful immigrants come to the U.S. for jobs, serious enforcement of the ban on hiring unlawful labor would substantially reduce the employment of unlawful aliens and encourage many to leave the U.S. Reducing the number of unlawful immigrants in the nation and limiting the future flow of unlawful immigrants would also reduce future costs to the taxpayer.
-
Do not grant amnesty to unlawful immigrants. Granting amnesty to unlawful immigrants would confer entitlement to welfare, Social Security, and Medicare for the amnesty recipients. This would be ruinously expensive to U.S. taxpayers.
- Eliminate “back door amnesty.” This could be done by closing the loophole in current law that permits unlawful immigrants to become U.S. citizens because they have U.S.-born children. Roughly half of unlawful immigrants have U.S.-born children. When these children reach age 21, they can demand that their parents be given a visa, which grants the parents legal permanent residence; this gives the parents access to the U.S. welfare system and puts them on a potential path to U.S. citizenship. This provision, which operates automatically and cannot be stopped under current law, could be called “back door amnesty.”
Current law should be changed to prohibit any individual who conceived or gave birth to a child in the U.S. while that individual was unlawfully present in the U.S. from ever receiving an immediate relative/parent visa that provides legal permanent residence. Closing that loophole could save the taxpayers trillions of dollars over the long term.
-
Ensure that any guest worker program is truly temporary and not a gateway to welfare entitlements.[62] A program that involves long-term residence and permits access to welfare, Social Security, Medicare, and public education would be enormously expensive for the U.S. taxpayer. For example, if the “guest worker” brings school-age children with him, each child will generate, on average, $12,300 in public education costs that must be funded by U.S. taxpayers. Similarly, even if formally barred from receiving welfare assistance, guest workers’ low-income families would be likely to receive aid simply because welfare agencies would be reluctant to deny services to families that appear to be in need of aid. Finally, bringing a family into the U.S. would make it far less likely that the guest worker would actually return home, and continued residence in the U.S would increase fiscal costs.
Granting U.S. citizenship to guest workers’ children born in the U.S. would raise fiscal costs. If a child born to a guest worker is granted U.S. citizenship, that child immediately becomes entitled to Medicaid coverage and a full range of other welfare benefits. Further, granting the child citizenship makes it less likely that the guest worker’s parents will actually leave the U.S. and thereby increases taxpayer costs. To the extent permitted by the Fourteenth Amendment to the Constitution, the law establishing the guest worker programs should clearly stipulate that children born to guest workers would be treated in the same manner as children of diplomats—that is, they would be citizens of their parents’ country of origin rather than citizens of the United States.
- Reduce the number of legal permanent residence visas based on kinship and increase the number of visas allocated to high-skilled workers.[63] Under current law, the visa lottery and visa preferences for adult brothers, sisters, and parents tend to bring a high proportion of low-skill immigrants into the U.S. While low-skill immigrants create a fiscal burden for U.S. taxpayers, high-skill immigrants tend to pay more in taxes than they receive in benefits.
The legal immigration system should be altered to greatly reduce the number of low-skill immigrants entering the country and increase the number of new entrants with high levels of education and skills that are in demand by U.S. firms. The visa lottery and all preferences for brothers, sisters, parents, and relatives other than spouses and minor children should be eliminated and replaced by new skill-based visas. Parents would be able to visit children in the U.S. as guests but not as legal permanent residents with access to welfare.
Conclusion
The United States offers enormous economic opportunities and societal benefits. Countless more people would immigrate to the U.S. if they had the opportunity. Given this context, the U.S. must be selective in its immigration policy. Policymakers must ensure that the interaction of welfare and other financial transfer programs with immigration does not expand the fiscally dependent population, thereby imposing large costs on American society.
Current immigration policies with respect to both lawful and unlawful immigration encourage the entry of a disproportionate number of poorly educated immigrants into the U.S. As these low-skill immigrants (both lawful and unlawful) take up residence, they impose a substantial tax burden on U.S. taxpayers. The benefits received by unlawful and low-skill immigrant households exceed taxes paid at each age level; at no point do these households pay more in taxes than they receive in benefits.
Current immigration practices, both lawful and unlawful, operate like a system of transnational welfare outreach, bringing millions of fiscally dependent individuals into the U.S. This policy needs to be changed. U.S. immigration policy should encourage high-skill immigration and strictly limit low-skill immigration. In general, government policy should limit immigration to those who will be net fiscal contributors, avoiding those who will increase poverty and impose new costs on overburdened U.S. taxpayers.
Robert Rector is Senior Research Fellow in the Domestic Policy Studies Department at The Heritage Foundation. Jason Richwine, PhD is Senior Policy Analyst for Empirical Studies in the Domestic Policy Studies Department at The Heritage Foundation.
_______________________________________
Appendix A: General Methodology
This paper seeks to estimate the total cost of benefits and services received and the total value of taxes paid by all households, by non-immigrant households, by households headed by lawful immigrants, and in particular by households headed by unlawful immigrants. The fiscal analysis presented in this paper is based on three core methodological principles: comprehensiveness, fiscal accuracy, and transparency.
- Comprehensiveness. The analysis seeks to cover all government expenditures and all taxes and similar revenue sources for federal, state, and local government. Comprehensiveness helps to ensure balance in the analysis. If a study covered only a limited number of government spending programs or just a portion of taxes, the omissions might bias the conclusions.
- Fiscal Accuracy. A cardinal principle of the estimation procedure employed for each expenditure program or category in the analysis is that if the procedure is replicated for the whole U.S. population, the resulting estimated expenditure will equal actual expenditures on the program according to official budgetary documents. The same principle is applied to each tax and revenue category. Altogether, the estimating procedures used in this paper, if applied to the entire U.S. population, will yield figures for total government spending and revenues that match the real-life totals presented in budgetary sources.
- Transparency. Specific calculations were made for 34 separate tax and revenue categories and over 74 separate expenditure categories. Since conclusions can be influenced by the assumptions and procedures employed in any analysis, we have endeavored to make the mechanics of the analysis as transparent as possible to interested readers by describing the details of each calculation in Appendices D and E and Appendix Tables A8 and A9.
Accounting Framework
The accounting framework used in the present analysis is the same framework employed by the National Research Council (NRC) of the National Academy of Sciences in its study of the fiscal impact of immigration, The New Americans.[64] Following the NRC framework, the present study:
- Excludes public goods costs such as defense and interest payments on government debt;
- Treats population-based or congestible services as fully private goods and assigns the cost of those services to immigrant households based either on estimated use or the immigrant share of population.[65]
- Includes the welfare and educational costs of immigrant and non-immigrant minor children and assigns those costs to the child’s household;
- Assigns the welfare and educational costs of minor U.S.-born children of immigrant parents in the immigrant household; and
- Assigns the cost of means-tested and direct benefits according to the self-reported use of those benefits in the U.S. Census Bureau’s Current Population Survey (CPS).
Clearly, any study that does not follow this framework may reach very different conclusions. For example, any study that excludes the welfare benefits and educational services received by the minor U.S.-born children of unlawful immigrant parents from the costs assigned to unlawful immigrant households will reach very different conclusions about the fiscal consequences of unlawful immigration.
An important principle in the analysis is that receipt of means-tested benefits and direct benefits was not imputed or assigned to households arbitrarily. Rather, the cost of benefits received was based on the household’s self-report of benefits in the CPS.[66] For example, the cost of the food stamp benefits received is based on the food stamp benefits data provided by the household. If the household stated that it did not receive food stamps, then the value of food stamps within the household would be zero. The main exception to this rule was benefits from the Affordable Care Act (ACA), or Obamacare; since these benefits did not exist in 2010, they had to be imputed in future years.
Household-Based Analysis
This paper uses the 3.44 million households headed by unlawful immigrants, rather than the unlawful immigrant population as a whole, as the basis of its analysis. By using the household as the unit of analysis, Heritage follows the procedure employed by the National Research Council. Since many variables are not available at the individual level, analysis at the household level is methodologically simpler.
However, one problem with this choice is that 2.08 million unlawful immigrants do not reside in households headed by unlawful immigrants. These individuals, who reside mainly in homes headed by lawful immigrants, are therefore not included in the present fiscal analysis for the interim and full amnesty periods. While this exclusion almost certainly reduces the fiscal cost figures presented in this paper, including these individuals is beyond the scope of the current analysis. (On the other hand, the fiscal analysis of retirement years includes all current adult unlawful immigrants.)
There were some 1.1 million U.S.-born adult citizens and lawful immigrants residing in unlawful immigrant households in 2010, and they represent 8 percent of the persons in those households. These individuals were excluded from the analysis. They are not included in the demographic information on unlawful immigrant households; the benefits they receive and taxes they paid were not included in the fiscal analysis. Exclusion or inclusion of these individuals makes little difference in the fiscal balance of unlawful immigrant households.
Undercount of Unlawful Immigrant Households
The Department of Homeland Security (DHS) assumes that approximately one in 10 unlawful immigrants (1.15 million persons) do not appear in Census records. The Heritage Foundation analysis assumes that the fiscal balance and demography of this undercounted population is similar to the unlawful immigrant population appearing in the CPS.
To adjust for the undercounted population, the number of unlawful immigrant households in the analysis was increased from 3.44 million households (which appear in the CPS) to 3.79 million. Aggregate government benefits and taxes are assumed to increase in the same proportion as the number of households so that the average fiscal cost per unlawful immigrant household was unaffected.
Unless otherwise noted, aggregate fiscal figures for unlawful immigrant households appearing in this paper have been increased to include the undercounted unlawful immigrant households. It is quite possible that the number of uncounted unlawful immigrants residing in the U.S. exceeds 1.15 million.
Data Sources
Data on federal expenditures were taken from Office of Management and Budget, Budget of the United States Government, Fiscal Year 2013: Historical Tables, Table 3.2.[67]
Data on federal taxes and revenues were taken from Office of Management and Budget, Budget of the United States Government, Fiscal Year 2012: Analytical Perspectives, p. 220, Table 15.5.[68]
State and local aggregate expenditures and revenue data were taken from the U.S. Census Bureau’s “State and Local Government Finances Summary: 2010,” Appendix, p. 6, Table A-1.[69]
Additional information on state and local spending categories was taken from U.S. Census Bureau, Federal, State, and Local Governments: 1992 Government Finance and Employment Classification Manual.[70]
Data on state and local pension funds are from U.S. Census Bureau, 2010 Annual Survey of Public Pensions: State & Local Data, Table 1, “National Summary of State and Local Public-Employee Retirement System Finances, Fiscal Year 2010.”
Data on the distribution of benefits and distribution of some taxes were taken from the U.S. Census Bureau’s Current Population Survey of March 2011 (which covers 2010).[71] Additional data on public school attendance were taken from the October 2010 CPS.[72] Data on household expenditure were taken from the Bureau of Labor Statistics Consumer Expenditure Survey (CEX) for 2010.[73]
Data on state spending on Medicaid are drawn from Centers for Medicare and Medicaid Services, Office of the Actuary, 2010 Actuarial Report on the Financial Outlook for Medicaid.[74]
Detailed information on means-tested spending was taken from Congressional Research Service, “Cash and Noncash Benefits for Persons with Limited Income: Eligibility Rules, Recipient and Expenditure Data, FY 2002–FY 2004.” This report provides important information on state and local means-tested expenditures from states’ and localities’ own financial resources as distinct from expenditures funded by federal grants in aid.[75] FY 2010 data were taken from Office of Management and Budget, Budget of the United States Government, Fiscal Year 2012: Appendix. These data are summarized in Robert Rector’s testimony before the Budget Committee of the United States House of Representatives on May 3, 2012, “Examining the Means-tested Welfare State: 79 Programs and $927 Billion in Annual Spending.”[76]
Data on Medicaid expenditures for different recipient categories were taken from the Medicaid Statistical Information System (MSIS) as published in Table 13.24, “Medicare & Medicaid Statistical Supplement,” 2010 Edition.[77] Data on Medicaid expenditures in institutional long-term care facilities were taken from “Medicare & Medicaid Statistical Supplement,” 2011 Edition.[78]
Data on the education levels of elderly persons in institutional long-term care facilities were taken from the National Long Term-Care Survey (NLTCS).[79] Data on the number of individuals residing in nursing homes in the average month and the number of Medicaid recipients in nursing homes were taken from the 2004 National Nursing Home Survey (NNHS).
Data on household financial assets based on the age and education level of the household were taken from the 2010 Survey of Consumer Finance.[80]
Appendix B: Identifying Unlawful Immigrants in the CPS
The Department of Homeland Security estimates that there were 11.5 million foreign-born persons residing unlawfully in the U.S. in January 2011.81 These estimates are based on the fact that the number of foreign-born persons appearing in U.S. Census surveys is considerably greater than the number of foreign-born persons who are permitted to reside legally in the U.S., according to immigration records.
For example, in January 2011, some 31.95 million foreign-born persons (who entered the country after 1980) appeared in the annual Census survey, but the actual number of corresponding lawful foreign-born residents in that year (according to government administrative records) was only 21.6 million.82 DHS estimates that the difference—some 10.35 million foreign-born persons appearing in the Census American Community Survey (ACS)—is made up of unauthorized or unlawful residents. DHS further estimates that an additional 1.15 million unlawful immigrants resided in the U.S. but did not appear in the Census survey, for a total of 11.5 million unlawful residents.83
DHS employs a “residual” method to determine the characteristics of the unlawful immigrant population. First, immigration records are used to determine the gender, age, country of origin, and time of entry of all foreign-born lawful residents. Foreign-born persons with these characteristics are subtracted from the total foreign-born population in Census records; the leftover or “residual” foreign-born population is assumed to be unlawful. This procedure enables DHS to estimate the age, gender, country of origin, date of entry, and current U.S. state of residence of the unlawful immigrant population in the U.S.
The current Heritage Foundation study uses the Department of Homeland Security reports on the characteristics of unlawful immigrants to identify in the Current Population Survey (CPS) of the U.S. Census a population of foreign-born persons who have a very high probability of being unlawful immigrants. (The CPS is used in place of the similar ACS because it has more detailed income and benefit information.)84 The procedures used to select unlawful immigrants within the CPS included the following.
- The unlawful immigrant population identified in the CPS was matched as closely as possible to the age, gender, country of origin, date of entry, and state of residence of the unlawful immigrant population identified by DHS.
- Foreign-born persons who were current or former members of the armed forces of the U.S. or current employees of federal, state, and local governments were assumed to be lawful residents.
- Since it is unlawful for unlawful immigrants to receive government benefits such as Social Security, Supplemental Security Income, Medicare, and Medicaid, individuals reporting personal enrollment in these programs were assumed to be lawful.
- Immigrant heads of households residing in public or subsidized housing were assumed to be lawful, although other members in the household might be unlawful immigrants.
- Principles of consistency were applied within families; for example, children of lawful residents were assumed to be lawful.
- Since a U.S. citizen can obtain lawful resident status for a spouse, the foreign-born spouses of U.S citizens were assumed to be lawful.
- Foreign-born persons in occupations that involve high levels of professional regulation and legal credentialing, such as doctors, pharmacists, lawyers, and nurse practitioners, were assumed to be lawful.
- Under immigration law, virtually all Cuban immigrants will be lawful; all Cuban immigrants in the CPS were therefore assumed to be lawful.
- Unlawful immigrants were assumed to be slightly less likely to own a home and to have slightly lower incomes than lawful immigrants with matching characteristics.
The end result of these procedures was to produce an estimated unlawful immigrant population that matched the Department of Homeland Security figures as closely as possible across a range of variables. A comparison of Heritage Foundation and DHS figures is provided in Appendix Table A1.
Appendix C: Calculating Aggregate Federal, State, and Local Spending
Aggregate federal expenditures at the subfunction level were taken from Budget of the United States Government, Fiscal Year 2013: Historical Tables. These data are presented in Appendix Table 2. State and local aggregate expenditures were based on data from the U.S. Census Bureau survey of government.
Two modifications were necessary to yield an estimate of the overall combined spending for federal, state, and local government. First, some $608 billion in state and local spending is financed by grants-in-aid from the federal government. Since these funds are counted as federal expenditures, recording them again as state and local expenditure would constitute a double count. Consequently, federal grants-in-aid were deducted from the appropriate categories of state and local spending.
A second modification involves the treatment of market-like user fees and charges at the state and local levels. These transactions involve direct payment of a fee in exchange for a government service: for example, payment of an entry fee at a park. User fees are described in the federal budget in the following manner:
In addition to collecting taxes…the Federal Government collects income from the public from market-oriented activities and the financing of regulatory expenses. These collections are classified as user charges, and they include the sale of postage stamps and electricity, charges for admittance to national parks, premiums for deposit insurance, and proceeds from the sale of assets, such as rents and royalties for the right to extract oil from the Outer Continental Shelf.[85]
In the federal budget, user fees are not counted as revenue, and the government services financed by user fees are not included in the count of government expenditures. As the Office of Management and Budget states:
[User charges] are subtracted from gross outlays rather than added to taxes on the receipts side of the budget. The purpose of this treatment is to produce budget totals for receipts, outlays, and budget authority in terms of the amount of resources allocated governmentally, through collective political choice, rather than through the market.[86]
In contrast, Census tabulations of state and local government finances include user fees as revenue and also include the cost of the service provided for the fee as an expenditure.[87] The most prominent user fees treated in this manner by the Census are household payments to public utilities for water, power, and sanitation services.
But market-like user fee payments of this type do not involve a transfer of resources from one group to another or from one household to another. In addition, government user fee transactions do not alter the net fiscal deficit or surplus of any household (defined as the cost of total government benefits and services received minus total taxes and revenues paid) because each dollar in services received will be matched by one dollar of fees paid. Finally, determining who has paid a user fee and received the corresponding service is very difficult.
For these reasons, this paper has applied the federal accounting principle of excluding most user fees from revenue tallies, as well as excluding the services funded by the fees from the count of expenditures, to state and local government finances. This means that user charges and fees were removed from both the revenue and expenditure tallies for state and local government. As noted, the inclusion or exclusion of these user fees has no effect on the fiscal deficit figures for unlawful immigrant households or any other group presented in this paper.
Appendix Tables A3, A4, and A5 show the deductions of federal grant-in-aid and user fee expenditures that yielded the state and local expenditure totals used in this analysis.
Appendix D: Estimating the Allocation of Government Benefits and Taxes
This appendix describes the way specific benefits and taxes were allocated among households.
Estimating Government Benefits
In most cases, the dollar cost of direct and means-tested benefits received by unlawful immigrant households and other households was estimated by the dollar cost of benefits received as reported in the Census Bureau’s Current Population Survey.
Underreporting of Benefits. One problem with this approach is that the CPS underreports receipt of most government benefits. This means that the aggregate dollar cost of benefits for a particular program as reported in the CPS is generally less than the actual program expenditures according to government budgetary data.
To be accurate, any fiscal analysis must adjust for the underreporting of benefits. This has been done in prior studies; for example, the National Research Council’s study of the fiscal costs of immigration, The New Americans, made a similar adjustment for such underreporting.[88]
The current analysis adjusts for underreporting in the CPS with a simple mathematical procedure that increases overall spending on any given program to equal actual aggregate spending levels and increases the household benefits reported in the CPS for each category of households in an equal proportion. For example, the equation for lawful immigrant households would be:
Etx = total expenditures for program x reported in the CPS;
Elx = expenditures for program x for lawful immigrant households reported in the CPS;
Ebx = total expenditures for program x according to independent budgetary sources; and
Hl = number of lawful immigrant households in the CPS.
The share of expenditures received by lawful immigrant households as reported in the CPS would equal Elx/Etx; the actual expenditures allocated to lawful immigrant households would be estimated to equal (Elx/Etx) times Ebx; and the average benefit per household from the program received by lawful immigrant households would equal (Elx/Etx) times (Ebx /Hl).
For example, if the CPS reported that lawful immigrant households received 10 percent of food stamp benefits and the total expenditures on food stamps according to budgetary data were $20 billion, lawful immigrant households would be estimated to receive $2 billion in food stamp benefits. If there were 4 million lawful immigrant households, the average food stamp benefit per lawful household would equal $2 billion divided by 4 million households, or $500.
The key assumption behind this underreporting adjustment procedure is that non-immigrant, lawful immigrant, and unlawful immigrant households underreport receipt of welfare and other government benefits at roughly the same rate. For example, if receipt of food stamps is underreported by 15 percent in the CPS for the overall population, the adjustment procedure assumes that each of the subgroups of non-immigrant, lawful immigrant, and unlawful immigrant households in the CPS would underreport food stamp receipt by 15 percent. The average level of food stamp benefits among each group of households as reported in the CPS is then adjusted upward by this ratio to compensate for the underreporting.[89]
This is a conservative assumption with respect to unlawful immigrant households, since those households might have a higher tendency to underreport benefits, particularly if the benefit was obtained unlawfully. However, since there is no evidence to suggest that unlawful immigrant households underreport government benefits to the Census at a rate different from that of the general population, this procedure appears to be valid as an estimating technique.
Education Expenditures. The average cost of public education services was calculated in a somewhat different manner since the CPS reports whether an individual is enrolled in a public school but does not report the cost of education services provided.[90] Consequently, data from the Census survey of governments were used to calculate the average cost of public primary and secondary education per pupil in each state.[91]
Pupil attendance data were obtained from the October 2010 CPS. The total governmental cost of primary and secondary schooling for each household was then estimated by multiplying the number of enrolled pupils in the household by the average cost per pupil in the state where the household resides. This procedure yielded estimates of total public primary and secondary education costs for non-immigrant and immigrant households in each demographic group in the CPS and for the whole CPS population.
Average costs of public post-secondary education per pupil were developed in the same manner. To determine the aggregate public cost of public post-secondary education, all tuition payments were deducted from the state and local expenditure totals. Figures on college attendance were taken from the March 2011 CPS.
Medicare Expenditures. There is often confusion concerning the calculation of the cost of Medicare benefits by the Census. The Census makes no effort to determine the costs of medical treatments given to a particular person. Instead, it calculates the average cost of Medicare benefits per recipient and assigns that cost to each person in the CPS who reports Medicare enrollment.
The current analysis allocated Medicare spending among households according to the share of Medicare spending assigned to the household in the CPS. The analysis adjusted for underreporting of Medicare with the same procedures used for other direct benefits.
Medicaid Expenditures. As with Medicare, the Census makes no effort to record the costs of specific medical treatments given to a particular person under the Medicaid program. Instead, it calculates the average cost of Medicaid benefits per person for a particular demographic/beneficiary group. For example, per capita Medicaid costs for children are very different from those for the elderly. The Census assigns the appropriate per capita Medicaid costs to each individual who reports coverage in the CPS according to the individual’s beneficiary class: for example, elderly, children, non-elderly able-bodied adults, and disabled adults.[92]
In the analysis, Medicaid spending was divided into three categories: Medicaid benefits for persons in the general population, Medicaid spending on elderly and non-elderly persons in nursing homes and other long-term care facilities, and disproportionate share hospital (DSH) payments.
-
Medicaid Benefits Among Persons in the General Population. Data from the Medicaid Statistical Information System (MSIS) were used to determine aggregate Medicaid expenditures among the general non-institutionalized population for the following recipient categories: the elderly; non-elderly disabled adults; non-disabled, non-elderly adults; and youth under 18. The aggregate expenditures for each recipient category were then allocated among households according each household’s reported share of the relevant benefits in the CPS.
-
Medicaid Benefits Among Elderly Persons in Nursing Homes and Other Long-term Care Facilities.[93] MSIS data and other data sources were used to determine the aggregate Medicaid spending going to elderly persons in nursing homes.[94] These Medicaid institutional expenditures were then allocated among eight major demographic groups: non-immigrant households headed by individuals without a high school diploma, non-immigrant households headed by high school graduates, non-immigrant households headed by persons with some college, non-immigrant households headed by college graduates, immigrant households headed by individuals without a high school diploma, immigrant households headed by high school graduates, immigrant households headed by persons with some college, and immigrant households headed by college graduates.
The share of Medicaid spending on the elderly in institutions was assumed to equal the share of Medicaid spending on the elderly in the non-institutional population for each of the eight groups. The analysis assumed there were no elderly unlawful immigrants receiving Medicaid in nursing homes.
-
Medicaid Benefits Among Non-elderly Disabled Adults in Nursing Homes and Other Long-term Care Facilities. MSIS data were used to determine aggregate Medicaid spending on non-elderly disabled persons in nursing homes and other long-term care institutions. This spending was then allocated among the eight major demographic groups using the same procedures outlined in the proceeding section. (The same process was then applied to non-disabled non-elderly adults and persons under age 18, although there are relatively few such persons in long-term care.) Critically, the analysis assumed there were no unlawful immigrants of any type receiving Medicaid in nursing homes.
- Medicaid Disproportionate Share Hospital (DSH) Spending. Allocation of this spending is discussed in Appendix E.
Other Means-Tested Aid. Altogether, the federal government operates over 80 different means-tested aid programs. The CPS contains data on household utilization of 11 of the largest programs, which cover 93 percent of overall means-tested spending, but provides no data on the smaller programs.
Allocation of benefits from the remaining means-tested programs was estimated in the following manner. First, the share of reported total spending for the 11 means-tested programs covered by the CPS that goes to unlawful immigrant households was determined. Second, these households were assumed to receive a share of the means-tested benefits from the remaining unreported programs equal to their share of all expenditures on the reported means-tested programs in the CPS.
Affordable Care Act/Obamacare. The analysis estimated the benefits that would be provided from the Affordable Care Act during the full implementation phase of amnesty. Since the ACA subsidies are not currently available, these prospective benefits had to be calculated and imputed to households that lack medical insurance. The ACA will provide premium subsidies and cost-sharing subsidies through health care exchanges to households with incomes between 138 percent and 400 percent of poverty. Households with incomes between 138 percent of poverty and 100 percent of poverty may either participate in the exchanges or receive Medicaid.
The analysis used the formulas in the law to calculate premium and cost-sharing subsidies for each uninsured household. The Heritage analysis was designed to match cost estimates provided by the Congressional Budget Office (CBO) for 2017.[95] The CBO predicts that 33 million persons will receive either health exchange subsidies or expanded Medicaid coverage under the Affordable Care Act in 2017. All of these would be lawful residents. The Heritage Foundation analysis also estimates that 33 million lawful residents would receive ACA benefits in 2017. About 40 percent of total U.S. recipients of ACA benefits would participate in expanded Medicaid, and 60 percent would receive exchange subsidies.[96]
In addition, if amnesty were enacted, an additional 5.3 million unlawful immigrants would enroll in Obamacare; of these, 4.3 million would reside in unlawful immigrant households. Altogether, 5.4 million individuals residing in former unlawful immigrant households would receive benefits from ACA during the full amnesty period; 1.1 million of these would be U.S.-born children of unlawful immigrant parents.[97]
According to the Heritage Foundation model of the ACA, premium and cost-sharing subsidies per enrollee would be $5,695 in 2016. The CBO estimate is $5,570 per enrollee in 2017. The cost of new enrollees in Medicaid was set at the average Medicaid cost per beneficiary for each eligibility group in 2010. Former unlawful immigrants were assumed to have Medicaid expenses per beneficiary at 85 percent of normal costs.
Criminal Justice Expenditures. Expenditures for police, corrections, and the courts can be allocated in two ways. First, they can be allocated according to the number of persons protected from criminal activity. The elderly, for example, commit very little crime but require police services to protect themselves from the criminal activity of others. In general, the cost of police protection will expand in proportion to increases in the number of persons protected. Viewed in that light, the cost of criminal justice could be allocated evenly on a per capita or per household basis.
Alternatively, the costs of police protection could be allocated among groups according to their comparative threat of criminal activity. This seems reasonable because groups that have high levels of criminal activity cause other members of the community to demand higher levels of expenditure to protect themselves. Viewed in this light, criminal justice costs could be allocated among groups according to the relative number of criminal offenses committed. The current analysis has followed the former approach; criminal justice costs were apportioned on a per capita basis.
Some might object to this procedure because they believe unlawful immigrants have low rates of criminal activity. The question then arises whether unlawful immigrants have abnormally high or low rates of criminal activity.
Information on this point is available from the State Criminal Alien Assistance Program (SCAAP), which provides federal reimbursement to state and local governments for the costs of incarcerating unlawful aliens in state and local jails. While unlawful immigrants are less than 4 percent of the U.S. population, SCAAP data show that 5 percent of inmates in state prisons and 6 percent of inmates in local jails are unlawful immigrants.98 State and local governments rarely, if ever, incarcerate immigrants merely for violation of U.S. immigration law; instead, unlawful immigrants are incarcerated for standard criminal offenses such as assault, robbery, burglary, homicide, and drug crimes.99
The SCAAP data indicate that unlawful aliens may commit disproportionately higher levels of crime in the U.S. The present analysis, by conservatively estimating the criminal justice costs of unlawful immigrant households to be proportionate to their share of the population in the U.S, probably underestimates the actual criminal justice costs of unlawful immigration.
Population-Based Services. Wherever possible, the analysis allocated the cost of population-based services among households in proportion to their estimated utilization of those services, which was calculated from their share of expenditures for the service in the CPS.[100] For example, use of highways and roads was allocated among households in proportion to their share of gasoline expenditures reported in the CEX. Airport, public transport, water, and electric services were allocated in proportion to expenditures on those items in the CEX; in these cases, the subsidized portion of the service was assumed to be proportionate to the fees paid for the service.
The procedures used to combine CEX and CPS data are discussed under sales taxes, below. When an estimate of proportionate utilization was not possible, the cost of population-based services was generally allocated on a uniform per capita basis.
General Government/Administrative Support Functions at the Federal Level. This category consists of administrative services in support of other government functions. It includes tax and revenue collection, budgeting, central administration, and legislative functions. The analysis followed the National Research Council’s framework in treating these costs as private, population-based services that should be assigned to households.[101]
Allocation of the costs of general government services, such as tax collection, presents difficulties since no one appears to benefit directly from those services. Most taxpayers would regard IRS collection activities as a burden, not a benefit. However, while government administrative functions per se do not benefit the public, they do provide a necessary foundation that makes all other government benefit and service programs possible. A household that receives food stamp benefits, for example, could not receive those benefits unless the IRS had collected the tax revenue to fund the program in the first place.
Since the purpose of the administrative support functions is to sustain other government programs, the costs of administrative services were allocated according to the share of overall federal direct benefits, means-tested benefits, education, and population-based services received by a household.
By contrast, administrative costs in support of pure public goods were not assigned to households. In FY 2010, some 27 percent of total federal spending was allocated to pure public good functions. Therefore, the analysis assumed that 27 percent of federal general government and administrative support spending supported pure public good functions. These costs were excluded from the fiscal analysis. A further 5 percent of administrative costs were assumed to be fixed costs that would not expand or contract in response to changes in the population served; these costs were not assigned to households.
General Government/Administrative Support Functions at the State and Local Levels. These functions include tax and revenue collection, budgeting, central administration, trust fund and lottery administration, and legislative functions. Like federal administrative costs, these costs were allocated according to the share of overall state and local direct benefits, means-tested benefits, education, and population-based services received by a household. Five percent of overall administrative costs were assumed to be fixed; these costs, along with support functions for public goods services, were not allocated to households.
Financial Obligations Relating to Past Government Activities. Year by year, throughout most of the post–World War II period, U.S. taxpayers have not paid for the full cost of benefits and services provided by government. A portion of annual costs is passed on to future years through borrowing and through the retirement costs of former government employees. Current interest payments on government debt are therefore fixed by past government borrowing; current government employee retirement costs are based on past hiring.
An immigrant’s entry into the U.S. does not cause these payments to increase. For that reason, they have been excluded from the fiscal analysis presented in this paper. This is consistent with methods employed by the National Research Council in The New Americans.[102]
Pure Public Goods. Government pure public goods include expenditures on defense, veterans, international affairs, and scientific research and part of spending on the environment, as well as debt obligations relating to past public good spending. An immigrant’s entry into the U.S. does not increase these costs or diminish the utility of public goods spending for other taxpayers. Therefore, these costs have been excluded from the fiscal analysis in this paper. This is consistent with methods employed by the National Research Council in The New Americans.[103]
Estimating the Distribution of Taxes
The distribution of federal and state income taxes was calculated from CPS data. The Census imputes income tax payments into the CPS based on a household’s income and demographic characteristics and the appropriate federal and state tax rules. However, since income is underreported in the CPS, imputed taxes will also be too low. Thus, the imputed tax payments in the CPS were adjusted to equal the aggregate income tax revenues reported in government budgetary documents. Federal revenue totals were taken from Budget of the United States Government, Fiscal Year 2011: Analytical Perspectives. State and local tax and revenue data were taken from the U.S. Census survey of governments.
The procedures for adjusting for the underreporting of income taxes were the same as those used to adjust for underreporting of expenditures. For example, for lawful immigrant households’ federal income tax payments, let:
Tt = total income tax reported in the CPS;
Tl = total income tax for lawful immigrant households reported in the CPS;
Tb = total income tax according to independent budgetary sources; and
Hl = number of lawful immigrant households in the CPS.
The share of taxes paid by lawful immigrant households as reported in the CPS would equal Tl /Tt; the actual expenditures allocated to lawful immigrant households would be estimated to equal (Tl /Tt ) times Tb; and the average paid per lawful immigrant household would equal (Tl /Tt ) times (Tb/Hl).
State income taxes were adjusted for underreporting according to the same formula.
FICA Taxes. Employees were assumed to pay both the “employee” and “employer” share of FICA taxes. Allocation of FICA taxes was estimated based on the distribution reported in the CPS, adjusted for underreporting in the manner described above. Fees for unemployment insurance and workers’ compensation were assumed to be borne fully by the worker and were allocated according to the distribution of earnings in the CPS. FICA taxes were adjusted to equal the actual tax totals from budgetary sources with the same methods employed for income taxes.
Corporate Profits Tax. The incidence of federal and state corporate profits tax was assumed to fall 50 percent on workers and 50 percent on owners of capital. The workers’ share was allocated according to the distribution of earnings in the CPS; the owners’ share was allocated among households according to each household’s estimated share of financial assets.
Sales and Excise Taxes. These taxes are assumed to be paid entirely by consumers. The share paid by each household was assumed to be proportionate to its share of the consumption of goods and services.
In order to estimate consumption, the analysis combined CPS income data with consumption data from the Consumer Expenditure Survey in the following manner. First, for each of the four main demographic groups in the analysis (based on the education level of the head of household), the share of income allocated to total consumption was calculated within the CEX data base. The share of income allocated to specific items such as tobacco and gasoline was then calculated. These specific consumption-to-income ratios were then applied to the CPS income data for each group to determine the group’s share of consumption of a specific item.
This same procedure was then applied to each of the household subcategories presented in the paper. Each group’s share of consumption of an item was assumed to equal its share of the sales or excise tax on the item. For example, lawful immigrant households headed by persons without a high school diploma had 1 percent of total alcohol consumption and were therefore assumed to pay 1 percent of the excise taxes on alcohol. Although specific calculations were performed for 11 different sales and excise taxes, in most cases, a group’s estimated share of tax paid closely matched its estimated share of overall consumer expenditures.
Property Taxes. The Tax Foundation calculates that in 2010, 56 percent of property tax was paid for commercial property and 44 percent for residential property.[104] The Heritage Foundation analysis assumes that the property tax on commercial property was split equally between owners and consumers. The owners’ share of tax was allocated among households according to the households’ estimated share of financial assets. The tax paid by consumers was allocated among households in proportion to their share of total consumer expenditures. (See sales tax, above.)
The analysis further assumes that 35 percent of total property taxes fell on owner-occupied residences and 9 percent on rented residences.[105] The tax on owner-occupied residences was allocated among households according to the share of property tax payments reported in the CPS. The property tax on rented homes or apartments was assumed to be split evenly between owners and renters. The renter share was allocated among households according to their share of rental payments reported in the CEX. The owner share was allocated among households according to their estimated share of financial assets.
Federal Highway Trust Fund Taxes. This tax was assumed to fall half on the private owners of motor vehicles and half on businesses.[106] The business share was further assumed to fall half on consumers and half on owners. Thus, overall, the tax was assumed to fall 50 percent on private motor vehicle operators, 25 percent on consumers, and 25 percent on owners of businesses.
The portion of the tax paid by private motor vehicle operators was allocated among households in proportion to the household’s share of gasoline consumption as estimated from the CEX. The consumer portion of the tax was allocated among households according to the household’s estimated share of total consumption based on the CEX. (See sales tax, above.) The portion of the tax paid by owners was allocated among households according to their estimated share of financial assets.
State Lottery Receipts. An important source of government revenue paid by households headed by persons without a high school diploma is the purchase of state lottery tickets. A major study of the sale of state lottery tickets to different socioeconomic groups shows that per capita spending on state lottery tickets by adults without a high school diploma was twice that of other adults.[107] In the present analysis, lottery spending per adult in households headed by persons without a high school diploma was assumed to be double the purchase rate of adults in the general population.
Earnings on Investments Held in Employee Retirement Trust Funds. These state and local revenues represent the property income received by government trust funds as owners of capital. These earnings are not taxes and cannot be allocated among households.
State and Local Interest Earnings and Earnings from the Sale of Property. These revenues represent the property income received by government as owner of capital and other property. These earnings are not taxes and cannot be allocated among households.
Appendix E: Modified Estimating Procedures for Unlawful Immigrant Households
Some of the estimating procedures described above were modified for unlawful immigrant households. First, all adult U.S. citizens and adult lawful immigrants who resided within unlawful immigrant households were removed from the analysis of those households; benefits and taxes were reduced accordingly.
The earnings and property income of these excluded individuals was deducted from household income, resulting in an automatic matching reduction in all income and property-related taxes. The total income of the excluded individuals was deducted from household total income. This change reduced the estimated consumer expenditures in the household and thereby reduced all relevant sales and consumption taxes as well as government benefit estimates linked to consumption. Direct, means-tested benefits and Obamacare benefits received by these individuals were excluded from the analysis. Public housing and food stamp subsidies were reduced pro rata in affected households. The excluded individuals were removed from the count of persons in unlawful immigrant households, thereby modifying any calculation based on shares of population.
With respect to labor-related taxes, the analysis assumed that 45 percent of unlawful immigrant earnings was paid “off the books.” The CPS imputes federal income taxes, state income taxes, and FICA taxes based on reported earnings, but these taxes are obviously not paid on “off the books” employment. Therefore, the analysis reduced the levels of income and FICA tax reported in the CPS by 45 percent for unlawful immigrant households under the current-law scenarios. Unemployment insurance fees and workers’ compensation fees were reduced by the same amount.
Unlawful immigrant households were assumed to use motor vehicles, roads, and highways less than lawful households with the same income level. Motor vehicle license fees for unlawful immigrant households were therefore cut to 33 percent of normal values; gasoline and highway taxes for personal auto use were reduced to 50 percent of normal levels. Unlawful immigrants were assumed not to use airports; airport fees paid were therefore set at zero.
Government benefit levels were also modified for unlawful immigrant households. The CPS imputes refundable payments of the Earned Income Tax Credit and Additional Child Tax Credit as a percentage of family income. Since unlawful immigrants cannot receive these benefits, these benefits were set at zero under current law.
Unlawful immigrant households were assumed to use roads, highways, parks, libraries, and general health services less than comparable lawful immigrant and non-immigrant families. To adjust for this, the analysis reduced the unlawful immigrant use of roads and highways to 50 percent of normal rates; parks, recreation, and libraries to 75 percent of normal rates; and general health care to 15 percent of normal rates.
Unlawful immigrants can receive health care funded through Medicaid disproportionate share hospital (DSH) payments and community health center programs. Determining spending on unlawful immigrants through these programs is difficult. According to a key study in Health Affairs, adult unlawful immigrants (aged 18–64) nationwide were estimated to have received about $1.1 billion in publicly funded medical care in 2000.[108] Since these individuals cannot enroll in programs such as Medicaid and Medicare, most of this care would have occurred through DSH and community clinics. Adjusting the $1.1 billion spending figure to 2010 levels would result in roughly $2 billion in expenditure. Additional public funds would have been spent on unlawful immigrant elderly and children.
Following the estimates in the Health Affairs study, the Heritage Foundation analysis assumes that expenditures on unlawful immigrants through DHS payments and community health centers was around $3 billion in 2010, or roughly 15 percent of total spending in these programs. The share of remaining spending was allocated to other groups in proportion to their general receipt of means-tested welfare.
There is evidence that immigrants enrolled in the Medicaid and Children’s Health Insurance (CHIP) program have lower costs per beneficiary than non-immigrants. A study by the Cato Institute reports that the costs per beneficiary of immigrant adults in Medicaid is 25 percent lower than the cost for non-immigrant adults. The same study shows that the cost per beneficiary for immigrant children in Medicaid is more than 50 percent lower than the cost for non-immigrant children.[109] On the other hand, medical costs for the foreign-born elderly do not appear to be noticeably lower than the costs for the U.S.-born elderly.[110]
The Medicaid costs imputed into the CPS by the Census do not vary by immigration status. The present analysis has therefore reduced the CPS imputed Medicaid costs for immigrant children in the Medicaid and CHIP programs by 50 percent in the “current law” analysis. CHIP costs were reduced by the same amount. The differences between immigrants and non-immigrants with respect to medical services seem to be a result of differences in access and social attitudes toward medical use. These differences are likely to diminish after amnesty; therefore, immigrant children were assumed to use 25 percent less medical service per beneficiary during the interim period and 20 percent less during the full amnesty period when compared to non-immigrants.
Unlawful immigrant adults would not receive Medicaid benefits under current law or during the interim period. In the full amnesty period, the analysis assumes that the immigrant/non-immigrant difference would have diminished slightly; during the full amnesty period, non-disabled adults who were formerly unlawful immigrants are assumed to receive normal Medicaid benefits that are 15 percent lower than those received by similar non-immigrants during the full amnesty period.
Changes in Algorithms for Calculation of Benefits and Taxes During the Interim Period
The following changes were made to calculate the benefits received and taxes paid by former unlawful immigrant households during the interim amnesty period. (Benefits and taxes not listed remained the same as under current law.)
Government Benefits and Services
- Social Security disability and survivor benefits per household were raised from zero to 33 percent of the level of lawful immigrant households with comparable education levels.
- Medicare benefits for Old-Age, Survivor, and Disability Insurance (OASDI) recipients were raised from zero to 33 percent of the level of lawful immigrant households with comparable education levels.
- Unemployment insurance benefits were raised to the level of lawful immigrant households with comparable education levels and then reduced by 66 percent to reach non-recessionary levels.
- Workers’ compensation benefits were raised to the level of lawful immigrant households with comparable education levels.
- The value of Medicaid benefits for children was raised to 75 percent of the normal values imputed in the CPS. It was assumed that the difference between expenditures for immigrant and non-immigrant children would diminish over time.
- Former unlawful immigrant households were assumed to use roads and highways, airports, parks, libraries, disaster relief, and general (non–means-tested) health care services at the normal rate for similar households in the general population.
- A post-recession adjustment reduced unemployment insurance by 66 percent and food stamp benefits by 25 percent. These reductions were incorporated into all post-amnesty benefit figures.
- Another post-reduction adjustment reduced total means-tested benefits by 5 percent; the effects of this adjustment appear separately in tables in the text.
Revenues
- The percentage of former unlawful immigrant workers who were assumed to work on the books was raised from 55 percent to 95 percent; federal personal income tax, state personal income tax, FICA taxes, unemployment insurance fees, and workers’ compensation fees were increased proportionately.
- The worker’s share of federal and state corporate income tax was increased in direct proportion to the increase in on-the-books employment.
- Former unlawful immigrant households were assumed to use roads and highways at the same rate as comparable households with the same incomes in the general population; highway trust fund gas taxes, state gas taxes, and motor vehicle license fees were increased proportionately. Former unlawful immigrant households were assumed to use airports at the same rate as comparable households with the same incomes in the general population; airport fees were increased proportionately.
- Former unlawful immigrant workers were assumed to receive a 5 percent increase in earnings as a result of amnesty; total taxes paid per household were therefore increased by 5 percent.
- It is possible that the recession in 2010 reduced incomes and tax revenues in unlawful immigrant households by 5 percent. A post-recession adjustment was applied raising the total taxes paid by unlawful immigrant households by 5 percent in future years; this adjustment appears separately in the text tables.
Changes in Algorithms for Calculation of Benefits and Taxes During the Full Amnesty Period
The following changes were made to calculate the benefits received and taxes paid by former unlawful immigrant households during the full amnesty period. (Benefits and taxes not listed remained the same as under current law.)
Government Benefits and Services
- Social Security disability and survivor benefits per household were raised to the level of lawful immigrant households with comparable education levels.
- Medicare benefits for OASDI recipients were raised to the level of lawful immigrant households with comparable education levels.
- Unemployment Insurance benefits were raised to the level of lawful immigrant households with comparable education levels.
- Workers’ compensation benefits were raised to the level of lawful immigrant households with comparable education levels.
- Temporary Assistance for Needy Families benefits were raised to the level of lawful immigrant households with comparable education levels and adjusted for differences in the number of children per household.
- Supplemental Security Income benefits were raised to the level of lawful immigrant households with comparable education levels and adjusted for differences in the number of persons per household.
- Food stamp benefits were raised to the level of lawful immigrant households with comparable education levels, adjusted for differences in the number of persons per household.
- Refundable Earned Income Tax Credits and Additional Child Tax Credits were set at the levels imputed by the Census in the CPS.
- The value of Medicaid benefits for children was set at 75 percent of the normal values imputed in the CPS.
- Disproportionate share hospital expenditures were reduced by 33 percent.
- Former unlawful immigrant households were assumed to use roads and highways, airports, parks, libraries, disaster relief, and general (non–means-tested) health care services at the normal rate for similar households in the general population.
- A post-recession adjustment reduced unemployment insurance by 66 percent and food stamp benefits by 25 percent. These reductions were incorporated into all post-amnesty benefit figures.
- Another post-reduction adjustment reduced total means-tested benefits by 5 percent; the effects of this adjustment appear separately in tables in the text.
Revenues
The percentage of former unlawful immigrant workers who were assumed to work on the books was raised from 55 percent to 95 percent; federal personal income tax, state personal income tax, FICA taxes, unemployment insurance fees, and workers’ compensation fees were increased proportionately.
The worker’s share of federal and state corporate income tax was increased in direct proportion to the increase in on-the-books employment.
Former unlawful immigrant households were assumed to use roads and highways at the same rate as comparable households with the same incomes in the general population; highway trust fund gas taxes, state gas taxes, and motor vehicle license fees were increased proportionately.
Former unlawful immigrant households were assumed to use airports at the same rate as comparable households with the same incomes in the general population; airport fees were increased proportionately.
Former unlawful immigrant workers were assumed to receive a 5 percent increase in earnings as a result of amnesty; total taxes paid per household were therefore increased by 5 percent.
It is possible that the recession in 2010 reduced incomes and tax revenues in unlawful immigrant households by 5 percent. A post-recession adjustment was applied raising the total taxes paid by unlawful immigrant households by 5 percent in future years; this adjustment appears separately in the text tables.
Estimating the Aggregate Lifetime Fiscal Deficit for Unlawful Immigrant Households After Amnesty
The estimate of the lifetime fiscal cost of unlawful immigrant households was based on the following assumptions. The estimates assume that amnesty is enacted in 2013.
- The number of former unlawful immigrant households was assumed to decline year by year after amnesty according to standard mortality tables.
- Five percent of the households were assumed to emigrate. The emigration was assumed to be spread evenly over the first 30 years after amnesty.
- For the first 13 years after amnesty, the annual cumulative deficit would equal the deficit per household for the interim period with post-recession adjustments (as shown in Table 8 in the text) times the remaining number of households.
- Starting in the 14th year after amnesty, the annual cumulative deficit was assumed to equal the deficit per household during the full amnesty period with post-recession adjustments (shown in Table 8 in the text) times the remaining number of households.
- Thirty-three years after amnesty, the median-aged householder (among the former unlawful immigrant households) would reach retirement age (age 67). Starting in that year, all unlawful immigrants were assumed to begin receiving retirement benefits. Obviously, half of the householders would reach age 67 before this year and half would reach it later. Using individual ages rather than the median age to determine retirement would be more precise but would affect the overall figures only slightly.
- The retirement phase of amnesty begins in 2046. In the retirement phase, fiscal costs are based on individuals, not households. The costs are based on the total number of adult unlawful immigrants in 2010 (10.1 million), not just those residing in households with unlawful immigrant heads in 2010. Five percent of these unlawful immigrants are assumed to emigrate before retirement, and the number is further reduced by natural mortality rates. Some 8.8 million are assumed to be alive and in the U.S. in 2046. The annual cumulative deficit is assumed to equal the per-person deficit for former unlawful immigrants over 65 (shown in text table 10) times the surviving number of individuals. In subsequent years, the number of surviving individuals is reduced by standard mortality rates, and the cumulative deficit is reduced accordingly.
- Amnesty recipients are assumed to bring some 1.5 million parents to the U.S. as legal permanent residents, resulting in a net added cost of $260 billion. These costs are added to the lifetime total figure.
- The lifetime fiscal cost figure is in 2010 dollars.
Appendix F: Other Methodological Issues
Use of 2010 as the Base Year
The fiscal analysis in this paper uses data from 2010, which was a recession year. In a recession year, tax payments by unlawful immigrant households might have been lower, and government benefits might have been higher, than normal. This would artificially increase the average household fiscal deficit and bias the estimates of future deficits upward.
The analysis presented in Tables 7, 8, 10, 11, and 12 in the text has already adjusted for this by reducing the estimated future use of unemployment insurance and food stamps after amnesty to compensate for the higher levels of receipt during the recession in 2010. Beyond this, the fact that 2010 was a recession year has a limited impact on the analysis. While the recession reduced incomes and tax revenues in the economy as a whole, the impact on the average unlawful immigrant household was limited. It is true that gross income in the economy dropped during the recession, but most of that decline was in interest and property income. Overall, wages fell by only 2.3 percent between their peak in 2008 and 2010.
Unlawful immigrants have very little property income, and thus little income loss. In fact, CPS data indicate that the average income of the average unlawful immigrant household did not decline during the recession. Tax payments per household for unlawful immigrant households in 2010 were therefore not artificially low. When unlawful immigrants cannot find employment, they may simply return to their country of origin. This removes them from the survey data and would contribute to the stability of unlawful immigrant household income during an economic downturn.
What about welfare benefits? Welfare benefits received by lawful immigrant households in 2010 were used to estimate future benefits for amnesty recipients. If the 2010 benefits were artificially high, this would bias the estimates of future deficits upward. Many people believe the welfare system is like a roller coaster: Benefits go up during a recession and fall when the recession ends. While food stamp rolls expand and contract to a degree in response to economic trends, most other welfare programs are largely unaffected by business cycles.
Chart 9 in the text shows the means-tested welfare spending for cash, food, and housing between 1965 and 2011. The figures cover the whole population and are adjusted for inflation. Covering several business cycles, the chart reveals no roller-coaster patterns. Benefits may rise during a recession, but they do not fall when the recession ends.
The analysis does include further post-recession adjustments to compensate for the possibility that tax revenue from unlawful immigrants was depressed in 2010 and means-tested benefits were artificially high. The analysis increases future tax revenues for unlawful immigrant households by 5 percent above the 2010 levels. It also reduces future estimated means-tested benefits by 5 percent. These adjustments are presented separately in Tables 7, 8, 10, and 12 in the text. They are also incorporated into Table 11.
Aging of the Population Prior to Retirement
The average unlawful immigrant will spend 20 years in the full amnesty stage before retiring. During that period, the composition of the household’s benefits and taxes may change, but the average household deficit likely will vary little. The number of children in the household is likely to rise and then fall. Wages will rise somewhat, but medical costs and subsidies will rise as well. The number of individuals receiving disability benefits will increase significantly. Overall, the average household deficit is comparatively unchanging for households with heads between 35 and 55.
The analysis assumes that unlawful immigrant households, as a group, will have an average deficit of around $28,000 (in constant dollars) throughout the full amnesty period. This is a simplifying assumption but not an unreasonable one. The unlawful immigrant population already contains adults of various ages. The age composition of unlawful immigrant household heads and the general lack of variation in household fiscal deficit through middle age mean that the average deficit will not vary a great deal before retirement.
However, there are two issues with respect to aging that require special consideration. The first is added child births. An additional 3 million to 4 million children will be born to present unlawful immigrants over the next two decades. At first glance, these children would seem to create an extra cost that should be calculated separately. In reality, these additional children are unlikely to raise the average fiscal deficit among the unlawful immigrant households. As new children are born, older children will mature and leave the households. Thus, the number of children within the unlawful immigrant households as a whole is likely to be fairly stable for many years.
The second issue is wage growth. The basic analysis in this paper included a 5 percent boost in wages due to the direct impact of legalization. However, many unlawful immigrants can be expected to have additional wage growth over time and therefore to pay more taxes. This wage growth could take two forms: structural and maturational.
Structural wage growth occurs between generations: for example, if college graduates in one generation earned more than similar workers in the prior generation. Regrettably, there has been no structural wage growth among workers with a high school degree or less for 40 years. In constant dollars, these earnings either have remained constant or have fallen.111 Therefore, this will not be an important factor in raising the wages of amnesty recipients.
Maturational wage growth occurs as a single worker gets older. Most workers at age 55 are more skilled than they were at 25 and thus receive a higher wage; tax payments will increase proportionately. Historical data show that workers with a high school degree or less may experience, on average, a 15 percent to 30 percent boost in constant-dollar wages after three decades of work.112 This wage growth will produce higher tax payments. Thus, on the surface, one might expect to see household deficit fall as amnesty recipients get older.
But the situation is more complex than this. The unlawful immigrant population in 2010 already contained workers at various ages, so any increase in the group average wage would be less than the 15 percent to 30 percent mentioned above. Moreover, the fiscal balance of each household is determined not by wages alone but by the ratio of wages (and taxes) to government benefits. Older workers will tend to earn more when employed, but they also are more likely to become ill and may leave the labor force and receive disability benefits. Obamacare for older workers will be very expensive.
The analysis in this paper already incorporates most of any anticipated maturation wage increases because it already includes the wages of lawful and unlawful immigrant workers at various ages. More important, it examines the fiscal deficits of households of different ages. The average fiscal deficit for lower-skill households tends to rise until ages 40–45, then fall slightly, and then rise again in retirement. This rise-fall-rise pattern means that as a low-skill population ages, the average household deficit is unlikely to change much, even though wages may rise slightly
Appendix G: Pure Public Goods, Private Consumption Goods, and Population-Based Services
Fiscal distribution analysis seeks to determine the government benefits received by a particular group compared to taxes paid. A necessary first step in this process is to distinguish government programs that provide “pure public goods” as opposed to “private goods.” These two types of expenditures have very different fiscal implications.
Economist Paul Samuelson is credited with being the first to develop the theory of public goods. In his seminal 1954 paper “The Pure Theory of Public Expenditure,”.[113] Samuelson defined a pure public good (or what he called a “collective consumption good”) as a good “which all enjoy in common in the sense that each individual’s consumption of such a good leads to no subtractions from any other individual’s consumption of that good.” By contrast, a “private consumption good” is a good that “can be parceled out among different individuals.” Its use by one person precludes or diminishes its use by another.
A classic example of a pure public good would be a lighthouse: The fact that any particular ship perceives the warning beacon does not diminish the usefulness of the lighthouse to other ships. A typical example of a private consumption good is a hamburger: When one person eats it, it cannot be eaten by others.
Formally, all pure public goods will meet two criteria.[114]
- Non-Rivalrous Consumption. Everyone in a given community can use the good; its use by one person will not diminish its utility to others.
- Zero-Cost Extension to Additional Users. Once a pure public good has been produced, it requires no extra cost for additional individuals to benefit from the good. Expansion of the number of beneficiaries does not reduce its utility to any initial user and does not add new costs of production. As Nobel prize–winning economist James Buchanan explains, with a pure public good, “Additional consumers may be added at zero marginal cost.”[115]
The second criterion is a direct corollary of the first. If consumption of a good is truly non-rivalrous, then adding extra new consumers will not reduce utility or add costs for the initial consumers.
The distinction between collective and private consumption goods can be illustrated by considering the difference between a recipe for pie and an actual piece of pie. A recipe for pie is a public consumption good in the sense that it can be shared with others without reducing its usefulness to the original possessor; moreover, the recipe can be disseminated to others with little or no added cost. By contrast, an actual slice of pie is a private consumption good: Its consumption by one person bars its consumption by another. Efforts to expand the number of individuals utilizing the pie slice will either reduce the satisfaction of each user (as each gets a smaller portion of the initial pie) or entail new costs (to produce more pie).
Examples of Governmental Pure Public Goods
Pure public goods are relatively rare. One prime example of a governmental public good is medical research. If research funded by the National Institutes of Health produces a cure for cancer, all Americans will benefit from this discovery. The benefit received by one person is not reduced by the benefit received by others; moreover, the value of the discovery to each individual would remain the same even if the U.S. population doubled.
Another notable example of a pure public good is defense expenditure. The utility of an Army division or an aircraft carrier lies in its effectiveness in combating foreign threats to America. In most respects, one person’s benefit from defense strength is not reduced because others also benefit. The military effectiveness of an Army division or an aircraft carrier is not reduced just because the size of the civilian population being defended increases.
Finally, individuals may receive psychic satisfaction from the preservation of wildlife or wilderness areas. This psychic satisfaction is not reduced because others receive the same benefit and is not directly affected by changes in the population. By contrast, enjoyment of a national park may be reduced if population increases lead to crowding. In consequence, general activities to preserve species may be considered a public good, while provision of parks is a private good.
Pure Public Goods Compared to Population-Based Goods
Many government services that are dubbed public goods are not true public goods. Economists Thomas MaCurdy, Thomas Nechyba, and Jay Bhattacharya state that “relatively few of the goods produced by [the] government sector are pure public goods, in the sense that the cost of providing the same level of the good is invariant to the size of the population.”[116] In other words, many government services referred to conventionally as “public goods” need to be increased at added expense to the taxpayer as the population increases, thereby violating the criterion of zero-cost extension to additional users.
For example, police protection is often incorrectly referred to as a “public good.” True, police do provide a diffuse service that benefits nearly all members of a community, but the benefit that each individual receives from a police officer is reduced by the claims that other citizens may make on the police officer’s time. Someone living in a town of 500 protected by a single police officer gets far more protection from that police officer than would another individual protected by the same single police officer in a town of 10,000.
The National Research Council explains that government services that generally need to be increased as the population increases are not real public goods. It refers to these services as “congestible” goods: If such a program remains fixed in size as the number of users increases, it may become “congested,” and the quality of service will consequently be reduced. An obvious example would be highways. Other examples of “congestible” goods are sewers, parks, fire departments, police, courts, and mail service.[117] These types of programs are categorized as “population-based” services in the paper.
In contrast to population-based services, governmental pure public goods have odd fiscal properties. The fact that a low-income person who pays little or nothing in taxes receives benefit from government defense or medical research programs does not impose added costs or reduce the utility of those programs to other taxpayers. Therefore, it is inaccurate to say that the non-taxpayers’ use of these programs imposes a burden on other taxpayers. On the other hand, non-taxpayers or individuals who pay little in taxes are “free riders” on public goods in the sense that they benefit from a good for which they have not paid.
The entry of unlawful or low-skill immigrants into the U.S. does not increase the costs or reduce the utility of public goods for other taxpayers; therefore, public goods spending is not included in the net fiscal deficit calculations for unlawful immigrant households presented in this paper. By contrast, the entry of unlawful immigrants does increase costs and reduce the utility of “congestible” or population-based services for other taxpayers; therefore, those expenditures have been included in the net fiscal deficit calculations for low-skill immigrant households presented in this paper.
