In an earlier study, we examined the economic impact of climate change–related regulations at the national level and found devastating job losses over the course of the next two decades. In this study, we quantify this impact by state and congressional district. Not surprisingly, we find that all states would suffer from this policy. Given these results and the regulations’ negligible positive impact on the climate and the environment, policymakers should avoid instituting these potentially burdensome regulations.
Overview
The Obama Administration has put forward a variety of rules and goals aimed at cutting carbon dioxide emissions. These rules would drive up energy costs, reduce economic activity, and disrupt job markets. A previous Heritage Foundation study outlined the projected economic impact of such policy.[1] It found by 2030:
- An average employment shortfall of nearly 300,000 jobs,
- A peak employment shortfall of more than 1 million jobs,
- 500,000 jobs lost in manufacturing,
- Destruction of more than 45 percent of coal-mining jobs,
- A loss of more than $2.5 trillion (inflation-adjusted) in aggregate gross domestic product, and
- A total income loss of more than $7,000 (inflation-adjusted) per person.
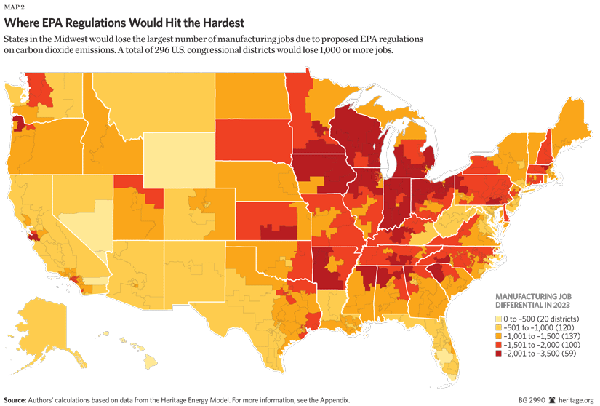
In the current study, job impacts are disaggregated to show potential effects by state and by congressional district. Because manufacturing jobs are disproportionately affected, state economies that are manufacturing-intensive can expect disproportionate employment losses.
The Proposed Regulations
For decades, environmental activist organizations have pushed to regulate carbon dioxide emissions. Even though such regulations would have a negligible positive impact on the climate and the environment, the Obama Administration has introduced a series of measures aimed at controlling emissions from motor vehicles and power plants, both new and existing.[2] The economic basis for these regulations has been the social cost of carbon (SCC).
Derived from integrated assessment models (IAMs), the SCC supposedly quantifies the economic damages associated with carbon dioxide emissions. Although conceptually appealing and technically sophisticated in many ways, the IAMs suffer from inherent flaws, including unrealistic assumptions about the costs of future damages, the temperature changes caused by increased carbon dioxide emissions into the atmosphere, and the time horizon (nearly 300 years into the future). Because of these flaws, the IAMs are fundamentally unsuitable for regulatory application.[3]
The Economic Impact by State
In the earlier study, we used the Heritage Energy Model (HEM) to quantify the economic impact that such regulations based on the SCC would have on the American economy.[4] To estimate the economic impact of the Administration’s regulatory scheme, based on an estimated SCC of $37 per ton, we modeled the impact of an equivalent tax of $37 per ton of carbon emissions[5] instituted in 2015 and increasing according to the EPA’s annual SCC estimates.[6] Taxing CO2-emitting energy incentivizes businesses and consumers to change production processes, technologies, and behavior in a manner comparable to the Administration’s regulatory scheme. To neutralize the analytical impacts of a tax’s income transfer, we model a scenario in which 100 percent of carbon-tax revenue is returned to taxpayers.
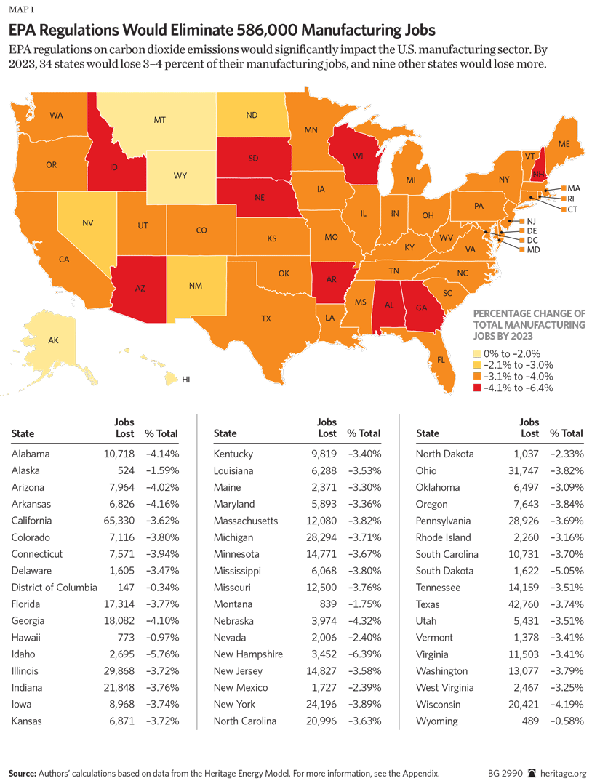
Map 1 shows the impact of such a regulatory scheme on manufacturing jobs by state eight years from now (the midpoint of the period analyzed).[7]
As the numbers illustrate, all states would experience overwhelmingly negative impacts as a result of these regulations.
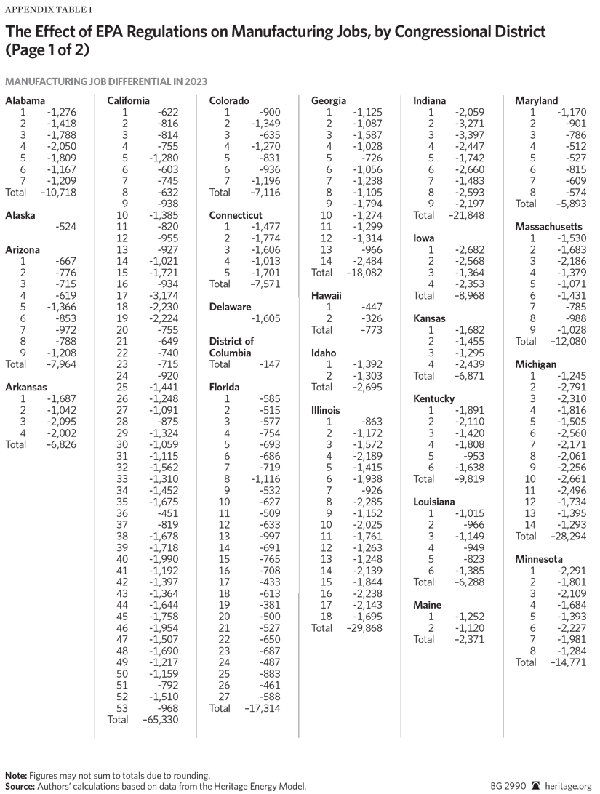
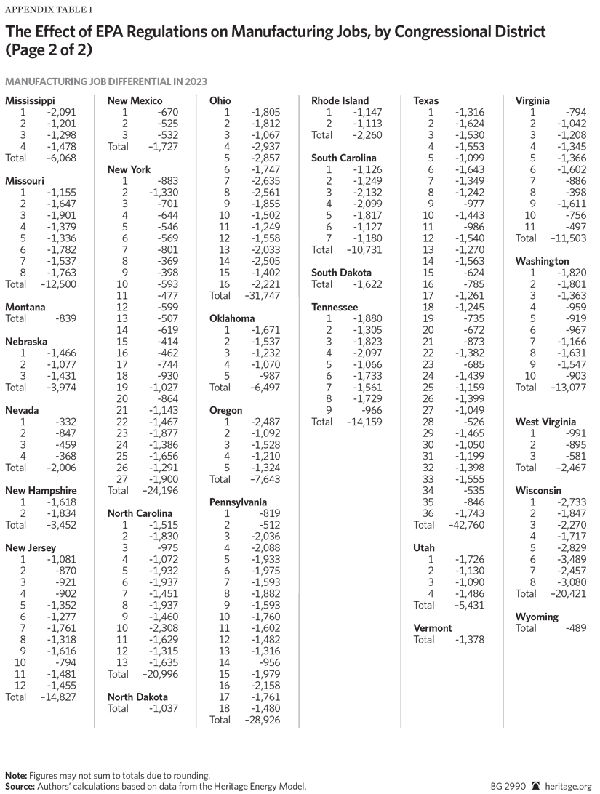
The Appendix includes these results by congressional district.
Although the economic damages from the Obama Administration’s energy-stifling carbon policy will be overarching, these damages will clearly impact manufacturing jobs all across the country. Most notably, states with manufacturing-intensive economies will suffer a great deal as a result of this policy. As a result, policymakers should avoid imposing these destructive policies on such an integral component of the American economy.
—Kevin D. Dayaratna, PhD, is Senior Statistician and Research Programmer in the Center for Data Analysis, of the Institute for Economic Freedom and Opportunity, at The Heritage Foundation. Nicolas D. Loris is Herbert and Joyce Morgan Fellow in the Thomas A. Roe Institute for Economic Policy Studies of the Institute for Economic Freedom and Opportunity. David W. Kreutzer, PhD, is a Research Fellow for Energy Economics and Climate Change in the Center for Data Analysis.
Appendix
Appendix Table 1 shows the economic impact of the regulations modeled in this study by congressional district.
Methodology
Overview of Heritage Energy Model. This analysis utilizes the Heritage Energy Model (HEM), a derivative of the National Energy Model System 2014 Full Release (NEMS).[8] NEMS is used by the Energy Information Administration (EIA) in the Department of Energy as well as various nongovernmental organizations for a variety of purposes, including forecasting the effects of energy policy changes on a plethora of leading economic indicators. The methodologies, assumptions, conclusions, and opinions in this report are entirely the work of statisticians and economists in the Center for Data Analysis (CDA) at The Heritage Foundation and have not been endorsed by, and do not necessarily reflect the views of, the developers of NEMS.
HEM is based on well-established economic theory as well as historical data and contains a variety of modules that interact with each other for long-term forecasting. In particular, HEM focuses on the interactions among (1) the supply, conversion, and demand of energy in its various forms; (2) American energy and the overall American economy; (3) the American energy market and the world petroleum market; and (4) current production and consumption decisions as well as expectations about the future.[9] These modules include:
- Macroeconomic Activity Module,[10]
- Transportation Demand Module,
- Residential Demand Module,
- Industrial Demand Module,
- Commercial Demand Module,
- Coal Market Module,
- Electricity Market Module,
- Liquid Fuels Market Module,
- Oil and Gas Supply Module,
- Renewable Fuels Module,
- International Energy Activity Module, and
- Natural Gas Transmission and Distribution Module.
HEM is identical to the EIA’s NEMS with the exception of the Commercial Demand Module. Unlike NEMS, this module does not make projections regarding commercial floor-space data of pertinent commercial buildings. Other than that, HEM is identical to NEMS.
Overarching the modules is the Integrating Module, which consistently cycles, iteratively executing and allowing these various modules to interact with each other. Unknown variables that are related, such as a component of a particular module, are grouped together, and a pertinent subsystem of equations and inequalities corresponding to each group is solved via a variety of commonly used numerical analytic techniques, using approximate values for the other unknowns. Once these group’s values are computed, the next group is solved similarly and the process iterates. Convergence checks are performed for each statistic to determine whether subsequent changes in that particular statistic fall within a given tolerance. After all group values for the current cycle are determined, the next cycle begins. For example, at cycle j, a variety of n pertinent statistics represented by the vector, ![]() is obtained.[11] HEM provides a number of diagnostic measures, based on differences between cycles, to indicate whether a stable solution has been achieved.
is obtained.[11] HEM provides a number of diagnostic measures, based on differences between cycles, to indicate whether a stable solution has been achieved.
Carbon Tax Simulations and Diagnostics. We used the HEM to analyze the economic effects of instituting a $37 carbon tax based on the EPA’s estimation of the SCC assuming a 3 percent discount rate. HEM is appropriate for this analysis because similar models have been used in the past to understand the economic effects of other carbon tax proposals.[12] In particular, we conducted simulations running a carbon fee that started in 2015 at $37 (in 2007 dollars per metric ton of carbon dioxide) and followed the schedule presented by the Obama Administration through the year 2040.[13] We chose a revenue-neutral carbon tax that returns 100 percent of the carbon tax revenues directly to taxpayers. We ran the HEM for 12 cycles to get consistent feedback into the Macroeconomic Activity Module, which provided us with the figures presented in this study. Since we are modeling the proposed regulations as a tax, the economic impact is likely understated because actual regulations would have a more stifling impact on the economy.
The diagnostic tests suggested that the forecasts provided by the model had stabilized at the end of the 12 runs, based on differences between cycles. The 12 cycles were therefore sufficient to attain meaningful convergence, thus providing us with macroeconomic statistics from which we could make informative statistical inferences.
Translating National Employment Impacts to Local Impacts. To estimate employment differentials, two employment trajectories were created for each state and congressional district: a baseline trajectory and a policy trajectory. Initial manufacturing employment levels for each state or district were multiplied by the national manufacturing employment growth factors for each year for both the baseline and policy cases estimated using the HEM.[14] The three categories were totaled to calculate total employment for the baseline and policy cases.


