When his climate cap-and-trade bill was defeated in the Democrat-controlled Senate, President Barack Obama noted there were other ways of “skinning the cat.”[1] Now we know that his chosen way is an onslaught of mandates, regulations, and possibly taxes directed primarily by the Department of Energy (DOE) and the Environmental Protection Agency (EPA).
The indicator proposed by the Administration to guide the regulatory push is the “social cost of carbon” (SCC). In theory, the SCC measures the worldwide economic damage caused by the emission of a ton of carbon dioxide (CO2). In practice, SCC estimates are far too flawed for serious regulatory use. Studies by The Heritage Foundation and others have highlighted numerous problems with this metric.[2] Nevertheless, Obama Administration regulators are still relying on the SCC to justify and guide their rulemaking.
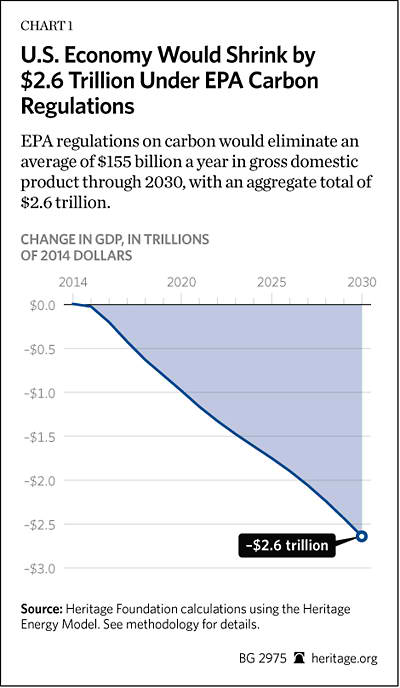
This study examines the economic impacts of a comprehensive set of SCC-guided regulations on energy production and use. If implemented, these regulations would reduce aggregate gross domestic product (GDP) by more than $2.5 trillion between now and 2030. Employment would track nearly 300,000 jobs below the no-carbon-regulation baseline in an average year, with some years seeing an employment deficit of more than 1 million jobs.
How We Got Here
In 1999, environmental activist organizations sued the EPA to force the agency to regulate CO2 emissions from motor vehicles. The case was eventually appealed to the Supreme Court, and in April 2007 the Court ruled that carbon dioxide and five other greenhouse gases (GHGs) are pollutants and can be regulated under the Clean Air Act (CAA). The Court ordered the EPA Administrator to determine whether these GHG emissions were dangerous to human health and the environment and whether the scientific consensus on the effects of GHGs was settled.[3] Despite evidence and climate literature to the contrary,[4] the EPA concluded that manmade greenhouse gas emissions are a threat to human health and public welfare, not because of any direct adverse health impacts but because of their contributions to climate change.
That decision began a long regulatory process starting in July 2008 when the EPA released a 564-page advance notice of proposed rulemaking (ANPR). The ANPR detailed the types of businesses and entities that would potentially be affected by broadening the scope of the CAA to regulate greenhouse gas emissions. Because greenhouse gases are typically emitted in far greater quantities than traditional pollutants, the CAA’s standards required regulation of sources or establishments that emit more than 100 tons or 250 tons (depending on the source) of a pollutant per year. This could have massively increased the number of regulated sources to include schools, farms, restaurants, hospitals, apartment complexes, and churches.[5]
Recognizing the economic and logistical absurdity of attempting to regulate the carbon dioxide output of all of these sources, the EPA proposed a “tailoring rule” that would amend the CAA to affect only large emitters of CO2. Industry groups challenged the EPA’s authority to essentially rewrite statutory language, and in June 2014, the Supreme Court said the EPA could not unilaterally change the law.[6]
The Supreme Court decision was an important victory for the enforcement of the separation of powers, but the Court did uphold what the EPA is trying to do. Facilities that fall under the CAA for major emissions of non-greenhouse gases such as sulfur dioxide or nitrous oxide may be required to take steps to control not only these pollutants, but also greenhouse gas emissions.[7]
The Current Regulations
The EPA’s primary target for greenhouse gas emission reductions is electric power generation. Under Section 111 of the Clean Air Act, the EPA outlined regulations for new and existing power plants, first with New Source Performance Standards on new power plants under Section 111(b).[8] Originally proposed in March 2012 with a standard threshold of 1,000 pounds of carbon dioxide equivalent per megawatt hour, the EPA reproposed new source performance standards on September 20, 2013, that placed different thresholds on new coal-fired plants and new gas-fired plants.
The EPA’s new rule, which will be finalized in January 2015, would effectively ban construction of new coal-fired power plants because the average coal-fired power plant emits nearly 1,800 pounds of carbon per megawatt hour. Even the newest, most efficient, supercritical power plant, which generates steam at a higher pressure than traditional subcritical coal-fired power plants, emits 1,700 pounds per megawatt hour.[9]
The Obama Administration continued its climate crusade in June 2014 by introducing regulations for existing power plants. Under Section 111(d) of the Clean Air Act, the EPA standards for greenhouse gas emissions from existing sources set reduction targets at 25 percent below 2005 levels by 2020 and 30 percent by 2030. Under the Clean Power Plan, the EPA set different targets for each state based on the carbon intensity of the electricity generation in that state. The EPA uses a formula of “CO2 emissions from fossil fuel-fired power plants in pounds (lbs) divided by state electricity generation from fossil-fuel fired power plants and certain low- or zero-emitting power sources in megawatt hours (MWh)” to calculate each state target.[10] Given the EPA’s desire to transform the electricity sector, the original intentions of Section 111(d), and the recent Supreme Court ruling on the tailoring rule, the regulations for existing power plants will face much-warranted legal scrutiny. In fact, 12 states have already filed suit against the EPA over its Clean Power Plan.[11]
The Social Cost of Carbon
Underpinning the EPA’s proposed regulations and effectively determining the level of regulation imposed is a cost-benefit analysis that uses the “social cost of carbon,” a highly questionable statistic from the environmental economics literature.
The EPA uses integrated assessment models, statistical models of the environment and economy, to determine the value of the SCC, which the EPA defines as the economic damage that a ton of CO2 emitted today will cause over the next 300 years. The regulatory use of the SCC is disturbing because the method for determining the value of the SCC is fundamentally arbitrary. Even some proponents of policies to cut carbon dioxide emissions have pointed out the fundamental and fatal flaws in the damage functions of the statistical models used to estimate the SCC.[12]
In addition, the process appears to suffer from questionable assumptions that exaggerate the SCC values. The Heritage Foundation’s Center for Data Analysis (CDA) examined two of these models and found that using assumptions from more current climate literature significantly reduces the estimated SCC. In one model, the use of assumptions recommended by the Office of Management and Budget produces an estimated positive benefit from increasing CO2 rather than a net societal cost. Nonetheless, the EPA chose to justify its regulation based on an SCC it estimated to be $37 per ton.[13]
In order to estimate the impact on the economy of the Clean Power Plan’s regulatory scheme, based on an estimated SCC of $37 per ton, we have modeled the impact of an equivalent tax of $37 per ton carbon emissions[14] instituted in 2015 and increasing according to the EPA’s annual estimates of the social cost of carbon.[15] Taxing CO2-emitting energy incentivizes businesses and consumers to change production processes, technologies, and behavior in a manner comparable to the Clean Power Plan regulatory scheme. Modeling comparable tax changes as a substitute for estimating the macroeconomic impact of complex regulatory schemes is a widely accepted practice. To neutralize the analytical impacts of a tax’s income transfer, we model a scenario in which 100 percent of carbon-tax revenue is returned to taxpayers.
While the macroeconomic impacts of a regulatory scheme or a carbon tax should be broadly comparable, economists generally agree that in practice a carbon tax induces desired responses more efficiently than regulations.[16] Regulations likely have distortionary impacts on economic activity that include encouragement of rent-seeking activity and lobbying, standardization of production processes that ultimately reduces the pace of innovation, and subsidies for politically preferred sources of energy and technologies. Because these types of distortions impose societal costs beyond those of a simple carbon tax, the economic impacts modeled here will, if anything, be lower than would actually occur in a regulatory scheme.
The High Cost of Regulation
To estimate the economic cost of the proposed regulations, we employed the Heritage Energy Model (HEM), a derivative of the National Energy Model System 2014 Full Release (NEMS). This model includes modules covering a variety of energy markets and integrates with the IHS Global Insight macroeconomic model. A full description of the model is provided in Appendix B. We modeled the impact of a revenue-neutral carbon tax starting at $37 per ton in 2015 through 2030. The costs turn out to be substantial.
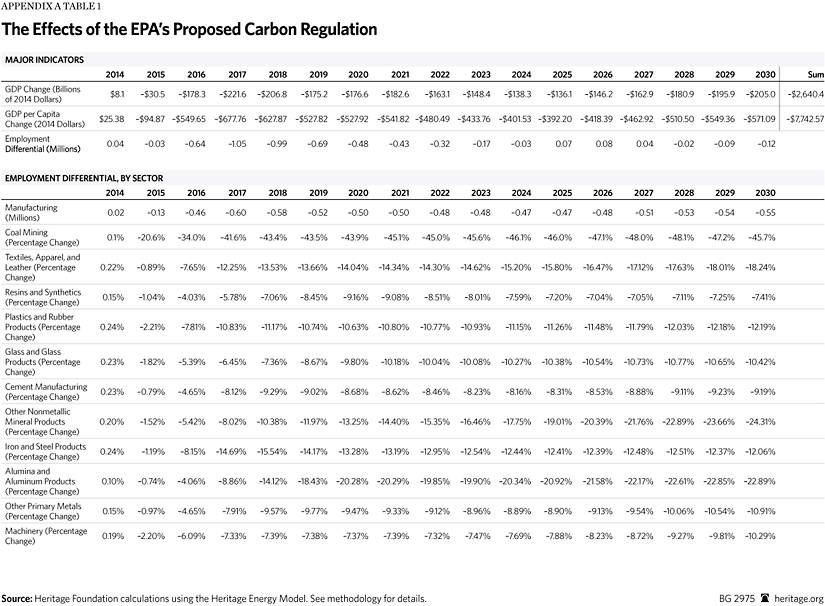
If the Obama Administration continues with its plan to impose the comprehensive set of SCC-guided regulations that was announced in 2013, we can expect the following economic impacts by the year 2030:
- An average employment shortfall of nearly 300,000 jobs,
- A peak employment shortfall of more than 1 million jobs,
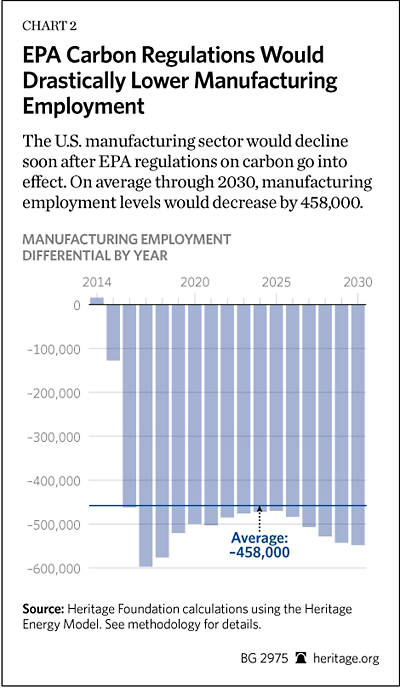
- 500,000 jobs lost in manufacturing,
- Destruction of more than 45 percent of coal-mining jobs,
- An aggregate GDP loss of more than $2.5 trillion (inflation-adjusted), and
- A total income loss of more than $7,000 per person (inflation-adjusted).
The Energy Information Administration (EIA) has also analyzed the economic impact of a carbon tax using essentially the same model and found similarly devastating results. Comparing the EIA’s $25-carbon-tax estimate with the baseline shows more than $2 trillion in lost GDP from 2014 to 2030 and a peak employment differential of 1 million lost jobs.[17]
Exaggerated Benefits
While not explicitly acknowledging such costs, the Administration posits a number of benefits from its proposed regulations that are derived from measurements of harm avoided. However, these benefits are based on faulty assumptions and/or misrepresentations of the actual state of climate science that result in overstatements of both the risks from climate change and the mitigating impact of the proposed regulations. To support the Administration’s climate change regulations, the White House released two climate reports in 2014.
The National Climate Assessment. In May, the U.S. Global Change Research Program published its third National Climate Assessment, which argues that human-induced warming is already affecting a number of regions in the country and that the effects will only worsen.[18] The report determines that manmade greenhouse gas emissions will accelerate sea-level rise, increase the intensity and frequency of extreme weather, and warm the planet at an unsustainable rate, adversely affecting everything from human and ecosystem health to transportation, forestry, and agriculture.[19] Yet ample evidence suggests that the report is filled with bias, cherry-picking, exaggerated claims, and the failure to put assertions into context.[20] Examples of areas where the report goes wrong include:
- The claim of a 97 percent consensus and settled science on manmade warming. There is broad agreement, even among those labeled as skeptics, that the earth has warmed moderately over the past 60 years and that some portion of that warming can be attributed to anthropogenic carbon dioxide emissions. Such broad agreement is largely the source of the 97 percent figure, although even that number is riddled with falsity.[21] However, there is no consensus that temperatures are increasing at an accelerating rate or that we are headed toward a climate catastrophe.[22]
- Sea-level rise. While the sea level is rising, frequent claims and predictions of accelerating sea-level rise are not borne out in the data.[23] In fact, sea-level rise has slowed recently. A March 2014 report in Nature shows that the rate of increase has declined so much that climatologist Judith Curry said it “makes the 21st century of sea level rise projections seem like unjustified arm waving.”[24]
- Extreme weather. The latest report on the science from the Intergovernmental Panel on Climate Change and analysis provided by the Obama Administration’s National Climatic Data Center conclude that there is not a case for extreme weather increases—no significant trends for floods, droughts, hurricanes, or tornadoes.[25]
- Melting ice caps. Arctic Alaskan ice has melted, but global sea ice, which includes both Arctic and Antarctic ice, is above average. Antarctica is experiencing record sea ice, and even the Arctic has experienced remarkable gains in sea ice after one of its coldest summers on record.[26]
- Climate sensitivity and climate models. Since 2011, 16 studies published in peer-reviewed literature found that the median equilibrium climate sensitivity (the effect of doubling the carbon dioxide in the atmosphere) averages close to 2 degrees Celsius (over all the studies), 40 percent lower than the 3.3 degrees Celsius projected by the climate reports.[27] Many of the models that the federal government used to promulgate climate regulations projected a 0.3 degree Celsius warming over the past 17 years, when in reality no warming occurred, even though CO2 emissions increased. The failure to include the new studies on climate sensitivity and the inaccuracy of the models exaggerate many of the report’s other dire climate predictions.
These inaccuracies are merely the topline claims most commonly recycled by the media and proponents of government-imposed action on climate change. Climatologists have thoroughly critiqued the National Climate Assessment, pointing out its many inaccuracies and misrepresentations.[28]
Little Climate Impact from Regulations. The second report, released by the Obama Administration in July, warns that accelerating climate change brings accelerating costs. It claims that costs will increase by 40 percent for each decade of inaction on climate change.[29] The report fails to mention, however, that the Administration’s climate policies come with steep price tags of lost jobs and reduced GDP as outlined above. Furthermore, that steep price could be all for naught because the proposed regulations promise little actual impact on possible temperature changes.
Using a climate calculator and model developed by the EPA, climatologists Paul Knappenberger and Pat Michaels project that the EPA’s climate regulations will mitigate 0.02 of a degree Celsius warming by the end of the century.[30] The United States could effectively bring all economic activity to a halt and cut carbon emissions to zero in the U.S. and still lower average temperatures by no more than 0.2 degree Celsius by 2100. In other words, the Administration’s climate policy is extremely costly and extremely ineffective, even if climate change were a significant problem, which the literature indicates it is not.[31]
Time to Step Back and Reevaluate
Given the uncertainties surrounding the science of climate change, the minuscule impact of the suggested remedies, and the high cost of proposed regulations, now is a good time to step back from precipitous actions and exaggerated rhetoric. Now is the time to reexamine the Administration’s proposals in light of the latest science and current global climate trends, with a view to crafting cost-effective responses to whatever actual problem exists.
As detailed in this study, the current use of SCC estimates is particularly problematic. Although possibly interesting as academic exercises, at this point the SCC models lack sufficient credibility for cost-benefit analysis. Arbitrary increases in SCC values artificially boost the claimed benefits for emissions reductions in agency cost-benefit analyses on everything from power plant regulations to rules on kitchen appliances. The EPA’s SCC has already been used to slow coal mine expansions and could be used to stall or slow construction of new highways, pipelines, export terminals, and other large infrastructure development.[32]
We are at serious risk of inflicting severe economic damage on ourselves and future generations on a quest that is quixotic at best. Science is a sober and rational endeavor. The current push for radical reductions in greenhouse gas emissions is neither.
—Kevin D. Dayaratna, PhD, is Senior Statistician and Research Programmer in the Center for Data Analysis, of the Institute for Economic Freedom and Opportunity, at The Heritage Foundation. Nicolas D. Loris is Herbert and Joyce Morgan Fellow in the Thomas A. Roe Institute for Economic Policy Studies, of the Institute for Economic Freedom and Opportunity, at The Heritage Foundation. David W. Kreutzer, PhD, is a Research Fellow for Energy Economics and Climate Change in the Center for Data Analysis.
Appendix B: Methodology
Overview of Heritage Energy Model. This analysis utilizes the Heritage Energy Model, a derivative of the National Energy Model System 2014 Full Release.[33] The Energy Information Administration of the Department of Energy and various nongovernmental organizations use NEMS for a variety of purposes, including forecasting the effects of energy policy changes on a plethora of leading economic indicators. The methodologies, assumptions, conclusions, and opinions in this report are entirely the work of statisticians and economists at The Heritage Foundation’s Center for Data Analysis and have not been endorsed by and do not necessarily reflect the views of the developers of NEMS.
HEM is based on well-established economic theory as well as historical data and contains a variety of modules that interact with each other for long-term forecasting. In particular, HEM focuses on the interactions among:
- The supply, conversion, and demand of energy in its various forms;
- American energy and the overall American economy;
- The American energy market and the world petroleum market; and
- Current production and consumption decisions as well as expectations about the future.[34]
These modules include:
- A macroeconomic activity module,[35]
- A transportation demand module,
- A residential demand module,
- An industrial demand module,
- A commercial demand module,
- A coal market module,
- An electricity market module,
- A liquid fuels market module
- An oil and gas supply module,
- A renewable fuels module,
- An international energy activity module, and
- A natural gas transmission and distribution module.
HEM is identical to the EIA’s NEMS with the exception of the commercial demand module. Unlike NEMS, this module does not make projections regarding commercial floor-space data of pertinent commercial buildings. Other than that, HEM is identical to NEMS.
Overarching the above modules is an integrating module that consistently cycles, iteratively executing and allowing the various modules to interact with each other. Unknown related variables, such as variables that are a component of a particular module, are grouped together, and a pertinent subsystem of equations and inequalities corresponding to each group is solved via a variety of commonly used numerical analytic techniques, using approximate values for the other unknowns. Once each group’s values are computed, the next group is solved similarly and the process iterates. Convergence checks are performed for each price and quantity statistic to determine whether subsequent changes in that particular statistic fall within a given tolerance. After all group values for the current cycle are determined, the next cycle begins. For example, in cycle j, a variety of n pertinent statistics represented by the vector, ![]() is obtained.[36] HEM provides a number of diagnostic measures, based on differences between cycles, to indicate whether it has achieved a stable solution.
is obtained.[36] HEM provides a number of diagnostic measures, based on differences between cycles, to indicate whether it has achieved a stable solution.
Carbon Tax Simulations and Diagnostics. We used HEM to analyze the economic effects of instituting a $37 carbon tax based on the EPA’s estimation of the social cost of carbon, assuming a discount rate of 3 percent. HEM is appropriate for this analysis, and similar models have been used in the past to understand the economic effects of other carbon tax proposals.[37] In particular, we conducted simulations running a carbon fee that started in 2015 at $37 (in 2007 dollars per metric ton of carbon dioxide) and followed the schedule presented by the Obama Administration through the year 2040.[38] We chose a revenue-neutral carbon tax in which 100 percent of the carbon tax revenues are returned directly to taxpayers. We ran HEM for 12 cycles to get consistent feedback into the macroeconomic activity module, which provided the figures presented in this study.
Based on differences between cycles, the diagnostic tests suggested at the end of the 12 runs that the forecasts provided by the model had stabilized. The 12 cycles were therefore sufficient to attain meaningful convergence, thus providing the macroeconomic statistics from which we can make informative statistical inferences.