Homicide rates in the United States have risen in recent years, reaching 6.81 homicides per 100,000 people in 2021.REF Many commentators have opined on what could explain the rise in crime.REF
In a recent report, Jim Kessler and Kylie Murdock of the Third Way think tank claim that “red” states have had higher homicide rates than “blue” states over the past 20 years. This Issue Brief takes a closer look at this question and finds a number of critical flaws in the Third Way report.REF Correcting for these flaws produces the exact opposite conclusion.
Failure to Analyze Homicide Data Across Localities
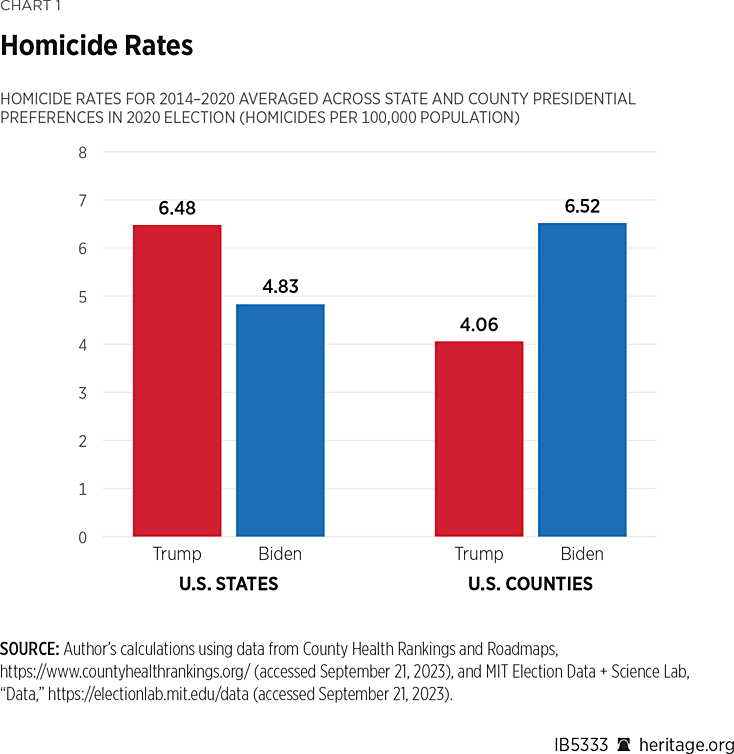
The Third Way authors claim that there is a difference between the murder rates in “red” states and “blue” states. Averaging these rates between the years 2014 and 2020 across states that voted for Donald Trump during the 2020 election yields an aggregate homicide rate of 6.48 per 100,000 people, while averaging across states that voted for Joe Biden yields a homicide rate of 4.83 per 100,000 people.
However, drawing conclusions from state-level homicide data in such a manner is flawed, as each state consists of a combination of federal, state, county, and local law enforcement agencies, as well as prosecutors with different approaches to law enforcement often based on highly divergent political beliefs. Violations of state law are prosecuted largely at the county or city level and, thus, amalgamating data across such units neglects important variation in these different approaches.REF Looking at homicide rates by county, states show skewed distributions with many counties having little or no homicides, and a handful of counties with excessively high homicide rates. Thus, state homicide rates can be heavily influenced by a few counties. When those counties have different politics from the rest of the state, it can flip the conclusion about the association between political identifications and homicides.
As a result, after averaging homicide rates across counties during the same time horizon, a markedly different story from the Third Way’s narrative emerges. Averaging across all counties that voted for Donald Trump yields an aggregate homicide rate of 4.06 per 100,000 people, while averaging across counties that voted for Joe Biden yields a homicide rate of 6.52 per 100,000 people. These statistics are presented in Chart 1.

Failure to Consider Changing Electoral Results
Third Way held “red” states and “blue” states constant in terms of how they voted in the 2020 presidential election. This approach is fundamentally flawed because electoral sentiment changed across the time period used for the study. For example, although President Biden won Arizona in 2020, the previous Democrat who won the state was Bill Clinton in 1996. Similarly, Donald Trump won Florida in both 2016 and 2020, despite the fact that Barack Obama had won the state in 2008 and 2012.
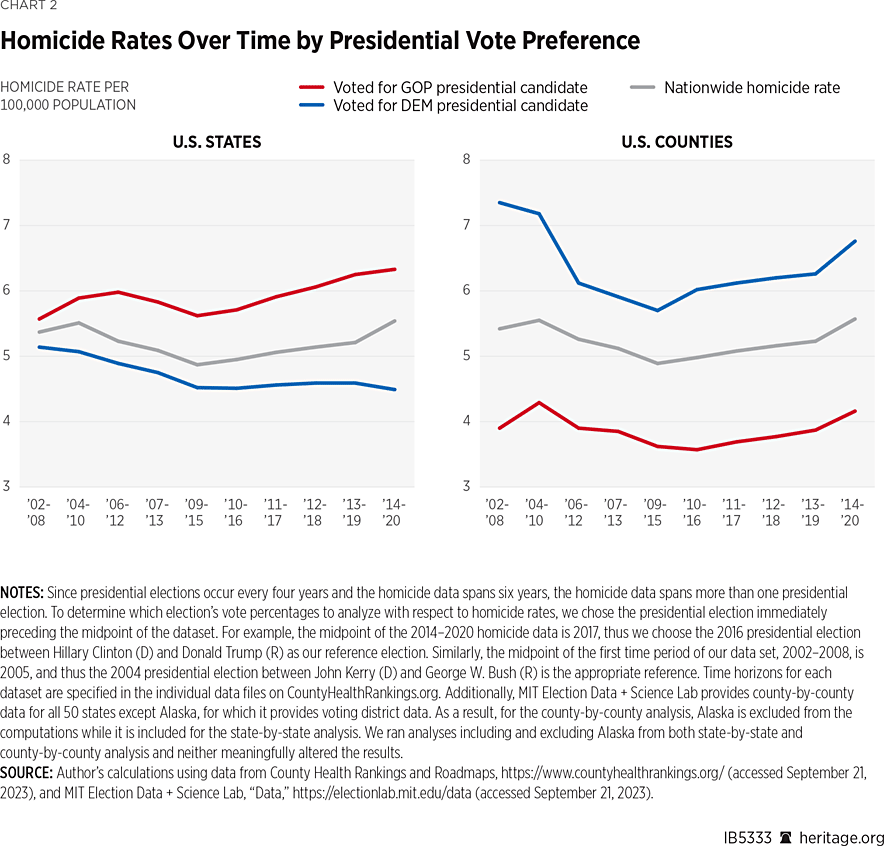
We repeated Third Way’s estimate of homicide rates over time but corrected for changes in voting behavior. Observations of County Health Rankings & Roadmaps data show averages over a period of six years. The most recent dataset provides homicide rates from 2014 to 2020.REF We analyzed this, and analogous, time periods going back to 2002 to 2008 in terms of the respective presidential elections corresponding to each time period, using election data compiled by MIT Election labs.REF These results are presented in Chart 2.

While red states consistently have had higher homicide rates than blue states, blue counties have consistently had higher homicide rates than red counties, as shown in Chart 2. Specifically, homicide rates in red states (as corrected) ranged from 5.57 per 100,000 people between 2002 and 2008 to 6.33 per 100,000 people between 2014 and 2020, while in blue states (as corrected) these rates ranged from 5.14 per 100,000 people between 2002 and 2008 to 4.49 per 100,000 people between 2014 and 2020. Homicide rates in red counties, on the other hand, ranged from 3.90 per 100,000 people between 2002 and 2008 to 4.16 per 100,000 people between 2014 and 2020, while in blue counties these rates varied from 7.35 per 100,000 people between 2002 and 2008 to 6.76 per 100,000 people between 2014 and 2020.
Conclusion
Statistical analysis is useful for analyzing data to inform public policy. It is crucial, however, to analyze data carefully while taking into account critical factors influencing trends of interest. Proper analysis of the question posed by the Third Way suggests that the nation has a blue county murder problem that has persisted for the past 20 years.
Kevin Dayaratna, PhD, is Chief Statistician, Data Scientist, and Senior Research Fellow in the Center for Data Analysis at The Heritage Foundation. Alexander Gage is a former Research Assistant for Economic Policy in the Center for Data Analysis.


