The Heritage Foundation’s Blueprint for Balance calls for reduced federal spending. Lower expenditures directly reduce the budget deficit, but they also have indirect effects on the federal budget through their effects on the economy. Incorporating these macroeconomic effects into a dynamic budget score provides a richer picture of how the Blueprint would balance the budget and increase economic output.
Accounting for these economic effects, the changes recommended in the Blueprint would balance the federal budget approximately four years sooner than estimated by the standard procedure that omits macroeconomic effects. Real GDP growth under the Blueprint is about 0.1 percent per year higher, resulting in a nominal GDP that is 1.0 percent higher at the end of the budget window than the model’s estimate of baseline policy.
The macroeconomic effects were modeled using a variant of the Solow growth model,1 a standard tool for explaining how capital accumulation affects economic output over time. Capital markets in the model match saving from both the private and public sectors with domestic investment and net international capital flows. The interest rate adjusts to bring the capital market into equilibrium, in which every dollar saved is matched with a dollar invested.
When the federal government runs a budget deficit, it reduces the total amount of saving in the economy. Larger deficits cause interest rates to rise, which reduces investment, a phenomenon known as “crowding out.” Reducing the deficit or even running a surplus has the opposite effect. More public saving lowers interest rates and increases investment. The Blueprint reduces crowding out so that gross private domestic investment is about 5.3 percent higher than the baseline at the end of the 10-year window and GDP is about 1.0 percent higher.
The lower interest rates produce substantial second-order effects on federal outlays. Balancing the budget has a double effect on reducing expenditures, both by reducing the amount of debt on which interest is owed and by reducing the amount of interest owed on any remaining debt. The model estimates that interest rates on federal debt under the Blueprint are about 75 basis points lower than in the baseline at the end of the 10-year window.
Chart 2 shows the difference in the federal budget deficit for both static and dynamic modeled versions of the Blueprint budget, relative to the CBO baseline. The line labeled “MODELED CBO PROJECTIONS” is the modeled estimate based on the CBO budget deficit projections as reported in the CBO’s January 2019 Budget and Economic Outlook.2 The lines labeled “HERITAGE BLUEPRINT” are the traditional (static) estimate of the Blueprint and the dynamic estimate of the Blueprint.
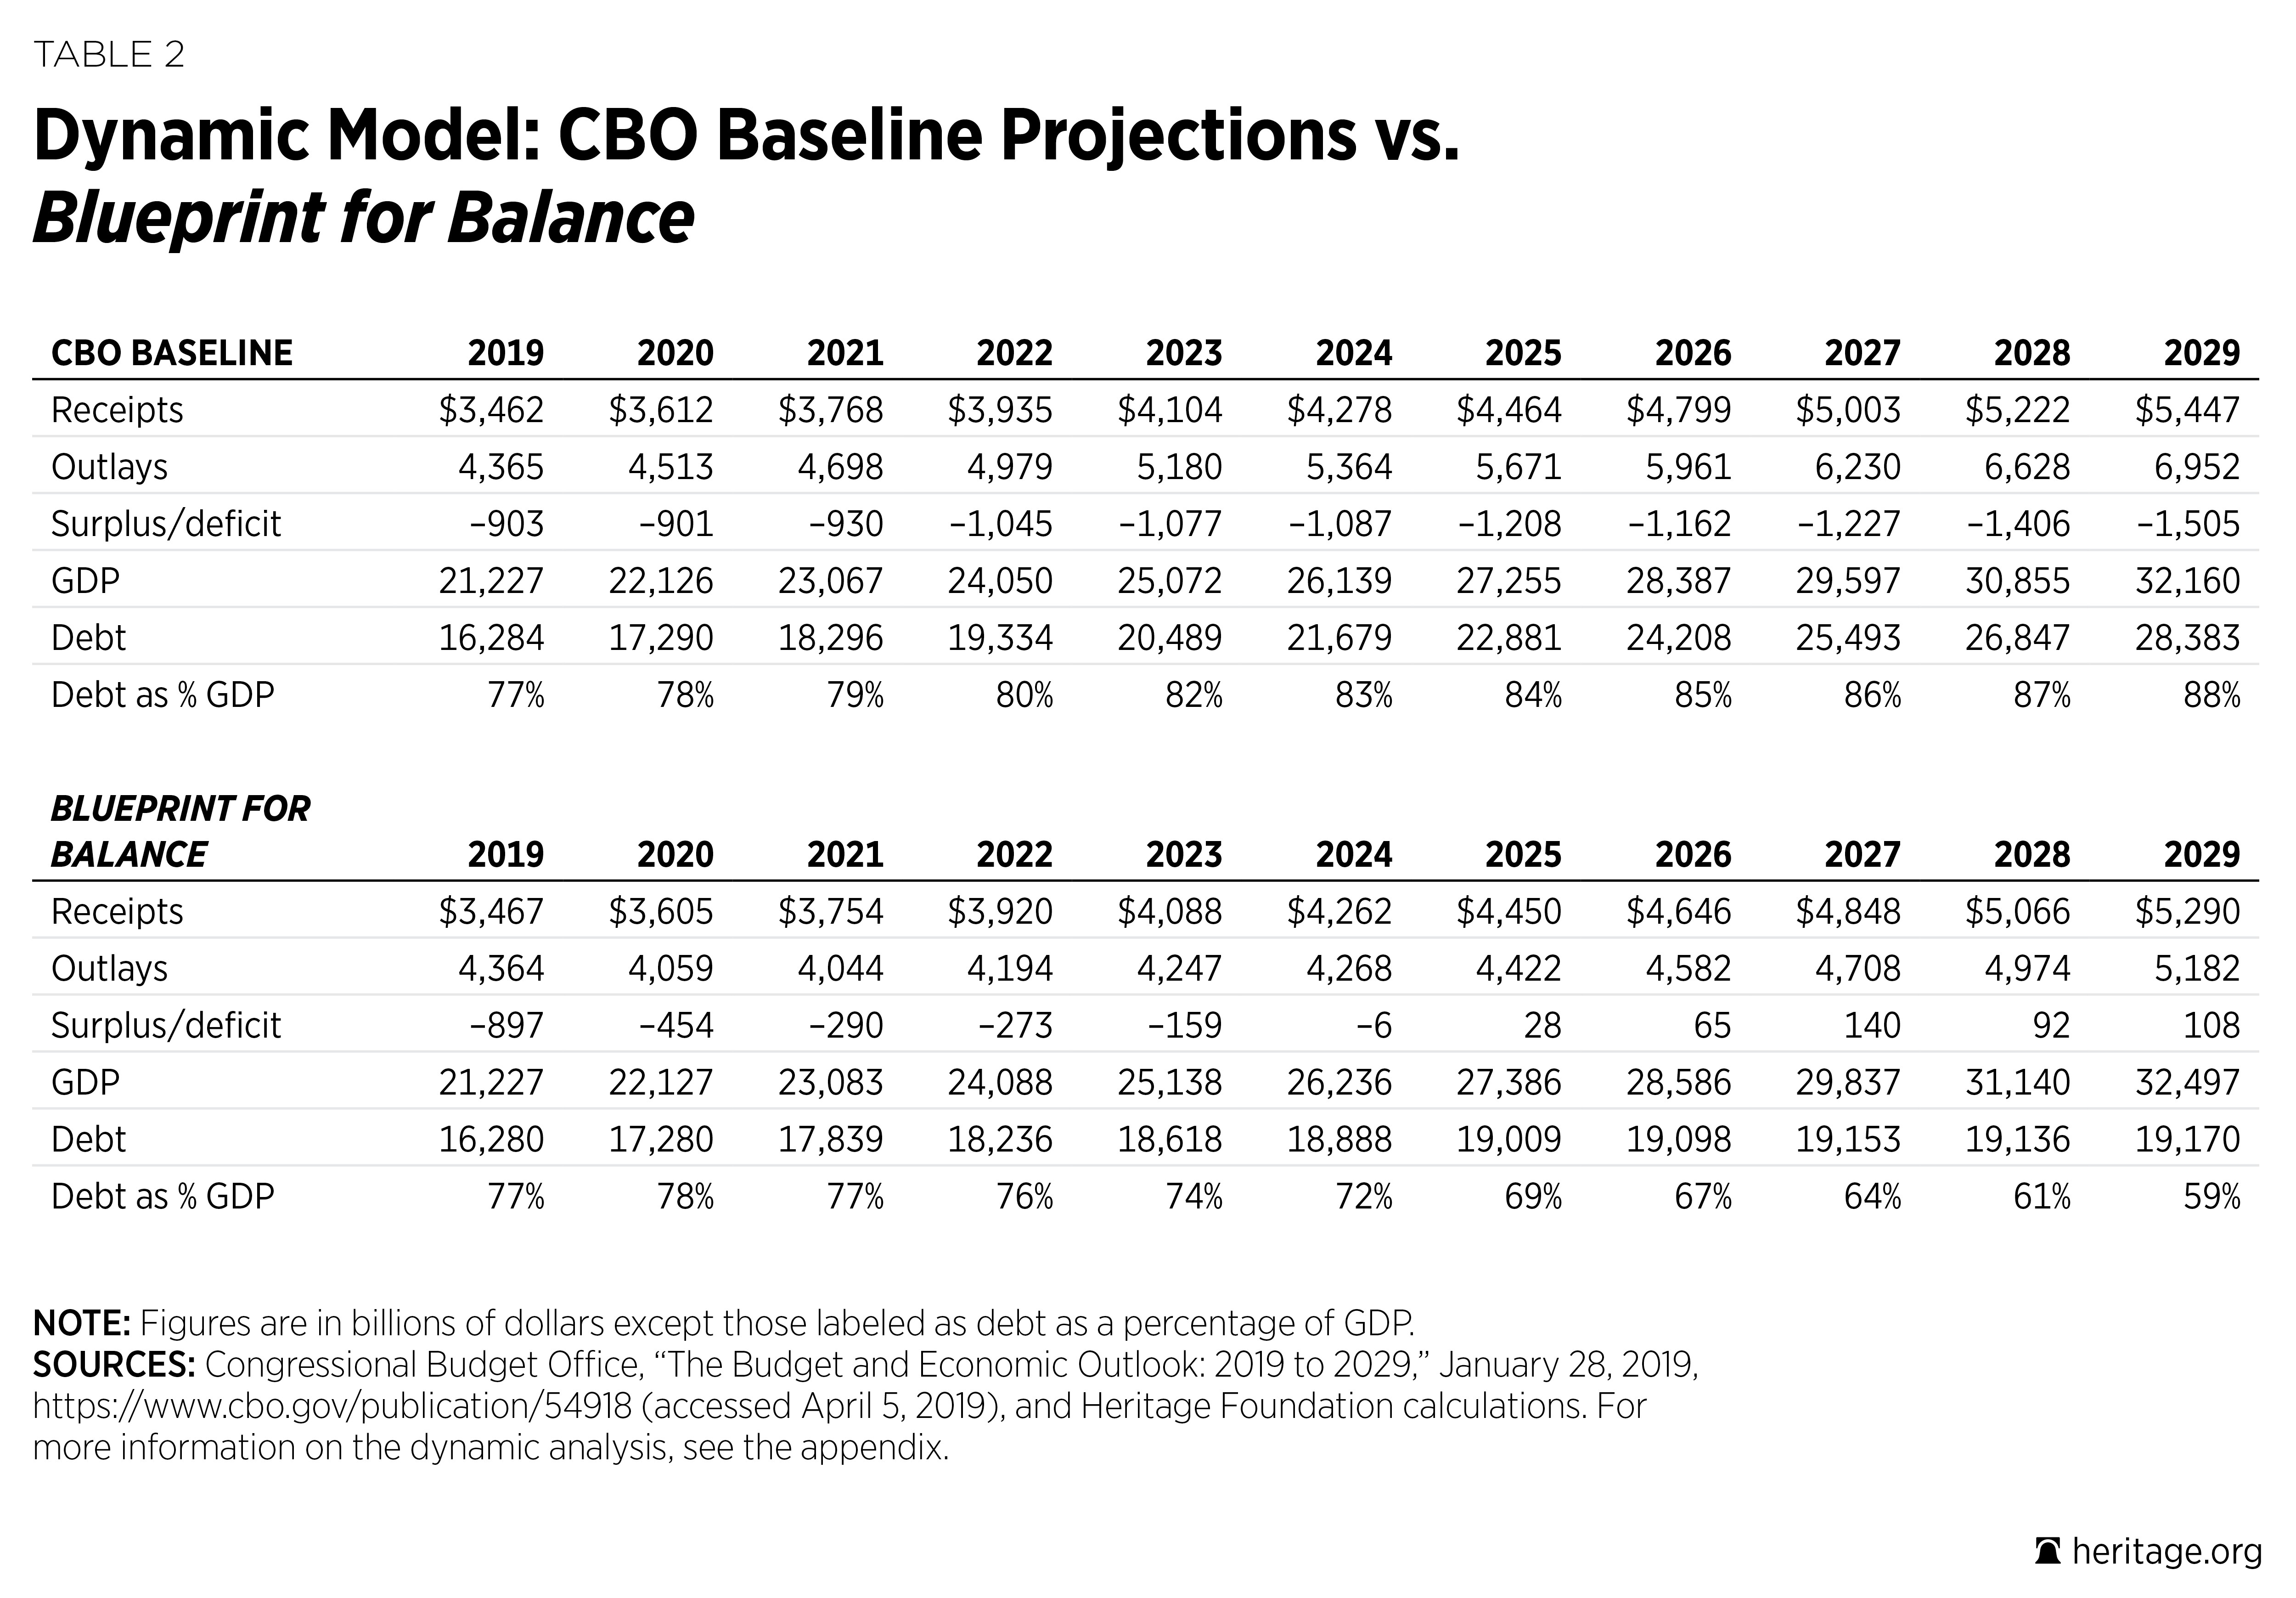
Table 2 shows that the Blueprint balances the budget entirely with static changes in receipts and outlays. The dynamic effects of smaller deficits and pro-growth tax policy provide modest increases in receipts and decreases in outlays, shifting the date at which the Blueprint reaches budgetary surplus forward by four years. Under the dynamic score, the Blueprint balances in 2025.
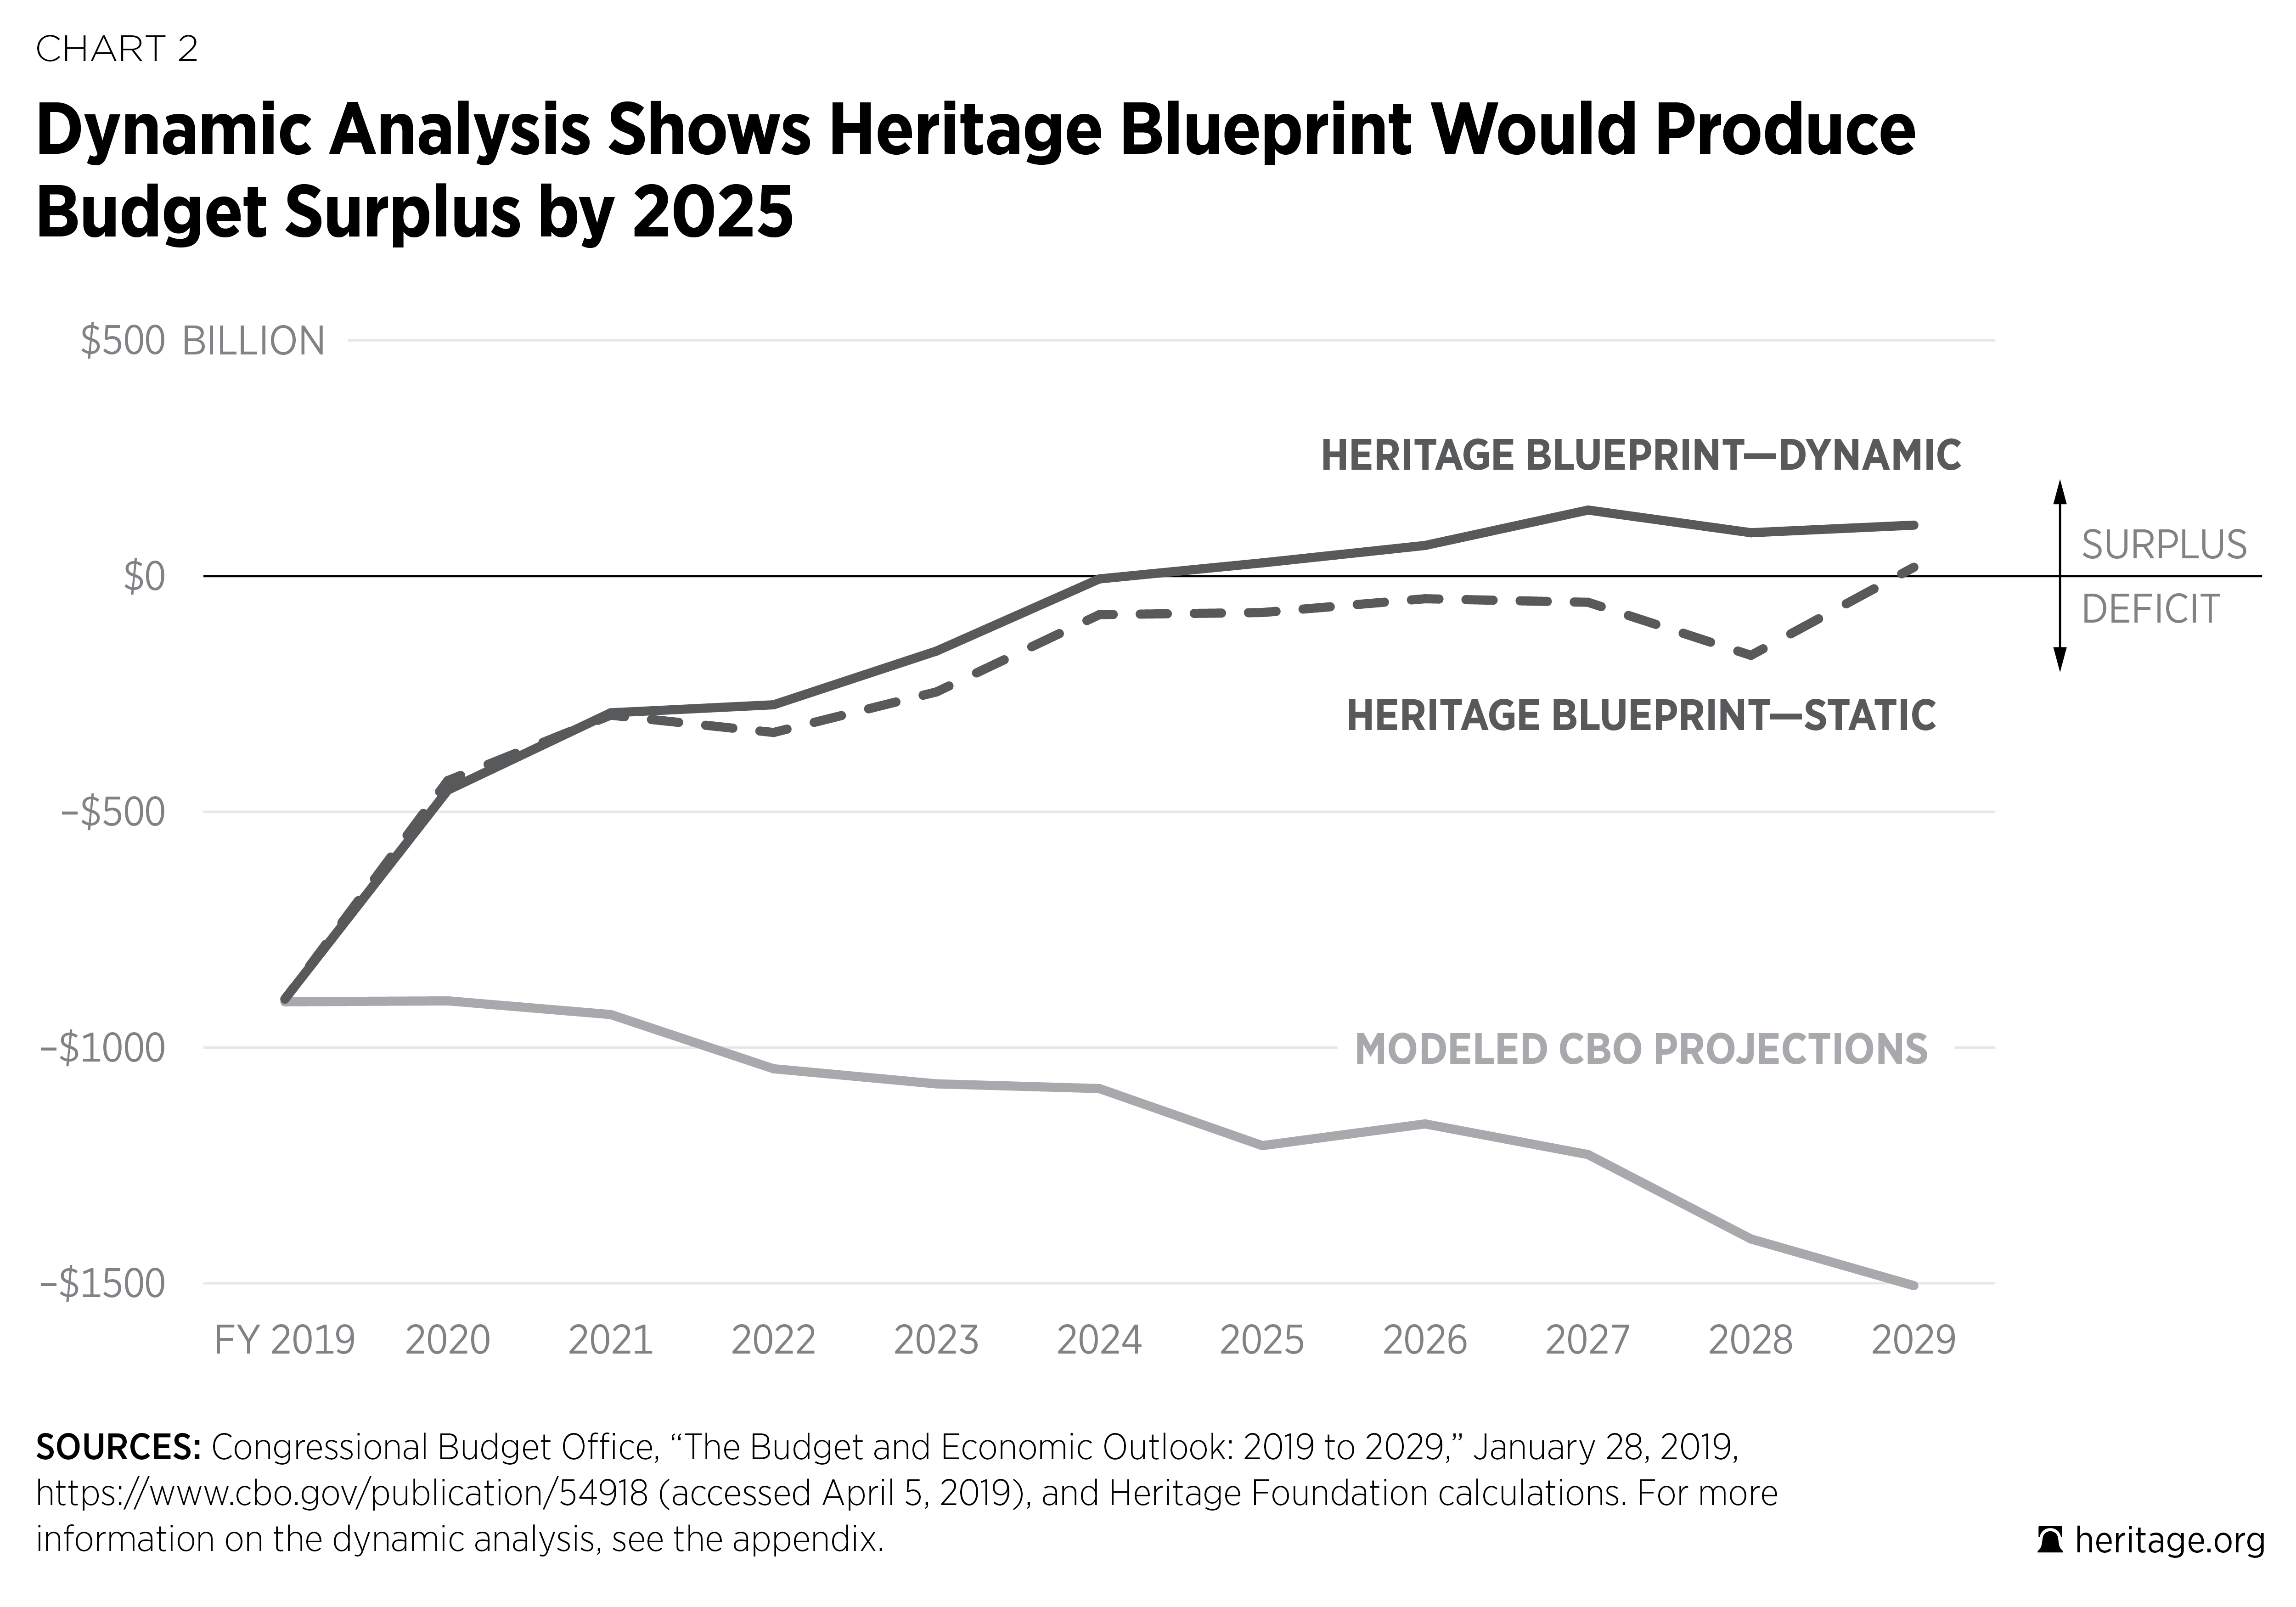
Table 2 shows the modeled output for the baseline and Blueprint converted to dollar figures. The reason for the slight differences between the modeled figures and other published figures is that the model abstracts from a significant amount of detail to summarize the macro effects of the deficit on capital markets. Comparing the modeled output of the two budgets provides an estimate of the economic effects of adopting the Blueprint for Balance, most notably a substantial reduction in debt held by the public and an increase in gross domestic product.
Endnotes
- For additional detail about the modeling methodology, see Appendix, “Methodology,” in Kevin Dayaratna, Parker Sheppard, and Adam N. Michel, “Tax Cuts in Every Congressional District in Every State,” Heritage Foundation Backgrounder No. 3333, July 23, 2018, https://www.heritage.org/taxes/report/tax-cuts-every-congressional-district-every-state, and Parker Sheppard, “A Dynamic Estimate of the FY 2020 Blueprint for Balance,” Heritage Foundation Backgrounder, forthcoming.
- Congressional Budget Office, The Budget and Economic Outlook: 2019 to 2029, January 2019, https://www.cbo.gov/publication/54918 (accessed April 14, 2019).