
During the third quarter (Q3) of 2014, enrollment in employer-sponsored coverage continued to decline, while Medicaid enrollment continued to grow. However, enrollment in individual-market plans—which substantially increased in both of the first two quarters—also declined by 357,000 during the third quarter. The net result was that total enrollment decreased by 160,000 individuals during the third quarter. That was because the declines in private coverage (individual and employer plans) during the quarter were not fully offset by the continued growth in Medicaid enrollments.
Health insurance coverage changes in 2014 have been driven by implementation of the Affordable Care Act (ACA), commonly known as Obamacare. As of the end of the third quarter, the net effects for 2014 are: 5.83 million more people with individual-market coverage, 4.93 million fewer individuals with employment-based coverage, and 7.49 million more individuals covered by Medicaid. Therefore, for the first nine months of 2014 the decline in employer-based coverage offset 85 percent of the increase in individual-market coverage, producing a net gain in private market coverage of only 893,000 individuals. Adding that figure to the 7.49 million Medicaid enrollment increase means that 8.38 million Americans gained coverage during the first three quarters of 2014, but 89 percent of that gain came from expanding Medicaid.
Changes in Private Coverage Enrollment
Health insurers file quarterly reports with state regulators, and data from those reports for Q3 2014 are now available.[1] The three relevant market subsets for this analysis are (1) the individual market; (2) the fully insured employer-group market; and (3) the self-insured employer-group market.[2] Table 1 reports the changes in private health insurance enrollment during the first, second, and third quarters of 2014, along with the net changes for the combined nine-month period.
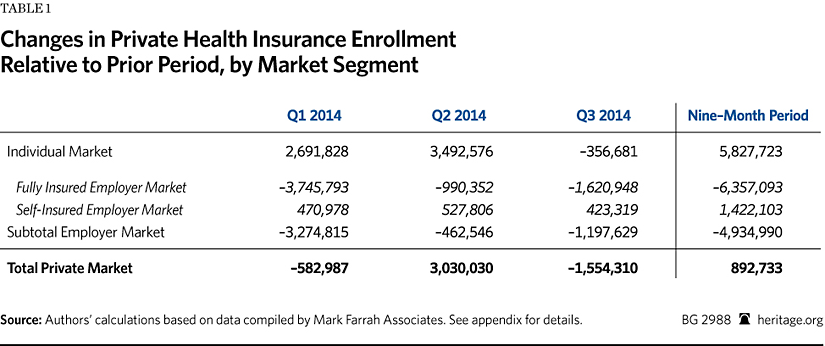
The data show that enrollment in individual-market coverage increased by almost 2.7 million individuals in Q1 2014 and by nearly 3.5 million more in Q2, but declined by 357,000 in Q3. Thus, the net increase in individual-market coverage during the first nine months of 2014 was a bit less than 5.83 million individuals.
Another big coverage change during 2014 was the significant decline in the number of individuals with coverage through fully insured employer group plans. Enrollment in such plans dropped by 3.75 million individuals in Q1 2014, by 990,000 more in Q2, and by a further 1.62 million in Q3. Thus, during the first nine months of 2014, the number of individuals with coverage through a fully insured employer group plan decreased by 6.36 million.
In contrast, enrollment in self-insured employer plans modestly increased in each quarter—by 471,000 in Q1, by 528,000 in Q2, and by 423,000 in Q3—for an enrollment gain during the first nine months of 1.42 million individuals.
When the data for the two segments of the employer-group market are combined, the net results were decreased employer-sponsored coverage of almost 1.2 million individuals during Q3, and of 4.93 million for the first three quarters of 2014.
The net reductions in employer-group coverage are explained by employers discontinuing coverage for some or all of their workers or, in some cases, individuals losing access to such coverage due to employment changes. While it is not possible to determine from the data the subsequent coverage status of individuals who lost group coverage, there are only four possibilities: (1) some obtained replacement individual-market coverage (either on or off the exchanges); (2) some enrolled in Medicaid; (3) some enrolled in other coverage for which they are eligible (such as a plan offered by their new employer, a spouse’s plan, a parent’s policy, or Medicare); and (4) some became uninsured.
If individuals lost group coverage, but obtained new coverage under either another employer group plan or one in the individual market, they would then be counted in the enrollment figures for those submarkets. Similarly, if individuals transitioned to Medicaid, they would be counted in the Medicaid enrollment figures reported by the Centers for Medicare and Medicaid Services (CMS).
As Table 1 shows, during the first nine months of 2014, net total enrollment for all three segments of the private coverage market increased by only 893,000 individuals. That was because reduced enrollment in employer-sponsored coverage offset 85 percent of the enrollment gain in individual-market coverage during the first nine months of 2014.
Changes in Medicaid and Children’s Health Insurance Program (CHIP) Enrollment
The ACA required states to expand Medicaid eligibility to all individuals with incomes below 138 percent of the federal poverty level who are not otherwise eligible for Medicaid under prior rules. Those individuals are able-bodied, working-age adults, the vast majority of whom do not have dependent children. However, in June 2012, the U.S. Supreme Court ruled that Congress could not force states to adopt that expansion. Since then, 27 states and the District of Columbia have chosen to adopt the expansion.
Table 2 shows the changes in Medicaid enrollment during the first, second, and third quarters of 2014, along with the net changes for the combined nine-month period.
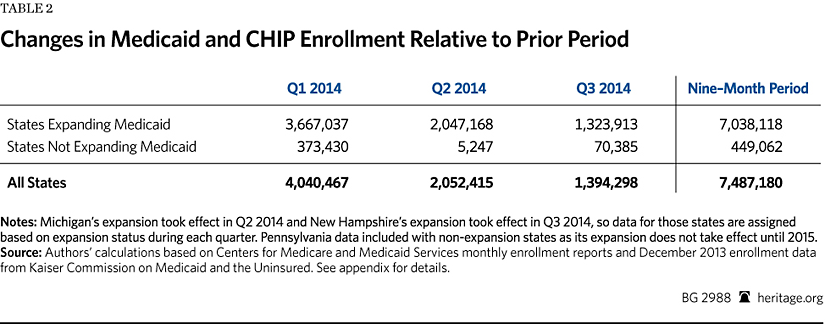
Total Medicaid enrollment for states in which the expansion was in effect increased by 3.67 millionindividuals in Q1 2014, by 2.05 million individuals in Q2, and by 1.32 million individuals in Q3, for a total of 7.04 million during the first nine months of 2014.[3]
The law also changed the standards for determining eligibility for individuals who qualify for Medicaid coverage under prior law. Consequently, most of the states that have not adopted the Medicaid expansion also experienced some increase in enrollment. For the states in which the expansion was not in effect, Medicaid enrollment increased by 449,000 individuals during the first nine months of 2014.
Thus, for the first three quarters of 2014, net total Medicaid enrollment growth for both expansion and non-expansion states combined was 7.49 million individuals—with the states that implemented the Obamacare Medicaid expansion accounting for 94 percent (7.04 million) of that total.
Net Private and Public Coverage Changes
Table 3 summarizes the net changes in private and public health insurance enrollment detailed in Tables 1 and 2. It shows that the second quarter was the only one for which there was a net increase in private coverage—reflecting a jump in individual-market enrollment at the end of the open season period, accompanied by a moderation in the decline of employer-group coverage. It also shows that aggregate enrollment (private and public combined) decreased slightly in the third quarter from its second quarter peak, with 160,000 fewer individuals covered during the third quarter.
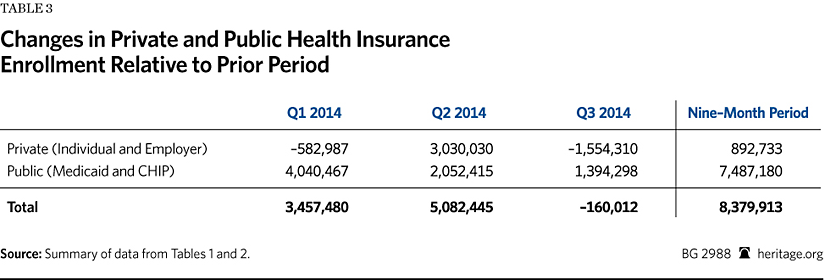
During the first three quarters of 2014, the net increase in private market coverage was only 893,000 individuals, while Medicaid enrollment grew by 7.49 million. Thus, while almost 8.38 million Americans gained coverage during the first nine months of 2014, 89 percent of that gain came from expanding Medicaid.
Trends and Implications
For the individual market, the substantial enrollment growth in Q1 and Q2 was driven by people taking advantage of the new subsidies for coverage offered through the exchanges. The Q3 enrollment drop likely reflects loss of coverage by a portion of those individuals because they either failed to continue paying their premiums or were subsequently determined to be ineligible for subsidies.
At the same time, the declines in employer-group coverage during each of the three quarters effectively offset 85 percent of the net increase in individual-market enrollment for the nine-month period. That strongly indicates that exchange enrollments were overwhelmingly the result of a substitution effect—meaning that the vast majority of those who enrolled in new coverage through the exchanges likely already had coverage through an individual-market or employer-group plan.
During the first three quarters of 2014, the employer-group market registered consistent and significant declines in the number of individuals covered by fully insured plans—offset somewhat by equally consistent, though modest, enrollment growth for self-insured plans. Those divergent enrollment trends may partly reflect other, secular economic factors—such as variations in rates of job creation by industry and firm size—though there have also been reports of some employers shifting from fully insured to self-insured plans during 2014.Because the ACA’s “essential benefit” requirements apply to fully insured small group plans, but not to large group plans, nor to self-insured plans of any size, the law effectively creates a marginal incentive for more employers to shift to self-insured plans. Yet, the data do not indicate that such a shift has yet occurred to any significant degree. With more than 100 million Americans already covered through self-insured employer plans, the quarterly growth rate in self-insured enrollment in 2014 has averaged less than 0.5 percent (or less than 2 percent on an annualized basis), which is not out of line with past experience. That said, the ACA definition of “small group” to which the essential benefit requirements apply is scheduled to increase in 2017 from 50 workers to 100 workers. That change, particularly were it to occur in the context of rising premiums for fully insured group plans, might still become a catalyst for more mid-sized employers to shift to self-insurance in 2015 and 2016.
As noted, the growth in Medicaid enrollment over the course of the year has disproportionately occurred in states with the ACA Medicaid expansion in effect. Indeed, the expansion states accounted for more than 90 percent of total Medicaid enrollment increases in each of the three quarters. However, while the Medicaid rolls continue to grow in those states, the rate of growth is decelerating. For states where the expansion was in effect, Medicaid enrollment growth during Q2 and Q3 was 56 percent and 36 percent, respectively, of the enrollment increase that occurred during Q1. Neither trend is surprising, and both are likely to continue for at least the next several quarters.
Conclusion
With respect to Obamacare’s effects on health insurance coverage, Q3 2014 enrollment data further confirm conclusions previously drawn from the first and second quarter data. To the extent that the introduction of subsidized exchange coverage drove an expansion of the individual market, that expansion has been at the expense of the employer-group market—in particular, the fully insured employer-group submarket. While considerable attention has been paid to the exchanges, they have so far contributed only modestly to the aggregate increase in coverage—accounting for 11 percent of the 8.38 million-person net increase in health insurance enrollment during the first three quarters of 2014. The other 89 percent of net enrollment growth during that period came from the expansion of Medicaid.
In sum, when it comes to increasing the number of individuals with health insurance coverage, Obamacare has proved to be almost entirely a simple expansion of Medicaid. Meanwhile, Obamacare’s offering of subsidized coverage through government-run exchanges has proved to be mainly an overly complicated and unnecessarily expensive—for taxpayers, and for some enrollees as well—mechanism for shifting a portion of the population from employment-based coverage to individual-market plans.
—Edmund F. Haislmaier is Senior Research Fellow in the Center for Health Policy Studies, of the Institute for Family, Community, and Opportunity, at The Heritage Foundation. Drew Gonshorowski is Senior Policy Analyst in the Center for Data Analysis, of the Institute for Economic Freedom and Opportunity, at The Heritage Foundation.Appendix: Data Sources and Adjustments
We used the Mark Farrah Associates dataset, derived from insurer regulatory filings, for private-market enrollment by market segment.[4] We excluded, as not relevant to our analysis, enrollments in: Federal Employees Health Benefits plans, Medicare Advantage plans, and supplemental coverage products (such as dental, vision, prescription drug, Medicare supplemental, and single disease).
For enrollment in self-insured employer plans we used the data reported by Mark Farrah Associates for plans administered by an insurance carrier. Mark Farrah compiles that data from insurer regulatory filings, supplemented by other public and private sources, such as Securities and Exchange Commission (SEC) filings. While the firm’s data on the self-insured market is the most comprehensive available, there are no reliable figures for enrollment in self-insured plans that are administered by independent third-party administrators (TPAs)—that is, TPAs that are not a subsidiary of an insurance carrier. However, based on its research, Mark Farrah Associates believes that truly independent TPAs likely account for no more than 5 percent of the total self-insured market.[5]
For Medicaid and enrollment in the CHIP, we used the figures reported by CMS as they are the most current and include enrollment under both Medicaid fee-for-service and Medicaid managed-care plans. Because the CMS reports do not include enrollment data for December 2013, we used the enrollment figures for that month published in a report by the Kaiser Commission on Medicaid and the Uninsured as the basis for calculating enrollment growth during 2014.[6]
We made several adjustments to the Mark Farrah Associates private-market data to make it as complete and accurate as possible. Specifically:
-
Arkansas has implemented the Medicaid expansion through a so-called private-option design. Under that approach qualified individuals are enrolled in the state’s Medicaid program and then, at the beginning of the month following enrollment, select (or are assigned) coverage through a Silver-level plan offered in the exchange, with Medicaid paying almost all of the premiums. However, this arrangement could result in double counting those individuals in our analysis. The CMS Medicaid enrollment reports note that the Arkansas Medicaid enrollment figures include private-option enrollees, and those individuals do not appear to be included in the Department of Health and Human Services’ (HHS) reported figures for individuals picking an exchange plan. However, the regulatory filings by carriers offering exchange coverage in Arkansas appear to include private-option enrollees in their enrollment counts for individual-market coverage—which, from the carrier perspective, would be appropriate. That these data sources report private-option enrollees differently also explains why the collective increase in individual-market enrollment among the Arkansas exchange carriers during the first half of 2014 was nearly four times the number of individuals that HHS reported as having picked an exchange plan in Arkansas. Separately, the Arkansas Department of Human Services (DHS) reported that the number of individuals who had completed private-option enrollment was 80,049 at the end of March, 176,691 at the end of June, and 204,811 at the end of September.[7]
Consequently, to avoid counting private-option enrollees twice, we subtracted the Arkansas DHS figures from the figures for total individual-market enrollment for Arkansas derived from the Mark Farrah Associates dataset. Thus, our analysis counts Arkansas private-option enrollees as Medicaid enrollees. We believe that this is the correct approach, and the one most comparable to other states, because the Arkansas private-option design is essentially a new variant of Medicaid managed care, and in all other cases individuals covered through private Medicaid managed plans are counted as Medicaid enrollees.
-
Similar to Arkansas, Iowa has implemented part of its Medicaid expansion through a “premium support” program, called “Iowa Marketplace Choice.” Under that arrangement, the state’s Medicaid program pays the premiums for Silver-level plans offered through the exchange—but only for individuals who qualify for the expansion and have incomes between 100 percent and 138 percent of the federal poverty level. Because Iowa carriers include those enrollees in their enrollment counts for individual-market coverage, while CMS includes them in the state’s Medicaid enrollment figures, they are double-counted in the data. Separately, the Iowa Department of Human Services (DHS) reported that the number of individuals enrolled in Iowa Marketplace Choice was 16,643 at the end of March; 23,301 at the end of June; and 25,511 at the end of September.[8] To avoid counting Iowa Marketplace Choice enrollees twice, we subtracted the Iowa DHS figures from the figures for total individual-market enrollment for Iowa derived from the Mark Farrah Associates dataset. Thus, our analysis counts Iowa Marketplace Choice enrollees as Medicaid enrollees.
-
While the Centene Corporation’s principal business is Medicaid managed care, the company also offers exchange coverage in seven states. In two of those states, Arkansas and Massachusetts, that coverage is offered through a subsidiary that only files annual regulatory reports. Using state-level enrollment data reported in Centene’s Q1, Q2, and Q3 2014 SEC filings, we derived figures for the company’s non-Medicaid enrollment growth in those two states and assigned the results to the individual market.
-
Blue Cross Blue Shield of Kansas only files annual reports. We contacted the company and obtained its enrollment figures for the three private-market segments as of the end of March, June, and September, and corrected the figures in the Mark Farrah Associates dataset accordingly.
-
Horizon Blue Cross Blue Shield of New Jersey also only files annual reports. Because it is that state’s dominant carrier and offers coverage on the exchange, we presume that Horizon experienced changes in individual-market and fully insured group-market enrollments. Consequently, we imputed enrollment changes in those two market subsets for Horizon as follows: We first identified 42 other carriers that all have the same characteristics, namely that they (1) are Blue Cross carriers; (2) offer coverage on their state’s exchange; and (3) offer coverage on a statewide basis both on and off the exchanges. Using the Mark Farrah Associates data, we calculated the average enrollment change, relative to Q4 2013, reported by those 42 comparable carriers for each quarter of 2014 for the individual market and the fully insured group market. We then imputed the same percentage changes to Horizon’s enrollments for each quarter, and adjusted the figures for the company reported in the Mark Farrah Associates dataset accordingly.
-
Eight carriers offered coverage through the exchanges that had not offered coverage in the individual or group markets prior to 2014, and for whom data is missing from the Mark Farrah Associates dataset. Seven are carriers that, prior to 2014, only provided Medicaid managed-care coverage. Three of those carriers are in California and four are in New York. Both states released reports that include figures for exchange enrollment by carrier. Thus, for those seven carriers we used the enrollment figures taken from the state exchange reports.[9]
For the eighth carrier, a new consumer-operated and -oriented plan (CO-OP) insurer (Health Republic Insurance of New Jersey), we used the enrollment figure found in a table of CO-OP enrollment and funding compiled and released by the U.S. House of Representatives Committee on Oversight and Government Affairs. The date for this carrier’s enrollment figure is given as April 11, 2014.[10]
-
One carrier (Health Alliance) offered coverage in Illinois and Iowa prior to 2014 and also offered coverage in Nebraska through the exchange in 2014, but data for the company’s Nebraska enrollment is missing from the Mark Farrah Associates dataset. However, the company recently announced that, “based on 2014 performance,” it will not be offering coverage in Nebraska in 2015.[11] Thus, the missing figure for this carrier’s Nebraska enrollment is likely quite small.
-
Finally, we identified five instances of carriers with data missing for one of the three quarters. In the case of one carrier we were able to obtain the missing data from the California Department of Managed Health Care. For the remaining four carriers we corrected for the missing data by carrying forward the figures from the previous quarter.
The net effects of all the foregoing adjustments to the enrollment figures derived from the Mark Farrah Associates dataset were, for Q1, an increase of 152,190 for the individual market, 63,664 for the fully insured group market, and 7,180 for the self-insured group market; for Q2, an increase of 71,931 for the individual market, 71,325 for the fully insured group market, and a decrease of 17,850 for the self-insured group market; and for Q3, an increase of 44,292 for the individual market, 52,299 for the fully insured group market, and a decrease of 6,703 for the self-insured group market.


