Abstract: The great and calamitous fiscal trends of our time—dependence on government by an increasing portion of the American population, and soaring debt that threatens the financial integrity of the economy—worsened yet again in 2010 and 2011. The United States has long reached the point at which it must reverse the direction of both trends or face economic and social collapse. Yet policymakers made little progress on either front since the 2010 Index of Dependence on Government was published. Today, more people than ever before—67.3 million Americans, from college students to retirees to welfare beneficiaries—depend on the federal government for housing, food, income, student aid, or other assistance once considered to be the responsibility of individuals, families, neighborhoods, churches, and other civil society institutions. The United States reached another milestone in 2010: For the first time in history, half the population pays no federal income taxes. Related to these disturbing trends, publicly held debt continued its amazing ascent without any plan by the government to pay it back. As if those circumstances were not dire enough, the country is about to witness the largest generational retirement in world history by a population that will depend on currently bankrupted pension and health programs.
The 2012 Index of Dependence on Government highlights the gathering fiscal storm clouds. Unsustainable increases in dependent populations predate the recent recession—and continuing economic morass—and have continued to rise since the economy collapsed in 2008 and 2009. There is one silver lining to those clouds: A few policymakers and independent public policy groups have advanced plans for restoring fiscal balance in Washington. Among them is The Heritage Foundation. Heritage calls its fiscal plan Saving the American Dream. The Heritage plan reforms and funds those government programs that matter most to people who need the government’s help, and it frees the private sector to create the millions of jobs that will dramatically reduce the growth of dependence on government.
Virtually no issue so dominates the current public policy debate as the future financial health of the U.S. government. Americans are haunted by the specter of enormously growing mountains of debt that suck the economic and social vitality out of this country. Only the intrepidly stagnant and jobless economic recovery garners more attention, and many are beginning to believe that even that sluggishness is tied to the nation’s growing burden of publicly held debt.[1]
Of course, the roots of the problems produced by the great and growing debt lie in the spending behaviors of the federal government. Annual deficits far greater than the government’s revenue are fueling explosive levels of debt. One such significant area of rapid growth is those programs that create economic and social dependence on government.
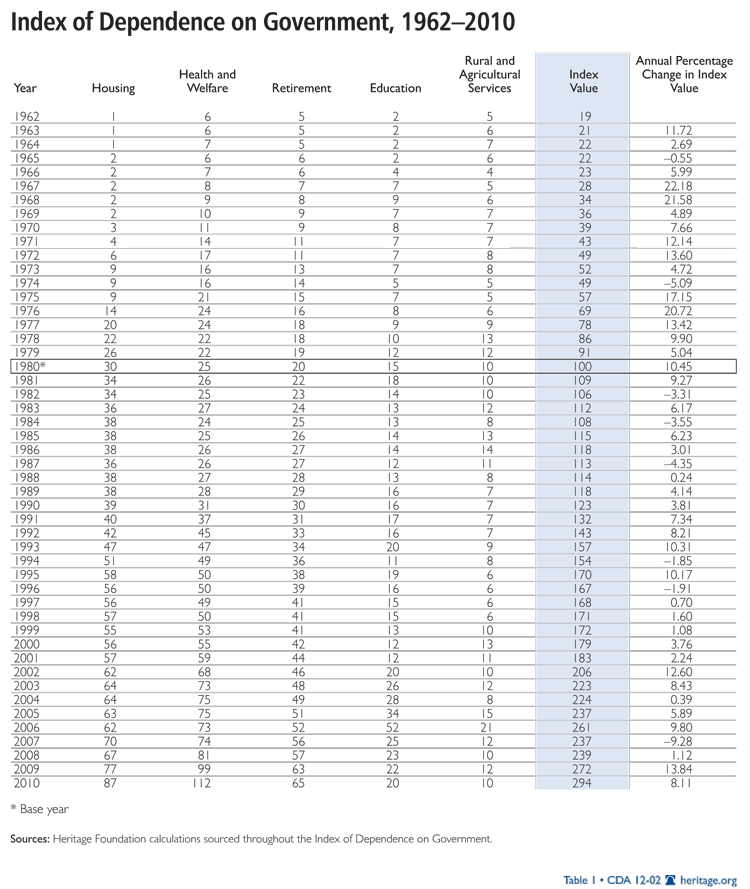
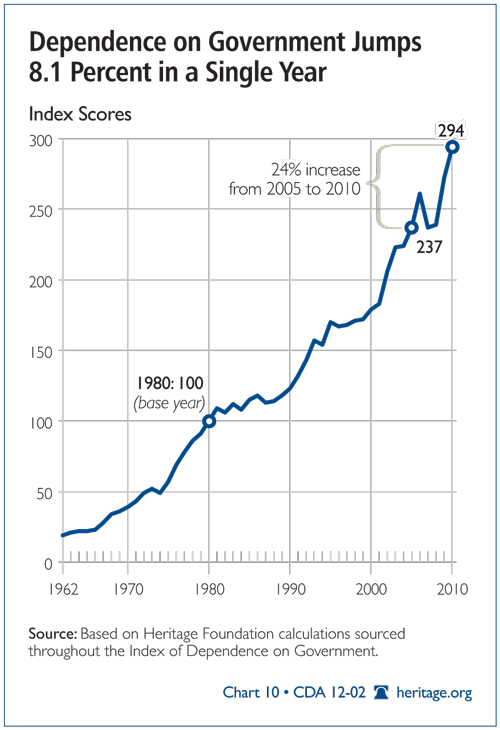
The 2012 publication of the Index of Dependence on Government marks the tenth year that The Heritage Foundation has flashed warning lights about Americans’ growing dependence on government programs. For a decade, the Index has signaled troubling and rapid increases in the growth of dependence-creating federal programs, and every year Heritage has raised concerns about the challenges that rapidly growing dependence poses to this country’s republican form of government, its economy, and for the broader civil society. Index measurements begin in 1962; since then, the Index score has grown by more than 15 times its original amount. This means that, keeping inflation neutral in the calculations, more than 15 times the resources were committed to paying for people who depend on government in 2010 than in 1962. In 2010 alone, the Index of Dependence on Government grew by 8.1 percent. The Index variables that grew the most were:
- Housing: 13 percent
- Health Care and Welfare: 13.1 percent
- Retirement: 3.1 percent.
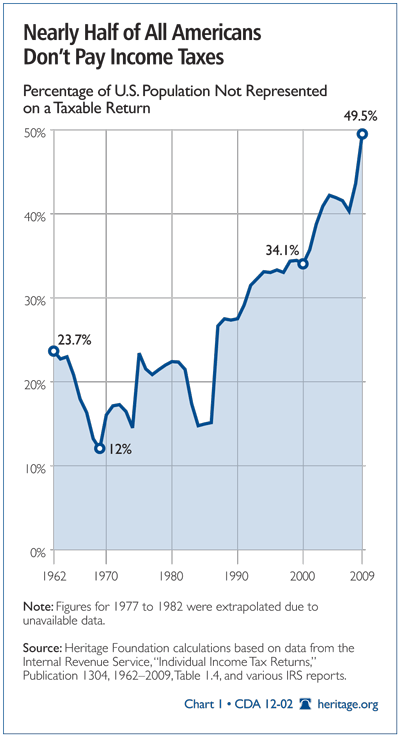
The increase from the previous Index means that the Index has now grown by 60.7 percent just since 2001. One of the most worrying trends in the Index is the coinciding growth in the non-taxpaying public. The percentage of people who do not pay federal income taxes, and who are not claimed as dependents by someone who does pay them, jumped from 14.8 percent in 1984 to 49.5 percent in 2009. This means that in 1984, 34.8 million tax filers paid no taxes; in 2009, 151.7 million paid nothing.[2]
It is the conjunction of these two trends—higher spending on dependence-creating programs, and an ever-shrinking number of taxpayers who pay for these programs—that concerns those interested in the fate of the American form of government. Americans have always expressed concern about becoming dependent on government, even while understanding that life’s challenges cause most people, at one time or another, to depend on aid from someone else. Americans’ concern stems partly from deeply held views that life’s blessings are more readily obtained by independent people and that growing dependence on government erodes the spirit of personal and mutual responsibility created through family and civil society institutions. These views help explain the broad public support for welfare reform in the 1990s.
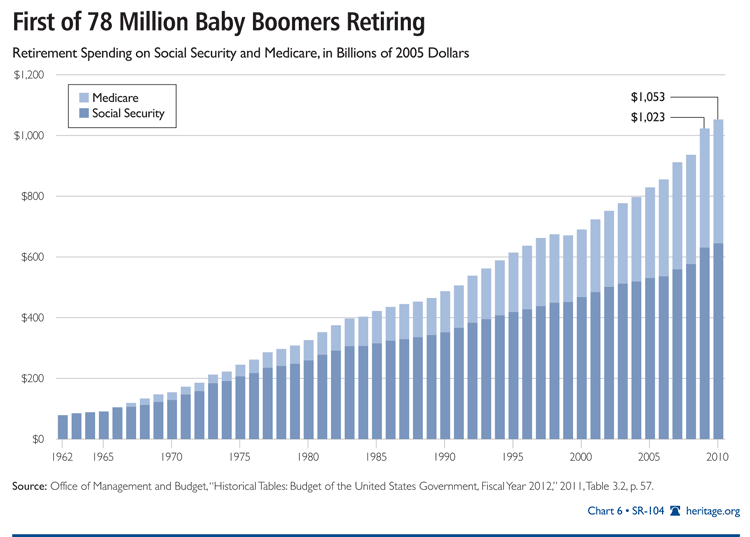
This ethic of self-reliance combined with a commitment to the brotherly care of those in need appears threatened in a much greater way today than when this Index first appeared in 2002. This year, 2012, marks another year that the Index contains significant retirements by baby boomers. Over the next 25 years, more than 77 million boomers will begin collecting Social Security checks, drawing Medicare benefits, and relying on long-term care under Medicaid. No event will financially challenge these important programs over the next two decades more than this shift into retirement of the largest generation in American history.
It is not only financial tests that these programs will face. Certainly, financial challenges will be great over the next several decades, given that none of these “entitlement” programs can easily meet its obligations even now. Doubling the number of people in retirement will constitute a massive growth of the population largely dependent on government programs in the United States, and a potentially ruinous drain on federal finances. Perhaps the most important aspect of the boomer retirement is its dramatic reminder of the rapidly growing dependence on government in the United States.
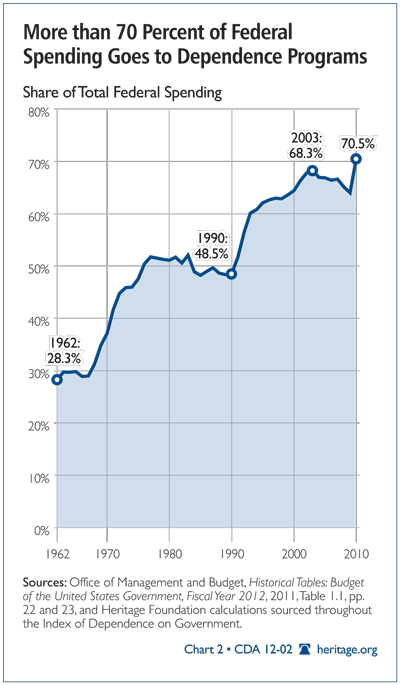
There was such a rapid growth in dependence in 2010 that the twin concerns—how much damage this growth has done to the republican form of government, and how harmful it has been to the country’s financial situation—has deepened significantly. Not only did the federal government effectively take over half of the U.S. economy and expand public-sector debt by more than all previous governments combined, it also oversaw a second year of enormous expansion in total government debt at the federal level. Much of that growth in new debt can be traced to programs that encourage dependence. Chart 2 illustrates how 70.5 percent of federal spending now goes to dependence-creating programs, up dramatically from 28.3 percent in 1962, and 48.5 percent in 1990.
Many Americans are expressing increasing frustration at this fiscally grim state of affairs. Most Members of recent Congresses have known that the major entitlement programs not only need major repairs, but also that these programs are starting to drive up annual deficits and promise to produce substantial deficits in the near future. Many Americans are especially frustrated by the way Congress ignores or, at best, claims to support, comprehensive budget reform plans. Plans like The Heritage Foundation’s Saving the American Dream[3] and Representative Paul Ryan’s (R–WI) “Roadmap,”[4] which offer well-developed and reasonable blueprints for getting federal finances under control, have not been seriously debated by most Members of Congress.
This absence of genuine efforts by Congress to manage the federal government’s worsening financial crisis is now worrying a number of international financial organizations, including the International Monetary Fund (IMF). On May 14, 2010, the IMF ranked the U.S. second place among countries that must reduce their structural deficit (caused in part by spending on dependence-creating programs) or risk financial calamity. The IMF predicts that U.S. public-sector debt will equal 100 percent of its gross domestic product (GDP) by 2015 unless immediate actions are taken to cut the deficits by an amount equal to 12 percent of GDP by 2014. Even woeful Greece need only cut its deficits by 9 percent of its national output.
Then, on August 5, 2011, the credit rating company Standard & Poor’s downgraded U.S. sovereign debt from its AAA rating to AA+.[5] This dramatic and highly controversial assessment of the federal government’s financial health was on the horizon three days earlier when Moody’s Investors Service announced its view that the prospects for the fiscal health of the central government had turned “negative.”[6] Not to be outdone, on November 28, the third big ratings agency, Fitch, also revised its outlook on U.S. credit from “stable” to “negative” (meaning there is a “slightly greater than 50% chance” that Fitch will downgrade U.S. credit from “AAA” over the next two years).[7]
The IMF, the rating agencies, and many watchful citizens are right to be concerned about the growing debt and growing dependence. Programs that encourage dependence quickly morph into political assets that policymakers readily embrace. Many voters support politicians or political parties that mandate higher incomes or subsidies for the essentials of life. No matter how well meaning policymakers are when they create such aid programs, these same programs quickly spiral beyond their mission and become severe liabilities.
Many countries have already passed the fiscal tipping point at which reckless growth in dependence programs has produced domestic debt crises. How far along the path to crisis is the United States? Are Americans closing in on a tipping point that endangers the workings of their democracy? Or have Americans already passed that point? Can this republican form of government withstand the political weight of a massively growing population of Americans who receive government benefits and who contribute little or nothing for them? How seriously have these federal programs eroded civil society by nullifying what were once social obligations, and by crowding out services that used to be provided by families, congregations, community groups, and local governments?
To explore these questions, one must measure how much federal social programs have grown. The Index of Dependence on Government is an attempt to measure these patterns and provide data to help ascertain the implications of these trends. Table 1 contains the 2012 Index scores—from 1962 to 2010, with 1980 as the base year. As the table indicates, dependence on government has grown steadily at an alarming rate.
The Fiscal Calamities Created by Growing Dependence
Entitlements. The issue of dependence is particularly salient today when more and more Americans are increasing their reliance on government as they pass into retirement. Current retirees became eligible for Social Security income, as well as for health care benefits from Medicare or Medicaid, at age 65.[8] These programs currently make up 42 percent of all non-interest federal program spending. Over the next two decades, that spending will increase to nearly 62 percent of non-interest spending as 10,000 baby boomers per day retire and begin to collect benefits. Jointly, these programs will enable the government dependence of nearly 80 million baby boomers.
This phenomenon is particularly troubling because most of the soon-to-be users of these programs are middle-class to upper-class Americans who do not need government support. Since eligibility for these programs is linked to age, not financial need, millionaires collect the same benefits, such as subsidized prescription drugs through Medicare Part D, as do low-income retirees.
Paying for these middle-class and upper-class entitlements in the coming years will require unprecedented levels of deficit spending. Focusing on Social Security and Medicare alone, Americans face $45.9 trillion in unfunded obligations (read: new borrowing) over the next 75 years. That is more than $200,000 per American citizen—an unsustainable level of debt that is sure to slow the economy and could force even higher rates of taxation in the future. The high costs of these programs, which will be shouldered by the children and grandchildren of baby boomers, could easily lead to further increases in dependence of future generations—which would be more likely to depend on welfare during a slow economy. This snowballing of dependence—caused by automatic reliance on Social Security, Medicare, and Medicaid—could easily send the country past the tipping point of dependence, eroding civil society and endangering the functioning of democracy itself.
Additionally, the growing cost illustrates the budgetary problem of allowing dependence to expand unchecked. One reason this growth will be so significant is that these programs increase on autopilot, which further perpetuates dependence, since these programs are not subject to regular debate and evaluation. Unlike nearly all other federal outlays, Social Security, Medicare, and Medicaid are mandatory spending programs that operate outside the annual budget process. This exemption entitles these programs to call on all federal revenues first, regardless of other budgetary priorities. Substantive policy reform is required if this automatic dependence is to be halted. The solution is to turn these programs into 30-year budgeted programs, subjecting the budgets to debate every five years.
Other policy reforms—that emphasize independence and self-reliance—must also be part of addressing the problems inherent in these and other programs. The concept of a safety net ought to be restored to gear Social Security, Medicare, and Medicaid toward those who truly need these programs. This restoration can be accomplished by relating benefits to retirees’ income and encouraging personal savings during working years.
Even though many Members of Congress and other legislators show great hesitance in reforming these badly broken programs, good reforms—that preserve the basic commitments this country has made to its retired and indigent populations—do exist. The Heritage Foundation’s Saving the American Dream plan strengthens the anti-poverty elements of these mandatory programs while also protecting them from financial ruin. Doing nothing, however, guarantees that seniors one day will find themselves largely without the benefits that currently play such an important part of their retirement plans.
Growth in the Non-Taxpaying Population. The challenges that Congress faces in reforming these entitlement programs are heightened by the rapid growth of other dependence-creating programs, such as subsidies for food and housing and college financial aid, and by the growing number of Americans who incur no obligations for receiving them. How likely is Congress to reform entitlements in any meaningful way under such circumstances? Can Congress rein in the massive middle-class entitlements in an environment of fast-expanding dependence programs?
In 1962, the first year measured in the Index of Dependence on Government, the percentage of people who did not pay federal income taxes themselves and who were not claimed as dependents by someone who did pay federal income taxes stood at 23.7 percent; it fell to 12 percent by 1969 before beginning a ragged and ultimately steady increase. By 2000, the percentage was 34.1 percent; by 2009, it was 49.5 percent.[9] In short, the country is now at a point where roughly one-half of “taxpayers” do not pay federal income taxes, and where most of that same population receives generous federal benefits. (See Chart 1.)
This trend should concern everyone who supports America’s republican form of government. If the citizens’ representatives are elected by an increasing percentage of voters who pay no income tax, how long will it be before these representatives respond more to demands for yet more entitlements and subsidies from non-payers than to the pleas of taxpayers to exercise greater spending prudence?
Section 1: The Purpose and Theory of the Index
The 2012 Index of Dependence on Government is divided into four major sections. Section 1 explains the purpose of and theory behind the Index; Section 2 reviews major policy changes in five federal-program areas; Section 3 features a methodology that describes how the Index is constructed; and Section 4 discusses the Index in terms of the number of Americans who depend on government programs.
The Index of Dependence on Government is designed to measure the pace at which federal government services and programs have grown in areas once considered to be the responsibility of individuals, families, communities, neighborhood groups, churches, and other civil society institutions. By compiling and condensing these data into a simple annual score (composed of the scores for the five components in Section 2), the Index provides a useful tool for analyzing dependence on government. Policy analysts and political scientists can also use the Index and the patterns it reveals to develop forecasts of trends and consider how these trends might affect the politics of the federal budget.
The Index uses data drawn from a carefully selected set of federally funded programs. The programs were chosen for their propensity to duplicate or replace assistance, such as shelter, food, monetary aid, health care, education, or employment training, which was traditionally provided to needy people by local organizations and families.
In calculating the Index, the expenditures for these programs are weighted to reflect the relative importance of each service (e.g., shelter, health care, or food). The degree of a person’s dependence will vary with respect to the need. For example, a homeless person’s first need is generally shelter, followed by nourishment, health care, and income. Analysts in The Heritage Foundation’s Center for Data Analysis weighted the program expenditures based on this hierarchy of needs, which produces a weighted Index of expenditures centered on the year 1980.
Historically, individuals and local entities have privately provided more assistance to needy members of society than they do today. Particularly during the 20th century, government gradually offered more and more services that were previously provided by self-help and mutual-aid organizations.[10] Lower-cost housing is a good example. Mutual-aid, religious, and educational organizations long have aided low-income Americans with limited housing assistance; after World War II, the federal and state governments began providing the bulk of low-cost housing. Today, the government provides nearly all housing assistance for the poor and low-income.
Health care is another example of this pattern. Before World War II, Americans of modest income typically obtained health care and health insurance through a range of community institutions, some operated by churches and social clubs. That entire health care infrastructure has since been replaced by publicly provided health insurance, largely through Medicaid and Medicare. Regardless of whether the medical and financial results are better today, the relationship between the people who receive health care assistance and those who pay for it has changed fundamentally. Few would dispute that this change has affected the total cost of health care, and the relationships among patients, doctors, and hospitals, negatively.
Financial help for those in need has also changed profoundly. Local, community-based charitable organizations once provided the majority of aid, resulting in a personal relationship between those who received assistance and those who provided it. Today, Social Security and other government programs provide much or all of the income to low-income and indigent households. Nearly all the financial support that was once provided to temporarily unemployed workers by unions, mutual-aid societies, and local charities is now provided by federal income, food, and health programs.
This shift from local, community-based, mutual-aid assistance to anonymous government payments has clearly altered the relationship between the receiver and the provider of the assistance. In the past, a person in need depended on help from people and organizations in his or her local community. The community representatives were generally aware of the person’s needs and tailored the assistance to meet those needs within the community’s budgetary constraints. Today, housing and other needs are addressed by government employees to whom the person in need is a complete stranger, and who have few or no ties to the community in which the needy person lives.
Both cases of aid involve a dependent relationship. However, support provided by families, churches, and other civil society groups aims to restore a person to full flourishing and personal responsibility, and, ultimately, to be able to aid another person in turn. This kind of reciprocal expectation does not characterize the dependent relationship with the political system. The former relationship is essential to the existence of civil society itself. The latter is usually based on one-sided aid without accountability for a person’s regained responsibility for self and toward his community. Indeed, the “success” of such government programs is frequently measured by the program’s growth rather than by whether it helps recipients to escape dependence. While the dependent relationship with civil society leads to a balance between the interests of the needy person and the community, the dependent relationship with the government runs the risk of generating political pressure from interest groups—such as health care organizations, nonprofit organizations, and the aid recipients themselves—to expand and cement federal support.
The Index of Dependence on Government provides a way to assess the magnitude and implications of the change in government dependence in American society. The Index is based principally on historical data from the President’s fiscal year (FY) 2012 annual budget proposal.[11] The last year measured in the 2012 Index is FY 2010. The Center for Data Analysis (CDA) used a simple weighting scheme and inflation adjustment to restate these publicly available data. CDA analysts encourage replication of their work and will gladly provide the data that support this year’s Index upon request. The steps to prepare this year’s Index are described in the methodology in Section 3.
Section 2: The Five Index Components
CDA analysts began by reviewing the federal budget to identify federal programs and state activities supported by federal appropriations that fit the definition of dependence—providing assistance in areas once considered to be the responsibility of individuals, family, neighborhood groups, churches, and other civil society institutions. The immediate beneficiary of the program or activity must be an individual. This method generally excludes state programs; federally funded programs in which the states act as intermediaries are included.
Elementary and secondary education are the principal state-based programs that are excluded under this stipulation. Post-secondary education is the only part of government-funded education included in the Index.[12] Military and federal employees are also excluded because national defense is the primary constitutionally mandated function of the federal government and thus does not promote dependence as measured by the Index.
CDA analysts then divided the qualifying programs into five broad components:
- Housing
- (a) Health Care and (b) Welfare
- Retirement
- Higher Education
- Rural and Agricultural Services
The following sections discuss the pace and content of policy changes in these five components.
1) Housing.[13] The Department of Housing and Urban Development (HUD) was created in 1965 by consolidating several independent federal housing agencies into one presidential Cabinet department. The purpose of the consolidation was to elevate the importance of government housing assistance within the constellation of federal spending programs. At that time it was believed that the destructive riots that broke out in many cities in the early 1960s were a consequence of poor housing conditions and that these conditions were contributing to urban decay.
HUD spending still largely reflects that dual mission. In any given year, about 80 percent of HUD’s budget is targeted at housing assistance, and the other 20 percent is focused on urban issues by way of the Community Development Block Grant (CDBG) program. Given the nature of these programmatic allocations, HUD budgetary and staff resources are concentrated on low-income households to an extent unmatched by any other federal department.
Within the 80 percent of the HUD budget spent on housing assistance are a series of means-tested housing programs, some of which date back to the Great Depression. Typically, these programs provide low-income people, including the elderly and disabled, with apartments at monthly rents scaled to their incomes. The lower the income, the lower the rent. Traditionally, HUD and the local housing agencies provide eligible low-income households with “project-based” assistance, an apartment unit that is owned and maintained by the government.
Public housing projects have historically been the most common form of such assistance, but they began to fall out of favor in the 1960s because of the rampant decay and deterioration that followed from concentrating too many troubled, low-income families in a single complex or neighborhood. Periodically, new forms of project-based programs are adopted as “reform,” which also tend to fall out of favor after several years of disappointing results. HOPE VI is the most recent form of project-based assistance, and high costs and low benefits led the George W. Bush Administration to attempt, unsuccessfully, to terminate the program in 2006. Efforts are now underway by some in the Obama Administration to increase the program’s funding.
HUD also provides “tenant-based” housing assistance to low-income households in the form of rent vouchers and certificates. These certificates help low-income people rent apartments in the private sector by covering a portion of the rent. The lower the person’s or family’s income, the greater the share of rent covered by the voucher or certificate. Vouchers were implemented in the early 1970s as a cost-effective replacement for public housing and other forms of expensive project-based assistance; vouchers still account for only a portion of housing assistance because of housing-industry resistance to terminating the lucrative project-based programs.
Finally, HUD provides block grants to cities and communities through the CDBG program according to a needs-based formula. Grant money can be spent at a community’s discretion among a series of permissible options. Among the allowable spending options is additional housing assistance, which many communities use to provide assistance to a greater number of low-income households. Although HUD programs are means-tested to determine eligibility, they are not entitlements. As a result, many eligible households do not receive any housing assistance due to funding limitations. In many communities, the waiting lists for housing assistance are several years—and in some cases local housing authorities no longer add new families to the list because there is simply no prospect of new applicants receiving an apartment in the foreseeable future.
Recognizing that HUD housing assistance can create dependence among those who receive its benefits, some Members of Congress have attempted to extend the work requirements of the 1996 Personal Responsibility and Work Opportunity Reconciliation Act (PRWOR) to HUD programs. Advocates for the poor have thwarted these efforts. To date, the most that can be required of a HUD program beneficiary is eight hours per month of volunteer service to the community or housing project in which the beneficiary lives.
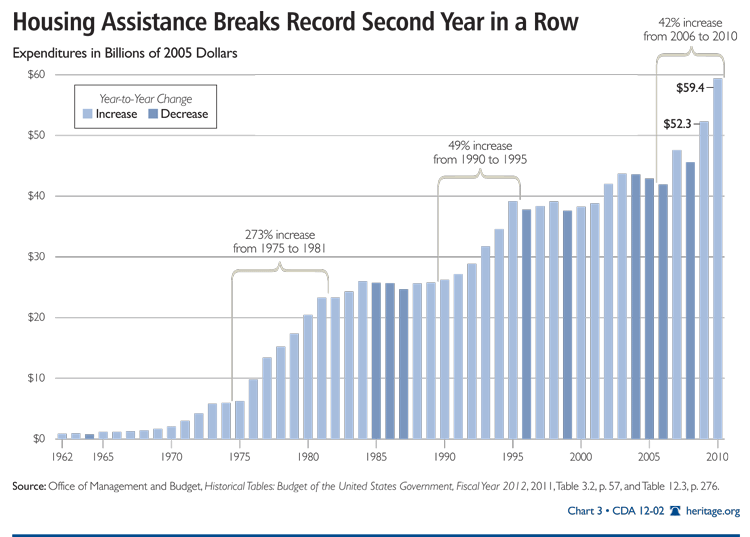
After a mid-decade jump reflecting spending to rebuild infrastructure destroyed by Hurricanes Katrina and Rita, the housing component of the Index moderated, but in 2008 jumped significantly as the federal government added several mortgage-bailout programs to its traditional low-income, housing-assistance focus. Beginning in 2008, the federal government took over the operations of Fannie Mae and Freddie Mac and has since then spent more than $150 billion to keep them afloat and allow them to continue to provide mortgage credit to finance home sales. More than 90 percent of all single-family residential mortgage credit is now provided by these two government-sponsored, government-controlled enterprises, thereby extending dependence on federal assistance to middle-class and upper-middle-class households.
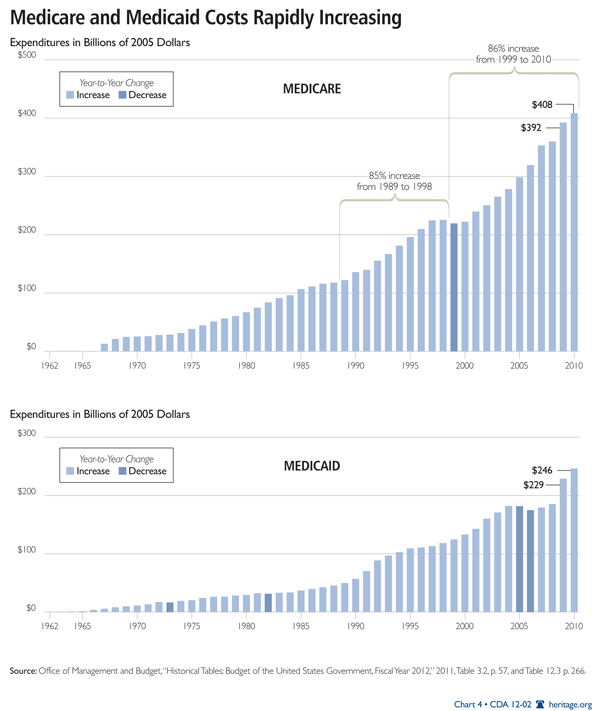
2(a) Health Care.[14] Increasing spending and enrollment in public health care programs, particularly Medicare, Medicaid, and the Children’s Health Insurance Program (CHIP), is leading to greater dependence on government. In 2010, total combined enrollment in these three programs was roughly 98 million individuals—32 percent of the entire U.S. population.[15] The three programs accounted for $793.2 billion, or 5.5 percent of GDP, in federal spending, 238 percent more than the $333.9 billion spent on these programs just a decade earlier.[16] According to the Centers for Medicare and Medicaid Services (CMS), by 2020, government spending on health care will represent 50 percent of total national health expenditures.[17]
In its 2011 annual report on health insurance coverage, the U.S. Census Bureau published figures that underscore the current trend toward greater dependence on government health programs.[18] The percentage of Americans in government health programs is rising faster than ever, in part due to a struggling economy, Medicaid and CHIP expansions, and a rapidly growing elderly population entitled to Medicare benefits. The consequences are greater dependence on taxpayer-subsidized coverage, and a decline in private health insurance.
Medicare. Congress established Medicare in 1965 through Title XVIII of the Social Security Act. Medicare pays for health care for individuals ages 65 and above, and for those with certain disabilities. Medicare enrollment has steadily increased since its enactment due to increases in both population and individual life expectancy. In 1970, 20.4 million individuals were enrolled in Medicare.[19] By 2010, the number of enrollees had more than doubled to 47.5 million.[20] Over the next 10 years, the number of people enrolled in Medicare will increase dramatically. In 2011, the first of 81.5 million baby boomers became eligible for Medicare.[21] In 2010, the size of the Medicare-eligible elderly population was 21.5 percent the size of the non-elderly adult population; the Congressional Budget Office (CBO) predicts that by 2035, this proportion will grow to 36.4 percent.[22]
The heavily taxpayer-subsidized Medicare coverage increases overall demand for health care and places upward pressure on health care pricing. Medicare fee-for-service is the primary source of coverage for beneficiaries, but its gaps in coverage lead 90 percent of enrollees to carry supplemental plans, such as employer-provided retiree coverage, Medigap plans, or Medicaid.[23] Supplemental policies can result in little to no cost-sharing for seniors, shielding them from the financial effects of their health care decisions. Traditional Medicare’s fee-for-service structure adds to rising costs by rewarding providers for higher volumes of services.
Growing enrollment and rising spending are quickly leading Medicare to become an unsustainable program. The Medicare trustees’ 2011 annual report shows that the program faces $24.6 trillion in unfunded obligations under current law; under an alternative, even more plausible, scenario the estimate reaches $36.8 trillion.[24] Medicare Part A is already running yearly deficits, and according to the trustees, the Hospital Insurance Trust Fund will become insolvent in 2024. According to the CBO’s alternative fiscal scenario, Medicare’s costs will have tripled by 2066, increasing from 3.6 percent of GDP in 2010 to 10.8 percent, continuing to rise thereafter.[25]
The last decade has seen a significant expansion of benefits provided by Medicare, including the new prescription drug benefit created under Medicare Part D. From 2004 to 2010, Part D was responsible for $214 billion in federal spending.[26] Though the role of competition in its defined-contribution model has caused estimates of its 10-year cost to drop 41 percent from initial CMS projections, the program has added substantially to health care entitlement spending.[27] Additionally, the publicly funded Part D program has crowded out private coverage alternatives. Research by economists Gary Engelhardt and Jonathan Gruber suggests that before Medicare Part D was enacted, 75 percent of seniors currently receiving public coverage held private drug coverage. Part D also increased average spending on prescription drugs by seniors, an expense that is funded by an increase in public spending of 184 percent, accompanied by a reduction in seniors’ out-of-pocket spending of 39 percent and private insurance plan spending of 37 percent.[28]
Medicaid and CHIP. Medicaid, the joint federal–state health care program for specific categories of the poor, was also established in 1965, through Title XIX of the Social Security Act. In 2010, 53.6 million Americans were enrolled in Medicaid, an increase of almost 3 million individuals in just one year, and 20 million since 2000.[29] Medicaid serves a diverse population of the poor, including children, mothers, the elderly, and the disabled. Combined, the total national cost of Medicaid and CHIP in 2010 is estimated at $413 billion, and is projected to rise to $914 billion by 2020.[30]
The generous, open-ended federal reimbursement that states receive for Medicaid spending has encouraged individual states to grow the program beyond what would be expected if state taxpayers funded the full cost. The structure of the Medicaid program varies from state to state because states determine their own eligibility and benefit levels after meeting a minimum federal standard. States have used this flexibility to expand eligibility further up the income scale and to offer generous benefit packages. Indeed, past research has shown that a majority of Medicaid expenditures are for optional services or groups.[31]
Incremental Medicaid expansions and the addition of the Children’s Health Insurance Program (CHIP)[32] have increased the number of individuals eligible for government health programs. CHIP has led many working families who would otherwise enroll their children in private coverage to opt for public coverage. The CBO concluded that private coverage crowd-out from CHIP expansions ranges from 25 percent to 50 percent.[33] In 2010, 5.8 million children were enrolled in CHIP—an increase of 500,000 children from the year before, and 3.8 million from a decade earlier.[34]
Impact of Obamacare. The Patient Protection and Affordable Care Act (PPACA), enacted in 2010, relies on a massive expansion in Medicaid and the creation of a new income-related subsidy to purchase insurance through government-controlled insurance exchanges. Initially, the Congressional Budget Office estimated that, by 2019, 19 million individuals would receive subsidized coverage in the exchanges.[35] More recent surveys and estimates by independent analysts indicate that this estimate is likely too conservative. Former CBO director Douglas Holtz-Eakin finds that the true number of enrolled individuals in the subsidy program could be triple that of the CBO estimate, which would raise the cost of the program by roughly $1 trillion.
The CMS Actuary has also concluded that new Medicaid enrollment from the PPACA could be much higher than CBO predictions. The CBO estimated that 16 million people would be added to Medicaid and CHIP, and more recent CMS estimates predict an expansion in enrollment of nearly 25 million.[36]
To reduce the impact of these two costly provisions of the PPACA on the federal deficit, the legislation includes $575 billion in cuts to Medicare.[37] These savings should have been used to improve Medicare’s own solvency, not to fund new health entitlement spending. Moreover, both the CMS Actuary and the CBO warn that much of the spending reductions within Medicare are unlikely to materialize due to the effects they will have on health care providers’ profitability, and subsequently, seniors’ access to care.[38]
Conclusion. The growing dependence on government health programs, the result of recent legislation and other factors, will have a direct negative impact on federal and state taxpayers. Spending on Medicare and Medicaid, two of the largest entitlement programs, is on track to well surpass current levels. By 2020, Medicare spending will reach $922 billion, and total spending for Medicaid and CHIP will reach $914 billion, at which point government spending will represent 50 percent of all health care expenditures.[39]
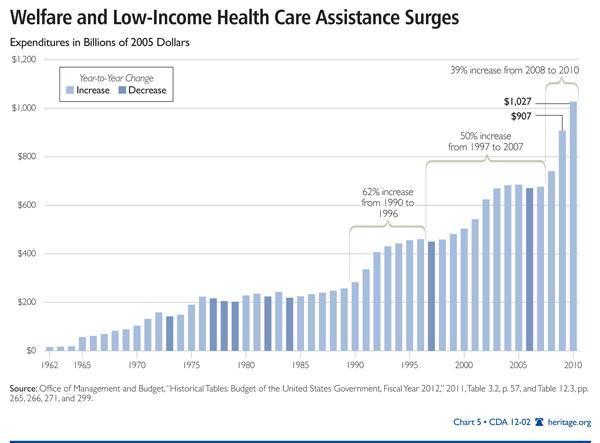
2(b) Welfare. [40] The 1996 “Welfare Reform Act” (PRWORA) replaced the decades-long Aid to Families with Dependent Children (AFDC)—which entitled recipients to unconditional benefits—with the Temporary Assistance for Needy Families (TANF), a block grant program. Enacted during the Great Depression, AFDC, an old cash welfare program, was intended to provide financial assistance to needy children. Over the decades, the program swelled and added adults, such as unemployed parents of enrolled children. Welfare rolls peaked in 1994, reaching more than 5 million cases—14.2 million individual recipients. Before welfare reform, one child in seven received AFDC.
An open-ended assistance program, AFDC granted states more money as their welfare rolls continued to increase. At the individual level, AFDC handed out benefits without any expectations from the recipients, who were entitled to cash aid as long as they fell below the need standards set by the states. The entitlement created perverse incentives—discouraging work among able-bodied adults and discouraging marriage.
Welfare reform effectively altered the fundamental premise of receiving public aid and ended it as an entitlement. Receiving assistance became temporary and tied to demonstrable efforts by the recipients to find work or take part in work-related activities. Self-sufficiency became the goal. The successes of welfare reform are undeniable. Between August 1996 and December 2010, welfare caseloads declined by 57.5 percent, from 4.4 million families to 1.9 million families. The legislation also reduced child poverty by 1.6 million children.[41]
The initial years after welfare reform brought significant progress. By the late 1990s, most states had met the PRWORA’s work goals, and motivation to reduce dependence and encourage work among recipients even more began to wane. The national TANF caseload has flatlined in recent years, and the percentage of TANF families who worked at least 30 hours per week (20 hours for those with young children) never rose above the 38.3 percent attained in 1999, and has hovered near 30 percent in recent years.
In February 2006, after four years of debate, Congress reauthorized TANF under the Deficit Reduction Act. The new legislation reiterated the need to engage recipients in acceptable work activities, moving them to self-sufficiency. Once again, states were required to increase work participation and to reduce their welfare caseloads, using the lower 2005 caseload levels as the new baseline—which essentially restarts the 1996 reform. As required by Congress, the Department of Health and Human Services also issued new regulations to strengthen work-participation standards.
The 2006 TANF reauthorization also contained a notable measure that began to rectify the inattention to the other two 1996 welfare reform goals: reducing unwed childbearing and restoring stable family formation.[42] The erosion of marriage and family is a primary contributing factor to child poverty and welfare dependence, and it figures significantly in a host of social problems. A child born out of wedlock is seven times more likely to be poor than a child raised by married parents, and more than 80 percent of long-term child poverty occurs in broken homes or homes where the parents never married. Moreover, unwed parents and the absence of fathers in the home negatively affect a child’s development, educational achievement, and psychological well-being, as well as increasing propensity toward delinquency and substance abuse.[43]
For the past four decades, the unwed birth rate in America has been rising steadily, from 5.3 percent in 1960, to 41 percent in 2009.[44] Among blacks, 72.8 percent of children born in 2009 were to unmarried parents; among Hispanics, the percentage was 53.2 percent. Although the pace of growth in the proportions of births to unmarried women slowed in the immediate years after welfare reform, more recently, it has risen rapidly. From 2002 to 2009, the share of non-marital births increased by one-fifth.
In 2009, 1.7 million children were born to unmarried parents. Contrary to popular conception, the typical single mother is not a teen, but in her twenties. Whereas in 1970, one-half of all out-of-wedlock births were to teens, in 2009, births to girls younger than 18 years of age comprise only 7 percent of such births. Sixty percent of out-of-wedlock births occur to women in their twenties.[45] Nor is the typical unwed mother a Murphy Brown-type. About 43 percent are high-school dropouts, and 36 percent are high-school graduates. Eighteen percent have had some college education; only 2 percent have a college degree.[46]
In the TANF reauthorization, Congress, for the first time, enacted a healthy-marriage initiative, allocating $100 million in TANF funds per year—less than 1 percent of total TANF expenditures in FY 2006—to local organizations that provide voluntary marriage-centered services and skills training to recipients.
Yet, in February 2009, the Democrat-controlled Congress and the new Obama Administration enacted legislation that essentially overturned the fiscal foundation of welfare reform and reverted to an AFDC-style funding scheme. States now receive cash bonuses when they swell the welfare rolls. Moreover, covering 80 percent of the cost of new welfare caseloads, the federal government is giving states much more money than it did under the old welfare program. The legislation clearly undercuts the incentives wrought by welfare reform to move individuals into work and self-sufficiency.
Comprehensive welfare reform is far from achieved. Today’s welfare system is a convoluted machinery of 70 programs, six federal departments, and a voluminous collection of state agencies and programs. Overall, the welfare system amounts to almost $900 billion in spending per year. A typical welfare recipient family could receive assistance from six or seven programs (e.g., TANF, Medicaid, food stamps, public housing, Head Start, and the Social Services Block Grant) administered by four different departments.[47]
Since President Lyndon Johnson declared the War on Poverty in 1964, the federal government has spent approximately $16 trillion on means-tested welfare aid. Today, means-tested assistance is the fastest-growing part of government, with the nation spending more on welfare than on national defense. In the past two decades, growth in means-tested welfare spending has outpaced that of Social Security, Medicare, education, and defense. Under the Obama Administration, welfare spending has increased dramatically. For example, between FY 2008 (the last fiscal year under the Bush Administration) and FY 2011, the average per capita benefit for the Supplemental Nutrition Assistance Program (SNAP), formerly the Food Stamp Program, nearly doubled from $39.3 billion to $75.3 billion (in constant 2011 dollars).[48] Food-stamp outlay for FY 2011 is estimated at $78.5 billion.[49] Over the next 10 years, welfare spending is projected to cost taxpayers $10.3 trillion. The Obama Administration has worked rapidly to expand the welfare state further.[50] Such growth is clearly unsustainable.
The 1996 Welfare Reform Act was the first phase of meaningful welfare reform; the next phase should focus on the following: First, since means-tested welfare spending goes to more than 70 federal programs, Congress should require the President’s annual budget to detail current and future aggregate federal means-tested spending. The budget should also provide estimates of state contributions to federal welfare programs. Second, continuing reform should rein in the explosive growth in spending. Once the current recession ends, that is, when unemployment reaches 6.5 percent, aggregate welfare funding should be capped at pre-recession (FY 2007) levels plus inflation. Third, building on the successful 1996 model, further reform should continue to promote personal responsibility by encouraging work. For example, SNAP, one of the largest means-tested programs, should be restructured to require recipients to work, or prepare to work, in order to be eligible for food stamps.[51]
In March 2011, Representative Jim Jordan (R–OH), chairman of the Republican Study Committee, introduced the Welfare Reform Act of 2011. The legislation seeks to reverse the undoing of TANF reform under the Obama Administration; require able-bodied adult members of food-stamp-recipient families to work or actively seek employment; reward states for reducing food-stamp caseloads below 2006 levels and for reducing poverty and government dependence; require the President to include total means-tested welfare spending in his annual budget; and require Congress to define and establish an aggregate cap for means-tested welfare spending in its budget.[52]
3) Retirement.[53] Since the time of President Franklin D. Roosevelt, the American retirement system has been described as a three-legged stool consisting of Social Security, employment-based pensions, and personal savings. The reality is quite different. Almost half of American workers (about 78 million) are employed by companies that do not offer any type of pension or retirement savings plan. This proportion of employer-based retirement savings coverage has remained roughly stable for many years, and experience has shown that few workers can save enough for retirement without such a payroll-deduction savings plan. For workers without a pension plan, the reality of their retirement is closer to a pogo stick consisting almost entirely of Social Security.
Since 1935, Social Security has provided a significant proportion of most Americans’ retirement incomes. The program pays a monthly check to retired workers, and benefits to surviving spouses and children under the age of 18.[54] Monthly benefits are based on the indexed average of a worker’s monthly income over a 35-year period, with lower-income workers receiving proportionately higher payments and higher-income workers receiving proportionately less. The lowest-income workers receive about 70 percent of their pre-retirement income, average-income workers receive 40 percent to 45 percent, and upper-income workers average about 23 percent.
However, the demographic forces that once made Social Security affordable have reversed, and the program is on an inexorable course toward fiscal crisis. To break even, Social Security needs at least 2.9 workers to pay taxes for each retiree who receives benefits. The current ratio is 3.3 workers per retiree and dropping because the baby boomers produced fewer children than their parents did and are now nearing retirement. The ratio will reach 2.9 workers per retiree around 2015 and drop to two workers per retiree in the 2030s.
Current retiree benefits are paid from the payroll taxes collected from today’s workers. Due to the effects of the recent recession, Social Security has not collected enough taxes to pay for all its promised benefits since 2010. Both the Social Security Administration and the CBO say that these deficits are permanent.
From 1983 to 2009, workers paid more in payroll taxes than the Social Security program needed in order to pay benefits. These additional taxes were supposed to be retained to help finance retirement benefits for baby boomers. But the government did not save or invest the excess taxes for the future. Instead, the government used the money to finance other government programs. In return for the diverted revenue, Social Security’s trust fund received special-issue U.S. Treasury bonds. Now that Social Security has begun to spend the interest that is accumulating on those Treasury bonds and will soon begin to redeem them, the federal government will be required to raise the money through higher taxes or massive borrowing.
Social Security’s uncertain future is a problem for all workers, and especially for roughly half the American workforce that has no other retirement program. Few of these Americans have any significant savings, and they will depend heavily on the government for their retirement incomes.
This dependence is largely the result of government policies. By soaking up money that should have been invested for the future, Social Security’s high tax rate makes it much harder for lower-income and moderate-income workers to accumulate any substantial savings.
Complex government regulations also discourage the expansion of occupational pensions to cover a higher proportion of the workforce. Over the past few decades, the costs of traditional pension plans have skyrocketed, and thousands of them have shut down. Efforts to develop innovative hybrid pension plans stalled when confusing laws and regulations resulted in lawsuits.
While most large employers now offer defined-contribution plans, such as 401(k), these plans are subject to the Employee Retirement Income Security Act (ERISA). ERISA regulations are especially onerous for smaller employers, who usually lack the necessary expertise to comply with the act’s complex legal requirements. As a result, small businesses hesitate to offer retirement savings plans to their workers for fear of either accidentally violating a regulation or facing the cost of hiring an outside expert.
A simpler, less-regulated account suitable to smaller businesses would go a long way toward increasing the number of workers with retirement savings. Simplified automatic enrollment procedures, automatic investment choices, procedures that allow savings to follow the worker from employer to employer, and better annuity choices would also help. The Automatic IRA, which incorporates these features and has been endorsed by publications as diverse as National Review and The New York Times, is one such simple retirement savings plan. It would increase the proportion of Americans able to save for retirement from roughly 50 percent to about 90 percent.
Until such policies move from theory to reality, Americans face increased dependence on a government-managed Social Security system that cannot possibly meet their needs. This dependence is likely to increase if millions of Americans fail to save enough for a comfortable retirement since such a development would put pressure on legislators to provide additional taxpayer-financed income programs.
4) Higher Education.[55] Federal post-secondary-education spending continues to grow at a rapid pace. During the 2010–2011 school year, total federal spending on student aid programs (including tax credits and deductions, grants, and loans) was $169 billion[56]—making total federal aid 142 percent higher than for the 2000–2001 school year (inflation-adjusted). In the 2010–2011 school year, federal grant aid increased to $49 billion, a 16 percent increase over the previous year—well ahead of the inflation rate.[57]
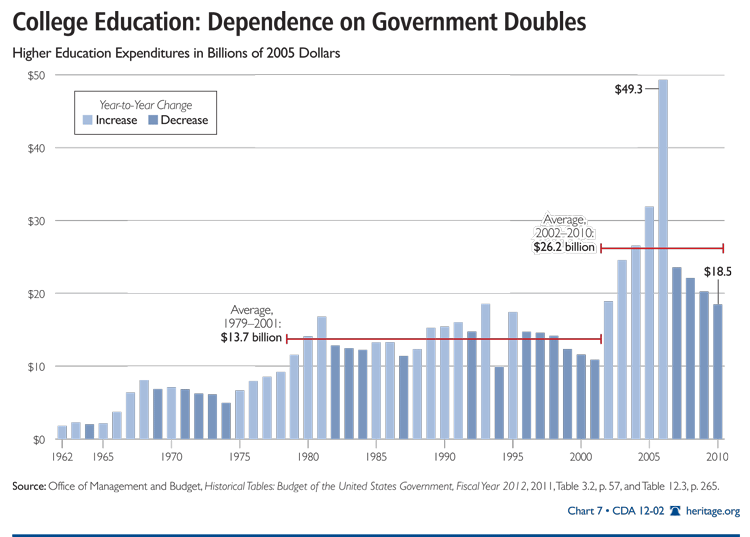
Over the past decade, growing federal higher-education subsidies have increased the number and percentage of post-secondary students who depend on government aid. In the 2010–2011 school year, 9.1 million students received Pell Grant scholarships—more than double the number of students who received Pell Grants in the 2000–2001 school year.[58] Moreover, about 34 percent of all undergraduates take out federal Stafford Loans. In all, federal borrowing increased by 2.5 percent from 2010 to 2011.[59]
Both federal spending and students’ dependence on government are likely to rise in 2012. In seeking to make the United States the country with “the highest proportion of college graduates in the world by 2020,” President Obama has pushed for significant increases in federal subsidies.[60] The President’s 2012 budget request increases funding for federal grants, loans, and work-study programs to $167 billion—a 14 percent increase over the $146.5 billion spent in 2010.[61] Moreover, “the administration’s budget would provide a record $28.6 billion in Pell Grants to nearly 9.6 million students during the 2012–2013 award year.”[62]
Increases in federal student aid subsidies over the years have done nothing to mitigate ever-rising college costs. Tuition and fees at public and private four-year institutions rose by 7.9 percent and 4.5 percent, respectively, after adjusting for inflation, from the 2009–2010 academic year to the 2010–2011 academic year. In the decade from 2002 to 2011, tuition and fees rose by an average annual rate of 5.6 percent at public universities.[63] Since 1982, the cost of college tuition and fees has increased by 439 percent—more than four times the rate of inflation.[64]
Decades-long increases in federal subsidies for college have led to increases in college tuition and fees because universities know that more aid makes students less sensitive to rising college costs. Economist Richard Vedder argues that “some of these [federal] financial aid programs have contributed mightily to the explosion in tuition and fees in modern times.”[65] There is little reason for the federal government to be in the student lending market at all. Vedder also notes that “It is not clear that higher education has major positive spillover effects that justify government subsidies in the first place, and the private loan market that can handle anything from automobile loans to billion-dollar government bond sales can handle financial assistance to students if necessary.”[66]
Instead of continuing to expand the government’s role in student lending, federal subsidies should be limited to those students with the greatest financial need. Limiting the number of years that students are able to receive federal subsidies would also likely begin to tackle the college cost problem.[67]
5) Rural and Agricultural Services. [68] Much of the rapid increase in “rural and agricultural assistance” dependence is rooted in farm subsidy programs. A multitude of farm subsidies (i.e., direct payments, countercyclical payments, market assistance loans, and non-recourse loans) generally work together to compensate farmers for low crop prices. The government makes “conservation payments” to farmers as an incentive to farmers to initiate conservation projects or to simply stop farming their land. Export subsidies effectively lower the price of American products so that they can undercut international competitors.[69]
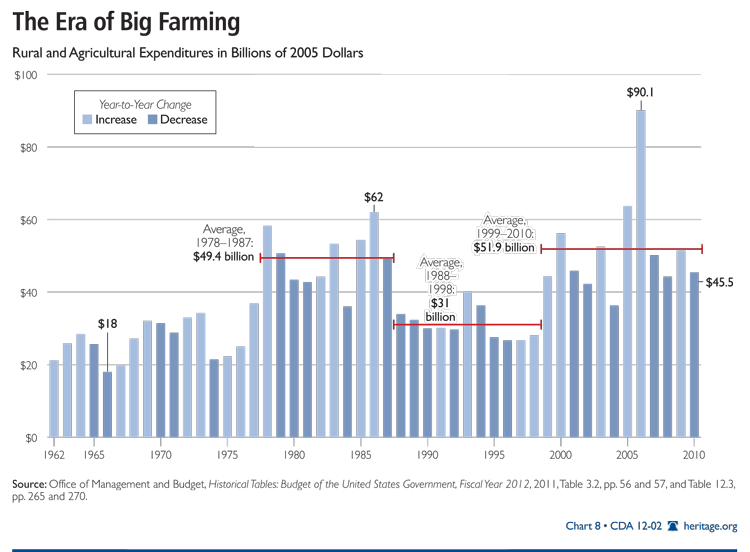
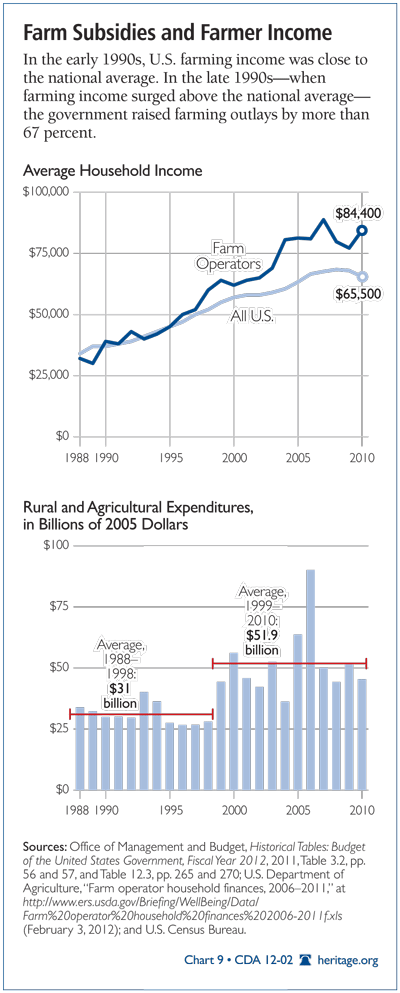
Supporters of farm subsidies often describe farmers as impoverished victims of unpredictable weather and large global economic forces. In reality, American farmers are doing quite well. In 2009, the average farmer had a net worth of $915,019[70] (159 percent of the national average of household wealth); in 2010, an annual income of $84,440[71]; while living in a rural area with a significantly lower cost of living than that of suburban and urban areas. The failure rate for farms is about one-sixth the rate of other businesses.[72]
Yet, farm subsidies have become one of America’s largest corporate welfare programs. The majority of subsidies go to commercial farms, which report average incomes of $200,000 and net worths of nearly $2 million.[73] The bottom 80 percent of farmers receive just one-fifth of the subsidies.
Chart 9 shows that farm household income began to eclipse that of all other U.S. households in the mid-1990s, and is now a seasoned trend. In fact, average farm income leapt by $7,271 in 2010, while that of all U.S. households fell by $500.[74] Still, farm subsidies remain higher than they were in the early 1990s when farm-household income and that of the rest of America were roughly equal.
Instead of being related to need, farm subsidies are based on two factors: which crops are grown, and how much of them are grown. Approximately 90 percent of all farm subsidies go to growers of just five crops: wheat, corn, cotton, soybeans, and rice. Growers of most other crops are ineligible for most subsidy programs, regardless of need.
Farmers who plant more crops receive larger subsidies. This is where the economic logic of farm subsidies falls apart. Subsidies are intended to compensate farmers for low prices that result from an oversupply of crops, but granting larger subsidies to farmers who plant the most crops merely encourages them to plant yet more crops, driving prices even lower and leading to calls for larger subsidies. Furthermore, while paying some farmers to plant more crops, the Conservation Reserve Program pays other farmers to plant fewer crops. One analyst accurately describes U.S. farm policy as “one foot on the brake, one foot on the accelerator.”[75]
In 1996, Congress acknowledged the failures of centrally planned agriculture. That year’s Federal Agricultural Improvement and Reform Act[76] (also known as the Freedom to Farm Act) was designed to phase out farm subsidies by 2002 and allow the agricultural sector to operate as a free market. After spending just $6.2 billion on what is called farm “income stabilization” in 1997—half the amount that was spent in 1992—Congress overreacted to a temporary dip in crop prices in 1998 (resulting from the Asian economic slowdown) by passing the first in a series of annual emergency bailouts for farmers.
By 2000, farm income stabilization spending hit a record $33.4 billion. Farmers quickly grew accustomed to massive government subsidies, and competition for the farm vote induced a bipartisan bidding war on the eve of the 2002 elections. That same year, lawmakers gave up on reform and enacted the largest farm bill in American history, projected to cost at least $180 billion over the following decade. Despite escalating costs and negative economic effects, farm socialism continued to be the overwhelming preference of Congress and the White House.
Farms’ dependence on government will almost certainly continue. Policymakers mistakenly see farm subsidies as the solution to, not a significant cause of, low crop prices. Expensive disaster payments are doled out whether the weather is bad (crops are destroyed) or good (oversupply lowers prices). Finally, farm subsidies have created an entitlement mentality among a class of farmers who will likely punish any politician who pursues reform. Currently, there are no plans to move farmers toward self-sufficiency.
Rather than fix this broken system, the 2008 farm bill made it worse.[77] Congress ignored President George W. Bush’s call to subsidize only those farmers who earn less than $200,000 a year, which would have effectively ended subsidies for corporate farms, and repealed key limits on the subsidies a farmer may receive. The bill created a permanent new disaster program, increased subsidy rates, and used gimmicks to cover up a spending increase of approximately $25 billion over 10 years. Even corn farmers, who already benefit from soaring prices resulting from federal ethanol policies, will continue to receive billions in annual subsidies. These anti-trade policies will also likely lead to retaliation by America’s trading partners, harming American farmers and consumers. Congress overrode President Bush’s veto of the farm bill, guaranteeing at least six more years of destructive farm policies.
Section 3: The Methodology
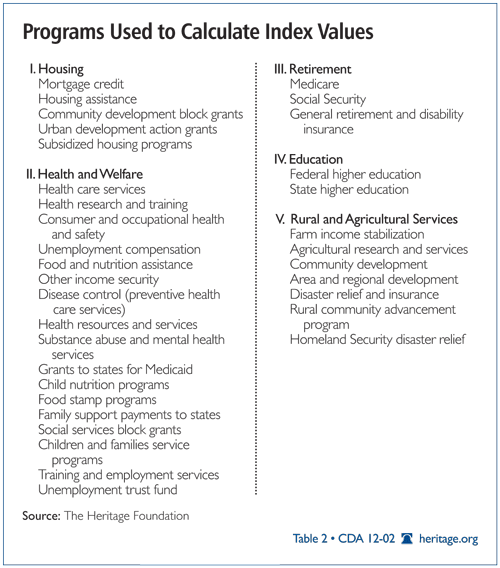
After identifying the government programs that contribute to dependence, the Center for Data Analysis further examined the data to identify the components that contributed to variability. Relatively small programs that required little funding and short-term programs were excluded. The remaining expenditures were summed up on an annual basis for each of the five major categories listed in Table 2.[78] The program titles are those used by the Office of Management and Budget for budget function and sub-function in the budget accounting system.
The CDA analysts collected data for FY 1962 through FY 2010. Deflators centered on 2005 were employed to adjust for inflation.
Indices are intended to provide insight into phenomena that are so detailed or complicated that simplification through arbitrary but reasonable rules is required for obtaining anything other than a rudimentary understanding. The Consumer Price Index (CPI) of the Bureau of Labor Statistics, for instance, is a series based on an arbitrarily selected “basket of goods” that the bureau surveys periodically for price changes. The components of this basket are weighted to reflect their relative importance to overall price change. Energy prices are weighted as more important than clothing prices. Multiplying the weight by the price produces a weighted price for each element of the CPI, and the total of the weighted prices produces the rough CPI score.
The Index of Dependence on Government generally works the same way. The raw (unweighted) value for each program (that program’s yearly expenditures) is multiplied by its weight. The total of the weighted values is the Index score for that year.
The Index is calculated using the following weights:
- Housing: 30 percent
- Health Care and Welfare: 25 percent
- Retirement: 20 percent
- Higher Education: 15 percent
- Rural and Agricultural Services: 10 percent
The weights are “centered” on the year 1980. This means that the total of the weighted values for the Index components will equal 100 for 1980, and 1980 is the reference year in comparison to which all other Index values can be evaluated as percentages of 100.
The CDA chose the year 1980 due to its apparent significance in American political philosophy. Many analysts view 1980 as a watershed year in U.S. history because it seems to mark the beginning of the decline in left-of-center public policy and the emergence of right-of-center challenges to policies based on the belief that social systems fail without the guiding hand of government.[79]
The Index certainly reflects such a watershed. Chart 10 plots the Index from 1962 to 2010. The scores have clearly drifted upward over the entire period.
There are two plateaus in the Index—the 1980s and the period from 1995 to 2001—that suggest that policy changes may significantly influence the Index growth rate. During the early 1980s, the growth of some domestic programs was slowed to pay for increased defense spending, and Congress enacted significant policy changes in welfare and public housing during the 1990s. Both of these cutbacks reduced the Index growth rate.
Chart 11 connects the Index to major public policy changes. The largest jump in the Index occurred during the Johnson Administration following the passage of the Great Society programs. The Johnson Administration not only launched Medicare and other health programs, but also vastly expanded the federal role in providing and financing low-income housing. The Index also jumped 92 percent (from 36 percent to 69 percent) under the Nixon and Ford Administrations, when Republicans were funding and implementing substantial portions of the Great Society programs.
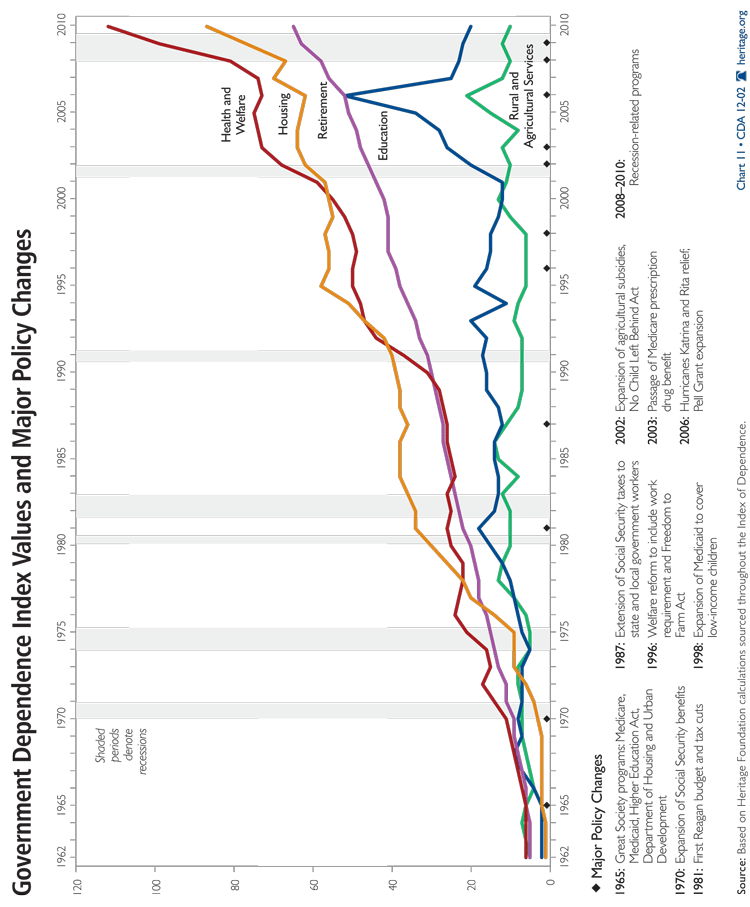
The two periods of relatively more conservative public policy (the 1980s and 1995–2001) stand out clearly in Chart 11. The slowdowns in spending increases during the Reagan years and after the 1994 congressional elections produced two periods of slightly negative change in the Index. These periods saw significant retreats from the Great Society goals, particularly in the nation’s approach to welfare, but the return of budget surpluses during the last years of the Clinton Administration led to significant spending increases for all of the components, particularly education and health care. The George W. Bush years saw more leaps in retirement, housing, health, and welfare spending, and since 2009, health care and welfare spending has blasted upward like a rocket on speed. Health care and welfare now stands at four and a half times the 1980 level (inflation-adjusted). With the implementation of Obamacare in 2012, the parameters of Chart 11 will most likely have to be expanded again to fit the higher Index number in the years to come.
Section 4: The Dependent Population
The Index reflects the growth in federal government programs that provide assistance in areas once considered to be the responsibility of individuals, family, neighborhood groups, churches, and other civil society institutions. Index values reflect both the number of people in these programs and the dollars spent on the programs.
Data on the number of people enrolled in or benefiting from the programs listed in Table 1 between 1962 and 2010 were drawn from a variety of public sources. A significant effort was made to eliminate duplicate enrollments. For example, many people who receive food stamps also receive medical services through Medicaid.
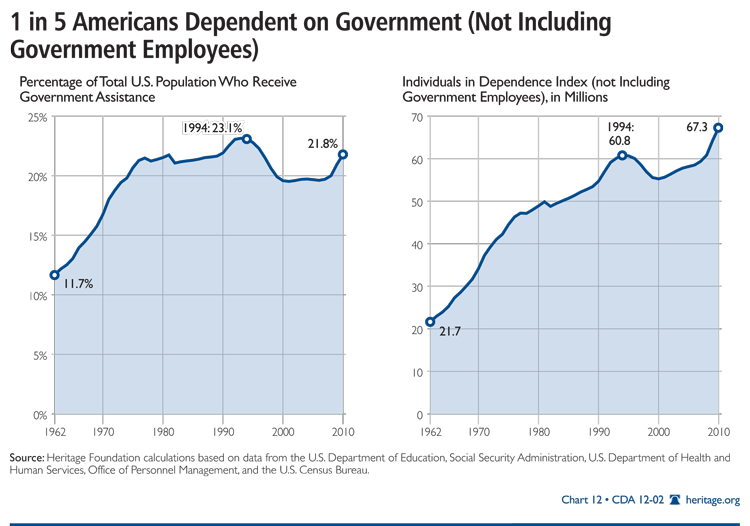
Chart 12 shows the annual number of program enrollees from 1962 through 2010. On the eve of the Great Society programs, some 21.7 million people (11.7 percent of the population) received assistance through the programs that existed at the time (listed in Table 2). Today, 67.3 million people (21.8 percent of the total U.S. population) receive some level of assistance through the programs included in the Index.
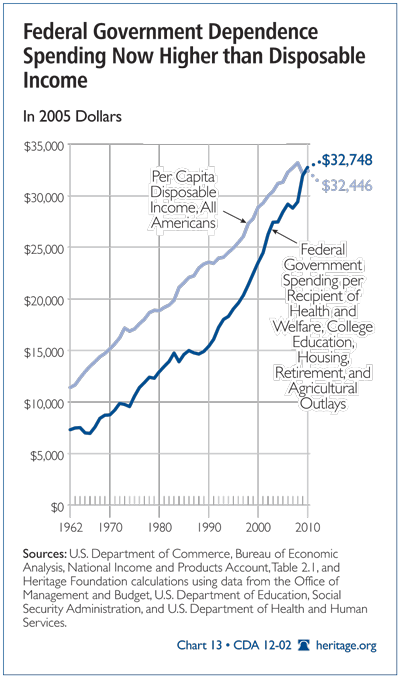
Growth in income and non-financial support among program participants has accompanied the increase of people who receive assistance. Per capita financial and non-financial support (adjusted to 2005 dollars) stood at about $7,314 in 1962. By 2010, this support had grown to about $32,748. (See Chart 13.) Extraordinarily, this amount was $302 higher than the average per capita disposable income of Americans in 2010. Thus, a case can be made that a citizen is better off accepting government aid than working.
Complementary estimates agree with data from the Index showing that federal dependence-creating programs crowd out assistance from local government and civil society institutions, even replacing aid that used to come from family members. Researcher Ralph M. Kramer finds that individual giving as a proportion of personal income fell by 13 percent between 1960 and 1976, while the proportion of philanthropic giving devoted to social welfare dropped by 9 percent. By 1974, government was spending about 10 times as much on social services as did nonprofit agencies, and that year the nonprofit agencies themselves received close to half ($23 billion) of their total revenues from government (receiving $25 billion from all other sources combined).[80] Such data also raise traditional republican concern about the long-term viability of political institutions when a significant portion of the population becomes dependent on government for most or all of its income.[81]
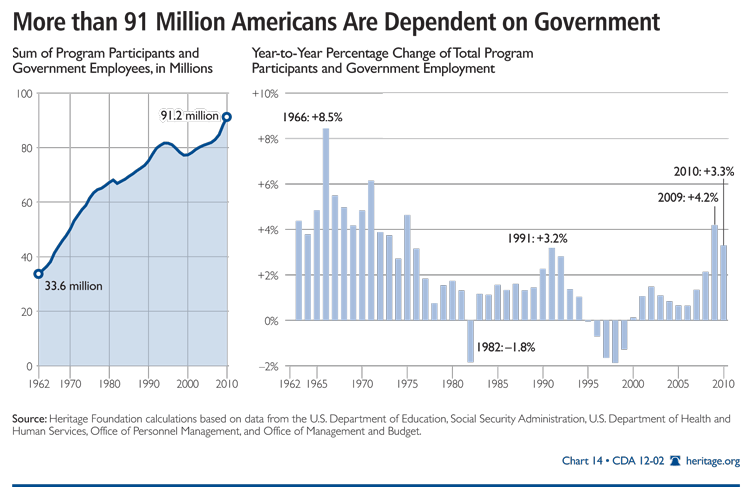
More than one-fifth of Americans (21.8 percent) defined as dependent for the purposes of this Index may or may not be sufficiently high to trigger this concern. Though, this percentage jumps to 29.5 percent when federal and state employees are included. In 1962, the sum of these two categories (Index participants and government employees) stood at 33.6 million, 18 percent of the total population. This total grew to 91.2 million (29.5 percent of the total population) by the end of 2010, an increase of 163 percent. (See Chart 14.)
The annual growth rate in federal and state government employment has generally subsided since the 1960s and 1970s. (See Chart 15.) However, the growth rate of state government employment has been positive for all but four years of the past 49. Federal employment grew during the military buildup of the 1980s and during the military downsizing after the collapse of the Soviet Union, which led to negative change rates in federal employment throughout the 1990s. In 2010, with the stagnating economy failing to jumpstart after the longest recession since 1962, and the national unemployment rate stuck at 9.6 percent (up from 5.8 percent in 2008),[82] the number of federal employees grew by 3.5 percent.

Conclusion
Public policy appears to matter in the growth of the Index of Dependence on Government. The rapid increase in the 1960s and 1970s corresponds with a new commitment by the federal government to solve local social and economic problems, which had previously been the responsibility of local governments, civil society organizations, communities, and families. The sum of government employees and the population covered by programs contained in this Index grew dramatically, even after accounting for the military buildup for the Vietnam War during the mid-1960s.
The 1980s and 1990s generally witnessed much slower growth in the Index. Unfortunately, the first decade of the new millennium was a different story; the Index resumed the growth rates attained during the Jimmy Carter years, and has recently been on an upward tear like never before.
Americans should be concerned about this seemingly relentless upward march in Index scores. Dependence on the federal government for life’s many challenges strips civil society of its historical and necessary role in providing aid and renewal through the intimate relationships of family, community, and local institutions and local governments. While the Index does not measure the decay of civil society, it reflects a declining role in this most important aspect of society.
Americans’ concern over the growth of the Index of Dependence on Government should be particularly high for another reason: Americans find themselves on the eve of the largest retirement of people in world history—at the same time that the number of “taxpayers” who pay no taxes is growing steadily. This country’s republican form of government, with its finely balanced mixture of civil and political institutions and charitable roles could probably withstand some—very limited—additional increases in the dependent population as defined in this paper.
Perhaps the greatest danger is that the swelling ranks of Americans who enjoy government services and benefits for which they pay few or no taxes will lead to a spreading sense of entitlement that is simply incompatible with self-government. Are Americans completely indifferent to history’s many examples of republican government collapsing under the weight of just such populations? Are Americans near a tipping point in the nature of their government and the principles that tie it to civil life?
It is virtually impossible not to answer “yes.” Americans have reached a point in the life of their republic when the democratic political process has become a means for many voters to defend and expand the “benefits” they receive from government (read: their dependence). This can only lead to a corruption of government and of self-serving voters. Do Americans want a republic that encourages and validates a growing dependence on the state and a withering of civil society? Do Americans want to further accentuate class lines between those who pay for programs that advance dependence, and those who unquestioningly accept—and expect—the assistance from those programs? Are Americans ready for the new class warfare, the battle lines of which are drawn by these dividing lines? These are questions increasingly in need of urgent answers. How Americans answer them may well determine the ultimate fate of their political system—and society.
—William W. Beach is Director of the Center for Data Analysis at The Heritage Foundation. Patrick D. Tyrrell is Research Coordinator in the Center for Data Analysis. Heritage Foundation policy experts David C. John, Lindsey Burke, Kathryn Nix, Christine C. Kim, and Ronald D. Utt contributed significantly to the 2012 Index.


