[1]
The Violent Crime Control and Law Enforcement Act of 1994 authorized the creation of an intergovernmental grant program within the U.S. Department of Justice to fund the hiring and redeployment of 100,000 additional community policing officers on America’s streets. The program that administers the grants is the Office of Community Oriented Policing Services (COPS).
While the concept of community policing encompasses many things, it can be succinctly described as officers and citizens working together to solve problems resulting from crime, fear of crime, social and physical disorder, and undesirable neighborhood conditions.[2] By encouraging community policing, COPS grants were expected to reduce fear of crime, increase the quality of life, promote social control, and boost citizen satisfaction with police services while improving information sharing between citizens and the police.[3]
COPS administered three general types of grants.
First, the hiring grants paid for 75 percent of the salaries of newly hired officers over three years.
Second, the Making Officer Redeployment Effective (MORE) grants provided funding for technology, officer overtime, and civilian staff salaries. The MORE grants were intended to redeploy veteran officers from administrative tasks to community policing.
Third, the innovative grants provided funding for addressing specific problems like domestic violence, gangs, and youth firearms violence.
Two questions are asked in this paper: Do COPS grants stimulate local police department spending in large cities? Do COPS grants deter crime in large cities?
Two sets of regression analyses are used for this evaluation. To determine the impact of COPS grants on city police expenditures, the first set of modeling estimates a police expenditure function with police expenditures as the dependent variable. The police expenditure function is specified with variables that are thought to predict police spending. The second set of models estimates the relationship between COPS grants and crime rates. In the crime models, the dependent variables are crime rates for murder, rape, robbery, assault, burglary, larceny-theft, and motor vehicle theft.
Background and Literature Review
According to the Justice Department, the COPS program reached an important milestone on May 12, 1999, “funding the 100,000th officer ahead of schedule and under budget.”[4] While measuring the goal of adding 100,000 additional officers is problematic, the best available evidence indicates that COPS fell short of this goal. Research indicates that COPS did not actually put 100,000 additional officers on the street.[5] A National Institute of Justice (NIJ) process evaluation of COPS concluded: “Whether the program will ever increase the number of officers on the street at a single point in time to 100,000 is not clear.”[6]
Most hiring grantees faced officer retention issues with their COPS-funded officer positions. According to an NIJ national survey of COPS grantees, 52 percent of hiring grantees were uncertain about their long-term plans for officer retention, 37 percent would achieve retention with funds cleared through the attrition of non–COPS-funded officers, 20 percent reported that retention would occur by cutting other positions, and 10 percent reported that the officers would not be retained. Of all the medium and large agencies that received hiring grants from 1994 to 1998, only 46 percent reported that all of their original COPS-funded officers were still employed in 1998.[7]
Flypaper Effects. Understanding how federal grants affect state and local governments is important to developing hypotheses to predict how COPS grants influence spending by cities. The conditions that federal grants impose on grantees have some bearing on the allocation of state and local resources.
An interesting policy question revolves around the effect of intergovernmental grants: Do intergovernmental grants provide a stimulus for grant recipients to spend more of their own resources than they would spend without grant assistance? Reviews of the literature estimating the relationship between intergovernmental grants and grantee spending generally indicate a “flypaper effect” because the grant funding sticks where it hits. Depending on grant conditions, intergovernmental grants can be expected not only to “stick,” but also to stimulate the recipient’s spending to exceed the effect of an equal increase in private income by the grant recipient. Certain types of grants stimulate grantees to increase spending from their own revenues to levels that would not have been achieved without the grants. The central assumption of this effect is that federal grants provide a powerful incentive for state and local governments to increase their own spending levels beyond the amounts that would have been spent without federal assistance.[8]
COPS grants are categorical grants, which are used by the recipient to fund specific activities authorized by the grant provider. While most categorical grants are awarded on a formula basis,[9] the majority of COPS grants are categorical project grants, meaning that the grants are awarded only to those that apply for the funding. Project grants are considered more effective than formula grants in targeting aid to the neediest communities.[10] In addition, COPS grants are closed-ended matching grants that place a ceiling on the contribution by the grantor.
The hiring and MORE grants generally require a 25 percent local match, so not only should the police expenditure function indicate a flypaper effect, but the model should also indicate a stimulus effect. The inclusion of COPS grants variables in the police expenditure function tests for how the grants affect local expenditures.
COPS Evaluations. In recent years, new impact evaluations estimating the effect of COPS on crime rates have been produced.[11] However, these evaluations have produced conflicting findings and conclusions.
The Heritage Foundation published the first impact evaluation of COPS, which found that the relationship between COPS hiring and MORE grants and county violent crime rates was statistically insignificant, while innovative grants were associated with small reductions in violent crime.[12] A COPS-funded evaluation found that the innovative grants were associated with reductions in both violent and property crime rates in cities and towns with populations above 1,000 residents. The hiring and MORE grants did not have a statistically significant relationship with crime rates. However, when the analysis was limited to cities above 10,000 residents, the innovative and hiring grants were associated with reductions in violent and property crime rates.[13]
A review of the COPS-funded evaluation by the U.S. General Accounting Office (GAO, later renamed the Government Accountability Office) severely criticized the authors’ methodology and concluded:
We cannot agree…that their 2001 study shows that some COPS grants (hiring and innovative) significantly reduced crime because, among other things, important variables were omitted from their analyses, the analytic models were misspecified, and the sample of cities included in the study was limited.[14]
Two other studies of cities with populations over 10,000 residents indicate that COPS grants are associated with reductions in crime. A GAO study concluded that COPS grants were linked to “modest” reductions in crime rates.[15] In a presentation before the 6th Annual Campbell Collaboration Colloquium, GAO officials estimated that COPS accounted for 1 percent of the drop in crime during the 1990s.[16] A study from the University of Maryland found that COPS hiring grants boosted police employment levels and that increased police employment is associated with decreases in crime.[17]
Data and Modeling
Assessing a program’s impact normally requires comparing the conditions of targets that have received an intervention with an equivalent set of targets that have not experienced the intervention.[18] The manner in which targets are selected for inclusion in intervention and control groups can complicate the assessment of a program’s real impact. For instance, when participation in a program is voluntary, the participants may be more likely to produce the desired effect regardless of whether or not they received the intervention. In the case of COPS, police departments that applied for grants may already have been more open to adopting innovative policing styles than agencies that did not apply for grants. Thus, the evaluation methodology of this paper needs to address this dilemma.
Ideally, the most appropriate impact evaluation of COPS would be an ex ante experimental design, in which grant funding is randomly assigned to intervention and control cities. The Violent Crime Control and Law Enforcement Act of 1994, as written by Congress, required an evaluation of COPS. Congress suggested that the evaluation measure the effectiveness of COPS in reducing crime but left open the possibility that the Department of Justice might do an alternative type of evaluation. The resulting NIJ study failed to measure the effectiveness of the COPS program in reducing crime. Instead, the study examined process measures, such as how many officers were hired and the types of community policing activities that were implemented.[19]
With the opportunity for an ex ante experimental evaluation closed, researchers are now left with ex post non-experimental designs for evaluating the impact of COPS on crime. Given the paper’s focus on large cities, and given that nearly all of the cities in the dataset received some form of COPS grants, a quasi-experimental design is impossible. Of the 58 cities, only Oklahoma City chose not to participate in COPS grants from December 1993 to December 1999. In addition, a few of the cities did not participate in some of the three COPS grants. The techniques available for separating out the effect of extraneous factors from the net effect of COPS grants are severely limited. Thus, this analysis uses repeated reflexive controls, in which cities that received COPS grants and the single city that did not receive funding are compared with themselves using the several measures of crime rates before and after the COPS program was implemented.
To institute reflexive controls, this paper will use panel data analysis. Panel studies observe multiple units over several periods. The addition of multiple data collection points gives the results of panel studies substantially more credibility than studies that have only single before and after intervention measures.[20] For large cities, COPS can be considered a full-coverage program. The absence of comparison cities makes the task of accounting for all confounding effects difficult. However, the participation levels of large cities differed. Using panel analysis allows this evaluation to test the relative effectiveness of different COPS funding levels.
By increasing the number of data points compared to cross-sectional and time-series analyses, panel analysis increases the degrees of freedom and reduces possible collinearity among the independent variables, thus improving the efficiency of the econometric estimates. Further, the longitudinal nature of the panel data allows evaluators to analyze important policy questions that cross-sectional and time-series data sets cannot address.[21] Panel analysis also reduces omitted variable bias by introducing cross-sectional and time-specific fixed effects into the model specification.[22]
Data. The 58 large cities in this evaluation are based on the 59 cities used in a study by Professor Steven D. Levitt of the University of Chicago.[23] The Illinois data regarding rape are not in accordance with FBI guidelines, so the FBI does not report the number of rapes in Illinois. This difference in definition means that Chicago, which is included in Professor Levitt’s study, is excluded from these analyses because the model specifications include one-year lags of all crime rates as control variables.
Since COPS was created in late 1994, the years included in this evaluation were selected to analyze five years before and after the initial implementation of the program.[24] Table 1 lists the cities in this evaluation and the amount of COPS grant funding that each city received. During this period, these cities received almost $1.5 billion, including over $900 million to hire over 12,000 new officers.

The data used for this paper were collected from several sources. Table 2 lists each variable and its respective mean, standard deviation, minimum, and maximum. The per capita dependent variables for each of the crime models are murder, rape, robbery, aggravated assault, burglary, larceny-theft, and auto theft. The average crime rates of these cities have declined over the 10-year period of this study. Generally, crime rates began to decline during the early to mid-1990s. Because crime rates in these cities began generally to decline before COPS was created, any evaluation that excludes the declining crime trend before COPS may produce biased estimates.
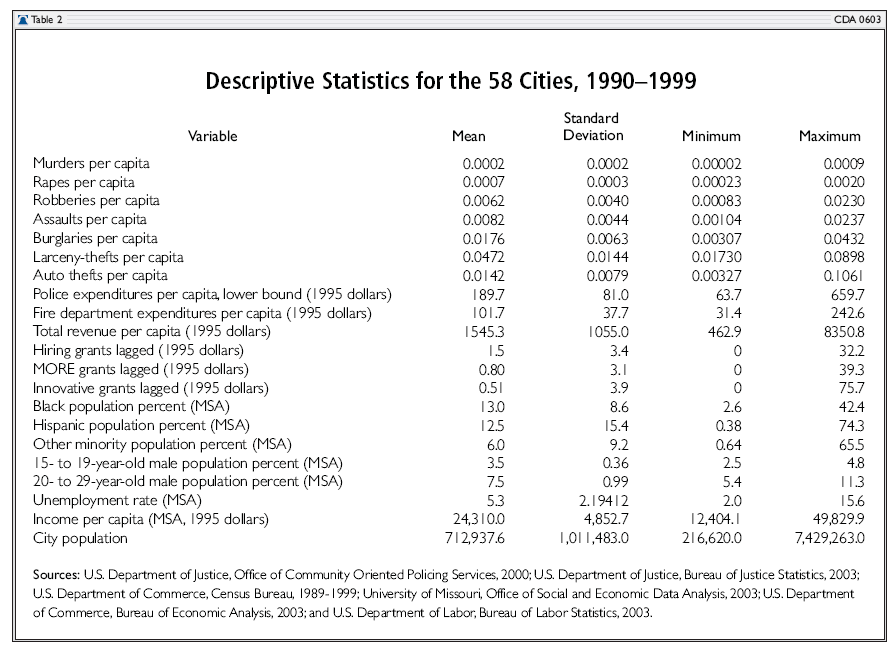
To obtain crime rates per capita, these variables were divided by each city’s total population as reported to the Uniform Crime Reports (UCR). The city-level crime rate data are based on UCR data, which were obtained from the U.S. Department of Justice Bureau of Justice Statistics.[25] The UCR data include only offenses reported to the police, so the actual level of crime is understated.
To measure the effect of city-level policies, the analysis includes city police and fire department expenditures and total city revenue data from the Annual Survey of State and Local Government Finances.[26] The police and fire department variables are limited to non-capital expenditures. As with the crime variables, the expenditure and revenue data were divided by each city’s population to obtain the per capita values and were expressed in 1995 dollars.
The Annual Survey of State and Local Government Finances appears to be the only survey that has continually collected city police expenditure data from 1990 through 1999. While the survey generally tracks local government revenues from intergovernmental grants, the Census Bureau does not collect revenue data specifically related to federal law enforcement grants. Further, the survey does not detail expenditures for specific functions (e.g., police protection and public welfare) by source. There is a possibility that the police expenditures reported by the local governments in the survey include spending resulting from COPS grants and other intergovernmental sources of funding. The degree to which this problem is present in the data used in this evaluation is not clear. Because the Annual Survey of State and Local Government Finances is the only source of local police expenditure data, the data are used to estimate the effect of city police expenditures on crime rates.
To account for this issue, separate analyses were performed in which COPS grants were subtracted from the police expenditure data. Under this method, the estimated effect of COPS grants on crime did not substantially change the findings presented in this paper.
The focus of this paper—COPS grants—is calculated on a per capita basis. COPS grants are divided into three types based on their functional purposes: hiring grants, MORE grants, and innovative grants. The grants are calculated on a per capita basis and are in 1995 dollars.
As with the previous COPS evaluations,[27] the COPS variables are lagged at least one year. The lagging is done to allow for the time that grantees took to implement the grants. For the hiring grants, the NIJ process evaluation found that 95 percent of grantees in 1995 had hired their officers within 10– 12 months after their respective award dates.[28] To account for the three-year life of the hiring grants, funding must be allocated over the three-year time span. COPS recommends to grantees that hiring grants be spent at a declining rate—38 percent of the grant for the first year, 34 percent for the second year, and 28 percent for the third year.[29] For this paper, the hiring grants are allocated in the same manner.
MORE grants provided funding for the purchase of technology intended to free officers from administrative tasks and allow them to spend more time in community policing. In some cases, these grants paid for the salaries of clerical help. In other cases, MORE grants paid overtime expenses to increase the deployment of police officers on patrol. The MORE grants did not have a universal cap, but contribution levels are based on the total cost estimates of the proposed grant projects. Based on the estimated total budget for MORE grant projects, COPS provided 75 percent of the total cost with the expectation that the grantees would pick up the remaining 25 percent.
While comprising about 10 percent of COPS funding, innovative grants addressed specific problems identified by grantees. These grants were commonly used to target street gangs, domestic violence, and illegal use of firearms by youths. The innovative grants are nonmatching (i.e., lump-sum grants that do not require matching local revenues). All COPS grants are closed-ended grants, meaning that federal contributions are capped at specific dollar amounts. The COPS grant data contain award information from December 1993 to May 2000.[30]
The demographic variables are on the metropolitan statistical area (MSA) level. The MSA variables pertaining to race and ethnicity include the black, Hispanic, and other minority population percentages. The young male population percentages are broken down into the 15–19-year-old and 20–29-year-old categories. MSA demographic data were obtained from the Office of Social and Economic Data Analysis at the University of Missouri.[31]
The economic variables include the unemployment rate and income per capita (1995 dollars) for the metropolitan statistical areas. Income per capita and unemployment data from 1990 to 1999 were obtained from the Bureau of Economic Analysis and the Bureau of Labor Statistics, respectively.[32]
Modeling. An endogenous relationship between police force size and crime rates may produce biased ordinary least squares (OLS) estimates.[33]
First, higher crime rates are likely to heighten the marginal productivity of police departments. Cities with high crime rates tend to have larger police departments, even if increased police resources reduce crime.
Second, if the size of a police department is expanded in response to increasing crime, a positive correlation between police and crime can be found, even though the police reduce crime.[34]
Hence, analyses of the effect of police departments on crime should use methods that are designed to disentangle the simultaneous relationship between the police and crime.
The evaluation presented here is based on two statistical approaches. The first approach uses OLS regressions to estimate the impact of police expenditures and COPS grants on crime rates. The second approach uses two-stage least squares (2SLS) regressions to account for a possible simultaneous relationship between local law enforcement expenditures and crime while controlling for COPS grants and socioeconomic variables. The efficiency of the 2SLS estimates is compared to the OLS estimates.
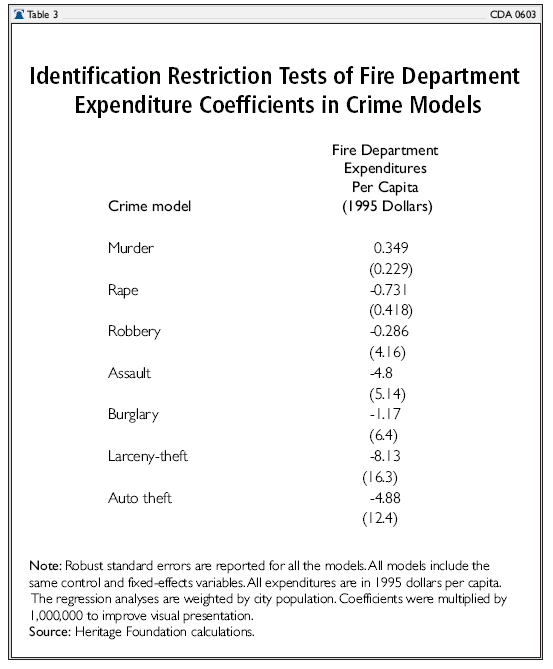
Using 2SLS to estimate a simultaneous or endogenous relationship requires an important assumption called an “identification restriction.” Identification restrictions involve variables that do not directly influence crime rates but do affect the other simultaneously related variables. For instance, to determine the effect of police expenditures or employment levels on crime, one would need a variable in the police expenditure function that affects spending or employment levels but does not influence crime rates. Factors that affect police expenditures or police employment without influencing crime rates or being affected by crime rates are eligible for use as identification restrictions. If the identification restriction is seriously in error, the estimated effects of the simultaneous model may contain large errors due to simultaneity.[35]
City fire department expenditures serves as the instrumental variable for the 2SLS models because the demand for public safety is anticipated to affect both police and fire department spending. Although fire department expenditures are expected to be correlated with police department expenditures, there is little reason to believe that fire department expenditures affect crime rates. Previously, Professor Steven D. Levitt used the number of municipal firefighters as an instrument, even though firefighter employment levels were correlated with police force size and crime rates.[36] As is shown in the regression analyses for this evaluation, fire department expenditures are uncorrelated with crime rates while correlated with police department expenditures.
Endogeneity tests are performed to determine whether the 2SLS models are preferred over the OLS models. If the police expenditures are endogenous, the 2SLS model is chosen over the OLS model. However, if police expenditures are exogenous, the OLS model is preferred. Not only is 2SLS unnecessary when endogeneity is not an issue, but the method produces larger standard errors than OLS. Thus, 2SLS should be used only when the technique is required.
The models used in the analyses control for yearly fixed effects and cross-sectional fixed effects (individual differences related to each city), which account for time-invariant unobserved factors that cause crime rates in a particular city to differ from crime rates in other cities. The fixed-effects model helps to control for differences in city crime rates that are not explained by the independent variables. In addition, the fixed-effects model uses time-specific fixed effects, which involve the inclusion of year dummy variables. The year dummy variables control for unobserved factors that affect crime nationwide and that are not accounted for by the control variables.
Including the specific differences attributable to each city in the fixed-effects model helps to control for possible selection biasin the COPS program’s allocation of grants. Selection bias may occur if more innovative and effective police agencies are more likely to apply for and receive COPS grants than other agencies are. The cross-sectional fixed-effects model helps to control for selection bias by giving each city an intercept, which allows the individual differences of the cities to be absorbed. The fixed-effects model can reduce selection bias; however, it may not eliminate it entirely.
Police Expenditure Function. Previous research on intergovernmental grants and the flypaper effect indicates that some of the COPS grants may stimulate city police department spending. A stimulus effect on city police expenditures is expected because COPS hiring and MORE grants are normally closed-ended matching grants, meaning that the grant recipients must provide a certain percentage in matching local funds. The innovative grants do not require matching local funds, so these grants are not expected to produce a stimulus effect. Thus, the coefficients for the hiring and MORE grants are expected to be positive and statistically different from zero, while the coefficients for the innovative grants are predicted to be statistically indistinguishable from zero.
The purposes of the police expenditure function are twofold.
First, the model estimates whether COPS grants had a flypaper effect on police expenditures.
Second, the police expenditure functions provide estimates of police expenditures for the 2SLS crime models.
Operating on the assumption that city officials consider all crime rates in their police department funding decisions, the police expenditure function includes lags of all the crime variables. Not including lagged crime rates as independent variables in the police expenditure function would likely result in a misspecified model. A review of the literature on the determinants of police force size found that crime rates are commonly used as independent variables.[37] The police expenditure function specification is presented in Equation 1.

Crime Models. The analysis of this paper concentrates on finding evidence of whether COPS grants affected crime rates in large cities. How COPS grants influenced crime rates can be explained through general deterrence theory, which supposes that increasing the risk of apprehension and punishment for crimes will deter members of society as a whole from committing crime. Increased technology and labor are expected to increase the probabilities that the police can apprehend criminals.[38] Under the theory advocated by Nobel Laureate Gary S. Becker, the “more that is spent on policemen, court personnel and specialized equipment, the easier it is to discover offenses and convict offenders.”[39] Further, the effectiveness of police departments can be influenced by the technology used for and the funds spent on law enforcement.[40] However, additional police expenditures will not necessarily be correlated with increased deterrence if the officers are desk-bound.[41] As previously mentioned, through placement of additional officers engaged with the community, COPS grants are expected to increase the criminals’ expected risks of detection; thus, crime should be prevented.
In addition to deterrence, by assisting in engaging additional officers in community policing, COPS grants are predicted to improve community relations and make the grantees more responsive to community needs. Increased resources and improved policing strategies are expected to reduce crime rates.
While the literature on the relationship between police force size and crime rates indicates that the relationship is unclear,[42] using the Granger-causality method, Thomas B. Marvell of Justec Research and Carlisle E. Moody of the College of William and Mary suggest that the hiring of additional police officers is associated with reductions in crime rates.[43] Professor Steven D. Levitt used election cycles as an instrument to find that increased police staffing is associated with reductions in crime.[44] However, Assistant Professor Justin McCrary of the University of Michigan found that a weighting error led Professor Levitt to make mistaken inferences about the relationship between police and crime.[45]
For all of the estimations, the dependent variable for the crime models is lagged as a control variable. This modeling is used for two reasons.
First, due to the inclusion of the lagged crime rate in the police expenditure function, the absence of the lag from the crime model would make the lag an instrument. Including the lag of the crime dependent variable as control variable in the crime models as well as in the police expenditure function makes it an exogenous variable in both equations.
Second, lagging the dependent crime variable will control for historical factors that affect differences in the dependent variable. Some cities have higher crime rates than other cities, so lagging crime rates is a general way of accounting for unobserved differences that affect current crime rates.[46] While the cross-sectional fixed effects account for unobserved variables that are time-invariant, the inclusion of the lagged crime dependent variable helps to capture unobserved social factors that fluctuate over time within cities.
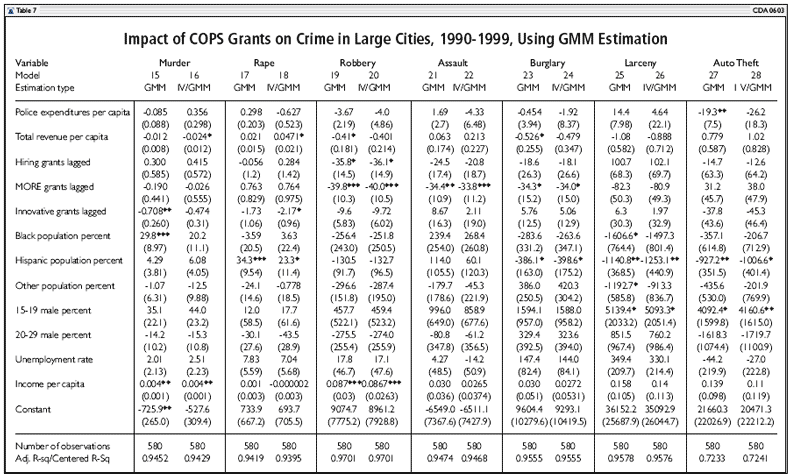
One possible concern about the specification of the crime models is that lagging the dependent variable may bias the OLS and 2SLS estimates. To address this concern, additional regressions were estimated using generalized method of moments (GMM). The GMM findings produce coefficients that are remarkably similar to the OLS and 2SLS coefficients reported in the paper.[47] (See the Appendix.)
Contemporaneous crime control variables are omitted from the police expenditure functions because the periods in which police expenditures are allocated are different from the periods used to measure crime rates. The crime variables are based on calendar years, while the police expenditure variables are based on different fiscal years that begin on different days of the year, depending on local practices.[48] Due to the absence of synchronous relationship between the variables, city officials do not know the extent of crime during the calendar year when they allocate budgets for police departments based on fiscal years. Therefore, a simultaneous relationship between current-year crime rates and fiscal-year police expenditures is unlikely to exist. However, 2SLS is still estimated.
The COPS grant variables are not considered to have a simultaneous relationship with crime because COPS grant funding is determined one year before current-year crime rates occur. This means that current-year crime rates cannot determine COPS grant funding levels, which are determined the previous year. In response to rising crime rates, city officials can apply for more COPS grant funding, but by the time the grant funding has been approved and implemented, almost a year has passed. Thus, COPS grants are not believed to have a simultaneous relationship with crime rates.
The crime models include lags of all crime rates as control variables. Each lagged crime variable is assumed to capture a different set of unobserved time-variant factors that may influence current crime rates. For example, the lagged murder rate is anticipated to account for particular social problems and disorder that may not be controlled for by the lagged burglary rate. Further, lagged burglaries are assumed to control for factors that are not controlled for by lagged murders. Under this specification, lags of crime rates different from the dependent variable are assumed to influence current-year crime rates. Due to the inclusion of the rape rate lagged as a control variable, the number of cities analyzed for all the models in this specification will be 58 cities. The crime models are represented by Equation 2.

Endogeneity Tests. Endogeneity implies that unobservable factors are correlated with police expenditures and crime. To test this assumption, the reduced form equation (police expenditure function) is estimated by regressing police expenditures on all exogenous variables and then obtaining the residuals.[49] Then the structural equation (crime models) is estimated with the residuals from the reduced form equation included as a regressor. If the coefficient for the residuals is statistically significant, police expenditures are endogenous. All of the tests failed to reject the null hypotheses at the 95 percent confidence level that police expenditures are exogenous. As part of the sensitivity analysis, OLS estimates are compared to 2SLS estimates for all of the models.
While the OLS modeling is preferred over the 2SLS modeling, fire department expenditures are a good instrument. For all of the models, this instrument was correlated with police expenditures and uncorrelated with crime rates. Table 3 presents the identification restriction tests. The demand for public safety affects both police and fire department expenditures, while there is little reason to believe that fire department expenditures influence crime rates.
Results
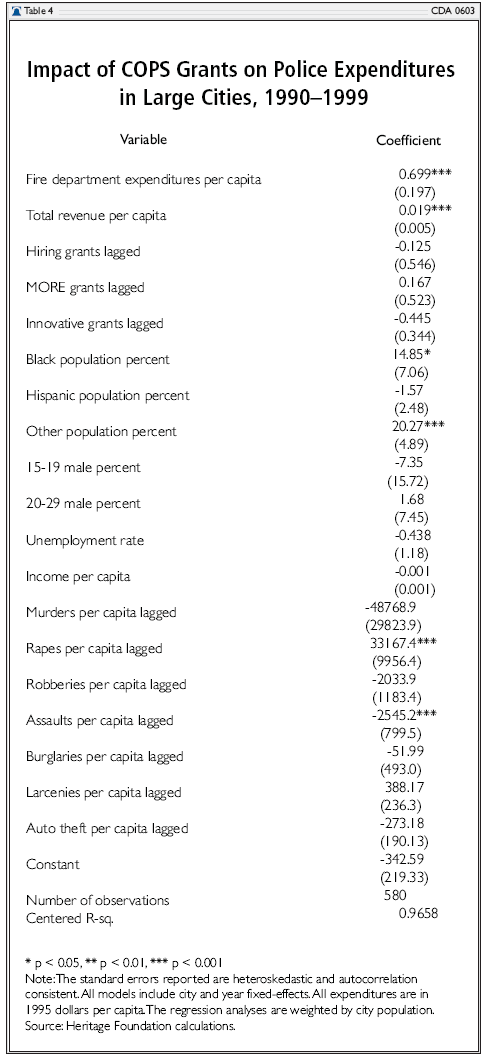
Did COPS grants produce flypaper effects in large cities? Table 4 presents the COPS grant findings from the police expenditure function. The standard errors are robust to heteroskedasticity and autocorrelation.[50] COPS grants not only failed to “stick,” but also did not stimulate local spending. The hiring and innovative grant coefficients are negative but statistically indistinguishable from zero. With the hiring and MORE grants normally requiring 25 percent local matches by grantees, these grants should have produced a stimulus effect. The innovative grants, which did not require local matches, were not anticipated to produce any catalyst. While the MORE grant coefficient is positive, it is statistically insignificant. The police expenditure findings suggest that grantees supplanted local funds with federal funds.
Did police expenditures and COPS grants reduce crime in large cities? Before proceeding to the findings, an explanation about the presentation of the findings in table format is necessary. The crime dependent variables are measured on a per capita basis, so the coefficients for police expenditures and COPS grants are small. In order to improve the visual presentation of the findings, these coefficients and their standard errors are multiplied by 1 million. Table 5 presents the crime regression results. For the robbery and larceny 2SLS models, the standard errors are robust to heteroskedasticity and autocorrelation.[51] For all the other models, the standard errors are robust to heteroskedasticity.[52]
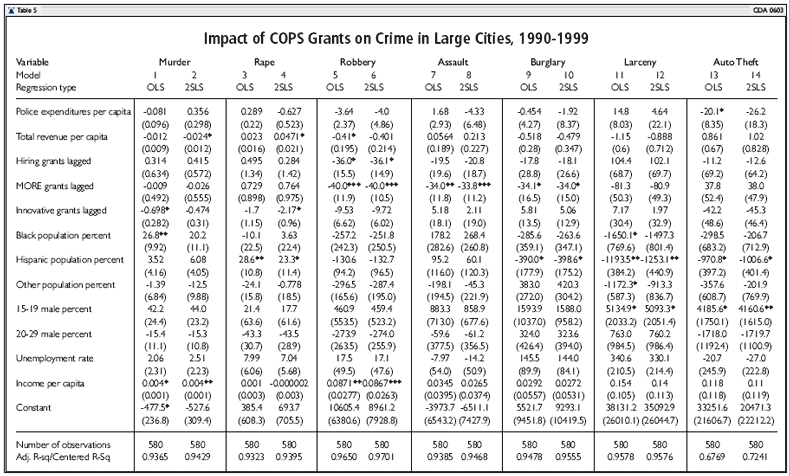
For the murder models, the only law enforcement variable to deter murders is the innovative grant variable in the OLS model. A $1 increase in innovative grants per capita is associated with a reduction of 0.698 murders per 1 million persons. This finding is statistically significant at the 0.05 level. For the elasticity, a 1 percent increase in innovative grants per capita is associated with a 0.001 percent decrease in murders per capita.
For the OLS rape model, the police expenditure and COPS grant coefficients are statistically indistinguishable from zero. The coefficients for the hiring and MORE grants are positive but statistically insignificant. For the 2SLS rape model, the innovative grant coefficient is the only law enforcement coefficient that is statistically significant. A $1 increase in innovative grants per capita is associated with a reduction of 2.17 rapes per 1 million residents. A 1 percent increase in innovative grants per capita is associated with 0.001 percent reductions in rape rates.
In the OLS and 2SLS robbery models, the hiring and MORE grant coefficients are negative and statistically significant. A $1 increase in hiring grants per capita is associated with a reduction of 36.0 to 36.1 robberies per 1 million residents. A 1 percent increase in hiring grants per capita is associated with an approximately 0.01 percent reduction in robberies. The hiring grant coefficients are statistically significant at the 0.05 level.
The MORE grant coefficients are larger than the hiring grant coefficients. In the OLS and 2SLS robbery models, a $1 increase in MORE grants per capita is associated with a reduction of 40.0 robberies per 1 million residents. For the elasticity, a 1 percent increase in MORE grants per capita is associated with an approximately 0.007 percent reduction in robberies. The MORE grant coefficients are highly statistically significant at the 0.001 level. The hiring and MORE grants appear to be the most effective in reducing robberies when compared with general local law enforcement expenditures and innovative grants.
In the OLS and 2SLS assault models, the MORE grant coefficients are statistically significant at the 0.01 and 0.001 levels, while the other law enforcement variables are not statistically significant. A $1 increase in MORE grants per capita is associated with a reduction of 33.8 to 34.0 assaults per 1 million residents. A 1 percent increase in MORE grants per capita is associated with an approximately 0.005 percent reduction in robberies.
The results of the burglary models are very similar to the assault models. The MORE grant variable is the only law enforcement variable that has a statistically significant relationship with burglary rates. A $1 increase in MORE grants per capita is associated with a reduction of 34.0 to 34.1 burglaries per 1 million residents. A 1 percent increase in MORE grants per capita is associated with a 0.002 percent reduction in burglaries. The MORE grant coefficients are statistically significant at the 0.05 level.
For the larceny-theft models, none of the law enforcement variables had statistically significant relationships with larcenies. This pattern almost holds in the motor vehicle theft models. While all of the COPS grant coefficients are statistically insignificant, the local police expenditure coefficient in the OLS motor vehicle theft model is statistically significant at the 0.05 level. A $1 increase in local law enforcement expenditures is associated with a reduction of 20.1 auto thefts per 1 million residents. For the elasticity, a 1 percent increase in local police expenditures per capita is associated with a 0.3 percent decrease in the auto theft rate.
For some crime rates, COPS grants have a deterrent effect. The hiring grants are linked only to reductions in robberies, while these grants failed to have measurable effects on the other crime rates. The MORE grants deter more types of crimes than the other grants. MORE grants deterred robberies, assaults, and burglaries in all of the models. For these crime rates, the deterrent effect of the MORE grants is robust in the sensitivity analysis. However, the MORE grants failed to deter murders, rapes, larcenies, and auto thefts. The deterrent effect of the innovative grants on murders is mixed, and they failed to deter robberies, assaults, burglaries, larcenies, and auto thefts.
Are COPS grants worth their cost? Which COPS grant produces the greatest benefit? Answering this question is complicated due to the grants’ varying impacts on crime. To help simplify the analysis, the monetary estimates are limited to the findings of the OLS models. The hiring grants deter robberies, while the MORE grants deter robberies, assaults, and burglaries. The innovative grants deter murders. Further, the degree of deterrence produced varies by grant and crime.
Using prior research on the cost of crime to victims, this section estimates the value of the crimes prevented by COPS grants. Specifically, the dollar values of crimes prevented through COPS grants are estimated for a city with 1 million residents. A 1996 NIJ study estimated the cost of crime incurred by victims based on personal expenses (e.g., medical care and property losses); reduced productivity relating to work, home, and school; and quality of life losses.[53] For the analysis, the NIJ figures are converted into 1995 dollars. Thus, the revised estimates are $3,100,734 for murder, $8,437 for robbery, $25,312 for assault, $1,477 for burglary, and $3,902 for auto theft.
The cities studied in this evaluation did not receive equal shares of the three COPS grants. From 1995 to 1999, the cities spent an average of $3.05 per capita in hiring grants, $1.36 per capita in MORE grants, and $0.62 per capita in innovative grants. Table 6 presents the findings. Following this spending pattern for a city with 1 million residents comes to $3,053,031 in hiring grants, $1,359,716 in MORE grants, and $620,816 in innovative grants—a total of $5,030,532 per year.
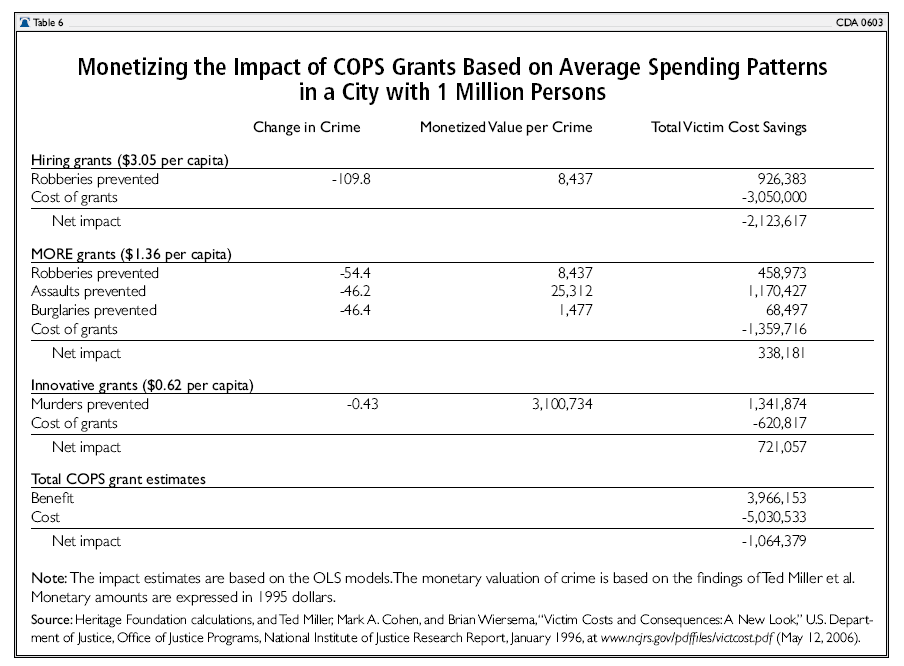
Based on the OLS estimates, $3,050,000 in hiring grant spending produced a victim cost-savings of $926,383. For the MORE grants, $1,359,716 in spending produced a victim cost-savings of $1,697,897. With an average spending amount of $620,816, the innovative grants produced a victim cost-savings of $1,341,874. The total estimated victim cost-savings is $3,966,153. By these estimates, COPS grants produced a net loss of $1,064,379. The negative return of the hiring grants appears to inundate the positive benefits of the MORE and innovative grants.
Overall, the innovative grants are allocated the smallest share of COPS funding but appear to produce the greatest monetary benefits. While the benefits of the MORE grants are not as large as the benefits of the innovative grants, the MORE grants do produce positive returns. Unlike the other grants, the hiring grants, which were allocated the largest share of funding over the years and received the most public attention, appear to be the least worthwhile of the grants.
Discussion
At first glance, the results for the COPS grants are puzzling because the matching requirements for the hiring and MORE grants should have led police departments to increase spending from their own resources. The findings suggest that COPS grants did not stimulate grantees to increase spending from their own revenue above levels that they would have spent without the grants.
Evidence of Supplanting. Since the hiring and MORE grants are closed-ended matching grants, they should have produced a stimulus effect on police expenditures. Instead, the hiring and MORE grant findings indicate that large cities used federal funds to supplant local funds.
These findings are consistent with audits of COPS grants by the U.S. Department of Justice Office of Inspector General. Audits of grants to the cities analyzed in this paper indicate that the grantees frequently failed to hire or redeploy officers as required. In some cases, the grantees used federal funds to supplant local funds.
Fifty-seven of the 58 cities received COPS grants during the duration of this study. The Inspector General audited 35 of the 57 COPS-funded cities.[54] Twenty-nine of the 35 audits found grantee deficiencies in complying with grant conditions.[55]
Sixteen of the 35 audits indicated that the grantees did not comply with the hiring grant conditions.[56] The problems ranged from supplanting to spending the hiring grants on activities not allowed under the grant conditions. Nine of the police departments supplanted hiring grants for local funds. Dallas, Louisville, and Newark actually reduced their force sizes after receiving grants to hire additional officers. For example, instead of hiring 249 new officers, Newark reduced its police force by 142 officers from fiscal years 1996 to 1997.
Instead of downsizing, other audits indicate that six police departments supplanted by failing to hire the required number of additional officers.[57] For example, Atlanta, El Paso, and Sacramento appear to have supplanted the most. Atlanta supplanted over $5.1 million in hiring grants. After receiving grants to hire 231 additional police officers, El Paso failed to hire the additional number of officers required by the grant. Sacramento used over $3.9 million in hiring grants to retain officers previously funded through earlier grants.
The Inspector General also found problems with the implementation of MORE grants. Nineteen of the 35 audits indicated that grantees failed to comply with the conditions of the MORE grants.[58] According to congressional testimony by Inspector General Glenn Fine, MORE grants have the highest risk for abuse of the COPS grants, and grantees rarely redeployed the required number of officers from administrative tasks to community policing.[59]
Sixteen of the audits found that MORE grantees either did not redeploy officers to community policing or could not provide documentation demonstrating redeployment.[60] In Washington, D.C., the police department was awarded almost $11 million in MORE grants to hire 56 civilians and redeploy 521.4 officers through technology purchases. However, when the Office of Inspector General asked for a list of officers redeployed, the list included only 53 officers—one officer was deceased, 10 officers were retired, and 13 no longer worked for the police department.
COPS appears to have done little to resolve the misuse of the grants. According to Inspector General Fine, "in many cases, the response to our findings was a paper exercise and?the COPS program did not take sufficient action to either bring the grantee in compliance, to offset the funds, to recoup the funds or to waive the funds."[61] Fine testified that COPS did not pay enough attention to ensure adherence to the grant requirements, including the hiring of officers, retaining officers, and tracking the redeployment of officers.[62] According to the Office of Inspector General audits and congressional testimony, the lack of oversight practiced by COPS created inadequate incentives for local-level compliance with grant conditions.
There appears to be ample evidence that the grantees frequently failed to follow the conditions of the hiring and MORE grants. The acceptance of COPS grants by police departments does not necessarily mean that community policing was implemented successfully.[63] The misuse of the hiring grants may explain why the grants produced negative returns when the deterrence effects were monetized. Improving the implementation of the hiring and MORE grants through increased monitoring by COPS may enhance the effectiveness of the program.
Other studies have found that supplanting may have occurred with the hiring grants. Based on an analysis of approximately 12,000 police departments, one study found that every COPS-funded officer position awarded through the hiring grants in a particular year resulted in an increase of 0.73 officers in the following year.[64] This finding indicates that supplanting may have occurred. Nationally, the University of Maryland study found that for every COPS-funded position, grantees increased their officer levels by 0.69 officers. For cities with populations over 250,000, police departments increased their officer levels by 0.95 officers for every COPS-funded position.[65] Nationally, the GAO estimates that every $25,000 in hiring grant spending resulted in 0.57 additional officers. However, the hiring grants did not have a statistically significant relationship with officer levels in cities with populations over 150,000.[66]
Effectiveness of Deploying Experienced Officers. Compared to the hiring grant findings, the MORE grant findings suggest that the number of officers deployed may be less important than the quality of the officers deployed. While the efficiency gains resulting from the MORE grants are uncertain, the grants may have allowed for more experienced officers to spend less time performing administrative tasks and more time engaged in crime-fighting activities. In addition, paying experienced officers to work overtime may be more effective than hiring new officers. Thus, putting more seasoned officers on the beat will likely have a larger impact than putting newly hired, inexperienced officers on the street.
Ineffectiveness of Local Police Expenditures. Countering the hypotheses, police expenditures appear to produce little, if any, deterrent effect. Police expenditures deterred only auto thefts. Two explanations have been proposed for why increasing police resources will not necessarily deter crime.
The first theory, which was originally offered by Professor Lawrence Sherman of the University of Pennsylvania, suggests that increasing police resources without regard to focusing on risk factors may not be successful in reducing crime.[67] After reviewing evaluations of various police strategies to reduce crime, Professor Lawrence Sherman and Professor John E. Eck of the University of Cincinnati concluded that the more focused the police are on risk factors, the more likely it is that crime will be prevented.[68] Activities such as proactive arrests and problem solving in high-crime hot spots are more likely to reduce crime than is hiring additional police officers without regard to how they are deployed.[69] The number of police deployed and the level of expenditures may be less important in reducing crime than the specific tasks assigned to police officers. Deterring crime is likely to depend more on deploying officers where serious crime is concentrated and at times when the probability of occurrence is high.[70]
Second, the use of aggregate local police expenditures may not be the best variable to measure the deterrent effect of the police. The deterrent effect of police expenditures may be clouded when the variable includes administrative and other expenditures not directly associated with crime control activities that cannot plausibly be considered to reduce crime (e.g., office supplies).
Recent Changes in the COPS Grants. This evaluation analyzed the effect of COPS grants during the 1990s. Since then, the COPS program has gone through substantial changes. During the last few years of the Clinton Administration, many of the innovative grant programs were discontinued. Several of these grant programs were considered demonstration or pilot projects, so they were never viewed as long-term projects. While the innovative grants produced the greatest benefits when the impacts are monetized, these grants did not generate enough political support to become permanent.
During the current Bush Administration, the COPS program has gone through further changes. Most notable are three changes.
First, after several years of steadily declining appropriations from highs of over $1 billion during the Clinton Administration, no new funds were appropriated for the hiring grants in fiscal year 2006.
Second, the MORE grants, renamed technology grants, no longer require grantees to use the funding to redeploy officers from administrative tasks to community policing.
Third, instead of the original competitive application process, the technology grants are now awarded through congressional earmarks. Limiting the MORE grants to earmarks may negate the deterrent effect found in this evaluation.
Conclusion
A possible source of bias in estimating the effect of police on crime is the potential endogenous or simultaneous relationship between police force size and crime rates. Regression analyses of the effects of criminal justice policies are often plagued by simultaneity.
Under regression modeling for this evaluation, police expenditures did not have an endogenous relationship with crime rates. However, when 2SLS modeling was estimated, fire department expenditures fulfilled the identification restriction requirements of an instrumental variable. The identification of fire department expenditures as a valid instrumental variable is an important contribution to the literature estimating the relationship between police and crime because instruments that are correlated with both crime and police force size can cause 2SLS estimates to be seriously in error.
The results of this study indicate that COPS grants awarded to large cities did not stimulate local spending and that the cities may have used the grants to supplant local police expenditures. This finding is supported by U.S. Department of Justice Office of Inspector General audits of COPS grants.
Whether or not community policing is an effective crime reduction strategy, this evaluation found that federal funding for community policing was associated with small reductions in crime in large cities. However, the monetary impacts produced by the three grants are not equal. The innovative and MORE grants produced positive net benefits, while the hiring grants produced negative returns. A stronger emphasis on oversight by COPS may improve on the effectiveness of the grants.
David B. Muhlhausen , Ph.D., is Senior Policy Analyst in the Center for Data Analysis at The Heritage Foundation.
Appendix
Bibliography
Becker, Gary S. "Crime and Punishment: An Economic Approach." In The Economic Dimensions of Crime. Edited by Nigel G. Fielding, Alan Clarke, and Robert Witt. New York: St. Martin's Press, 2000, pp. 15—68. Originally published in Journal of Political Economy, Vol. 76, No. 2 (1968): pp. 169—217.
Blumstein, Alfred, Jacqueline Cohen, and Daniel Nagin, eds. Deterrence and Incapacitation: Estimating the Effects of Criminal Sanctions on Crime Rates. Washington, D.C.: Panel on Research on Deterrence and Incapacitation, National Research Council, 1978.
Bromwich, Michael R. "Management and Administration of the Community Oriented Policing Services Grant Program." Report No. 99—21. U.S. Department of Justice, Office of Inspector General, Audit Division, July 1999, at http://www.usdoj.gov/oig/au9921/9921toc.htm (December 20, 2002).
Cushing, Matthew J., and Mary G. McGarvey. "Covariance Matrix Estimation." In Generalized Methods of Moments Estimation. Edited by Laszlo Matyas. Cambridge, U.K.: Cambridge University Press, 1999.
Davis, Gareth, David B. Muhlhausen, Dexter Ingram, and Ralph Rector. "The Facts About COPS: A Performance Overview of the Community Oriented Policing Services Program." Heritage Foundation Center for Data Analysis Report No. CDA00—10, September 25, 2000, at http://www.heritage.org/Research/Crime/CDA01-05.cfm.
Dnes, Antony W. "The Economics of Crime." In The Economic Dimensions of Crime. Edited by Nigel G. Fielding, Alan Clarke, and Robert Witt. New York: St. Martin's Press, 2000, pp. 70—81.
Eck, John, and Edward Maguire. "Have Changes in Policing Reduced Violent Crime?" In The Crime Drop in America. Edited by Alfred Blumstein and Joel Wallman. New York: Cambridge University Press, 2000, pp. 207—265.
Ekstrand, Laurie E. "Technical Assessment of Zhao and Thurman's 2001 Evaluation of the Effects of COPS Grants on Crime." GAO—03—867R. U.S. General Accounting Office, June 12, 2003.
Evans, William N., and Emily Owens. "Flypaper COPS." Working paper. University of Maryland, Department of Economics, 2005.
Fisher, Franklin M., and Daniel Nagin. "On the Feasibility of Identifying the Crime Function in a Simultaneous Model of Crime Rates and Sanction Levels." In Deterrence and Incapacitation: Estimating the Effects of Criminal Sanctions on Crime Rates. Edited by Alfred Blumstein, Jacqueline Cohen, and Daniel Nagin. Washington, D.C.: Panel on Research on Deterrence and Incapacitation, National Research Council, 1978, pp. 361—399.
Gamkhar, Shama. Federal Intergovernmental Grants and the States: Managing Devolution. Cheltenham, U.K.: Edward Elgar, 2002.
Greene, William H. Econometric Analysis. Upper Saddle River, N.J.: Prentice Hall, Inc., 2000.
Hamilton, Bruce W. "The Flypaper Effect and Other Anomalies." Journal of Public Economics, Vol. 22, No. 3 (December 1983): pp. 347—361.
Hayashi, Fumio. Econometrics. Princeton, N.J.: Princeton University Press, 2000.
Hsiao, Cheng. Analysis of Panel Data. Cambridge: Cambridge University Press, 1986.
Koper, Christopher, Jeffrey A. Roth, and Edward Maguire. "Putting 100,000 Officers on the Street: Progress as of 1998 and Preliminary Projections Through 2003." In National Evaluation of the COPS Program: Title I of the 1994 Crime Act. Edited by Jeffrey A. Roth, Joseph F. Ryan, Stephen J. Gaffigan, Christopher S. Koper, Mark H. Moore, Janice A. Roehl, Calvin C. Johnson, Gretchen E. Moore, Ruth M. White, Michael E. Buerger, Elizabeth A. Langston, and David Thatcher. Washington, D.C.: U.S. Department of Justice, Office of Justice Programs, National Institute of Justice, 2000, pp. 149—176.
Levitt, Steven D. "Using Electoral Cycles in Police Hiring to Estimate the Effect of Police on Crime." American Economic Review, Vol. 87, No. 3 (1997): pp. 270—290.
———. "Using Electoral Cycles in Police Hiring to Estimate the Effects of Police on Crime: Reply." American Economic Review, Vol. 92, No. 4 (2002): pp. 1244—1250.
Loftin, Colin, and David McDowall. "The Police, Crime, and Economic Theory: An Assessment." In What Works in Policing. Edited by David H. Bayley. New York: Oxford University Press, 1998, pp. 10—25. Originally published in American Sociological Review, Vol. 47 (June 1982): pp. 393—401.
Maguire, Edward R. "Research Evidence on Factors Influencing Police Strength in the United States." In Hiring and Retention Issues in Police Agencies: Readings on the Determinants of Police Strength, Hiring and Retention of Officers, and the Federal COPS Program. Edited by Christopher S. Koper, Edward E. Maguire, and Gretchen E. Moore. Washington, D.C.: Urban Institute, Justice Policy Center, 2001, pp. 7—25.
Marvell, Thomas B., and Carlisle E. Moody. "Specification Problems, Police Levels, and Crime Rates." Criminology, Vol. 34, No. 4 (1996): pp. 600—645.
McCrary, Justin. "Using Electoral Cycles in Police Hiring to Estimate the Effects of Police on Crime: Comment." American Economic Review, Vol. 92, No. 4 (2002): pp. 1236—1243.
Miller, Ted R., Mark A. Cohen, and Brian Wiersema. "Victim Costs and Consequences: A New Look." U.S. Department of Justice, Office of Justice Programs, National Institute of Justice Research Report, January 1996.
Moore, Mark H. "The Limits of Social Science in Guiding Policy." Criminology and Public Policy, Vol. 2, No. 1 (2002): pp. 33—42.
Muhlhausen, David B. "Do Community Oriented Policing Services Grants Affect Violent Crime Rates?" Heritage Foundation Center for Data Analysis Report No. CDA01—05, May 25, 2001, at http://www.heritage.org/Research/Crime/CDA01-05.cfm.
———. "Research Challenges Claims of COPS Effectiveness." Heritage Foundation Center for Data Analysis Report No. 02—02, April 5, 2002, at http://www.heritage.org/Research
/Crime/CDA02-02.cfm.
———. "Impact Evaluation of the Community Oriented Policing Services (COPS) Grant Program." Unpublished dissertation. University of Maryland, Baltimore County, Department of Public Policy.
Phillips, L., and H. L. Votey. "An Economic Analysis of the Deterrent Effect of Law Enforcement on Criminal Activity." Journal of Criminal Law, Criminology, and Police Science, Vol. 63, No. 3 (1972): pp. 330—342.
Rich, Michael J. "Targeting Federal Grants: The Community Development Experience, 1950— 1986." Publius: The Journal of Federalism, Vol. 21 (Winter 1991): pp. 29—49.
Rossi, Peter H., Howard E. Freeman, and Mark W. Lipsey. Evaluation: A Systematic Approach. Thousand Oaks, Calif.: Sage Publications, 1999.
Roth, Jeffery A., Christopher S. Koper, Ruth White, and Elizabeth A. Langston. "Using COPS Resources." In National Evaluation of the COPS Program: Title I of the 1994 Crime Act. By Jeffrey A. Roth, Joseph F. Ryan, Stephen J. Gaffigan, Christopher S. Koper, Mark H. Moore, Janice A. Roehl, Calvin C. Johnson, Gretchen E. Moore, Ruth M. White, Michael E. Buerger, Elizabeth A. Langston, and David Thatcher. Washington, D.C.: U.S. Department of Justice, Office of Justice Programs, National Institute of Justice, 2000, pp. 101—142, at http://www.ncjrs.gov/pdffiles1/nij/183643.pdf (May 1, 2006).
Roth, Jeffery A., and Joseph F. Ryan. "The COPS Program After 4 Years—National Evaluation." U.S. Department of Justice, National Institute of Justice Research in Brief, August 2000.
Roth, Jeffrey A., Joseph F. Ryan, Stephen J. Gaffigan, Christopher S. Koper, Mark H. Moore, Janice A. Roehl, Calvin C. Johnson, Gretchen E. Moore, Ruth M. White, Michael E. Buerger, Elizabeth A. Langston, and David Thatcher. National Evaluation of the COPS Program: Title I of the 1994 Crime Act. Washington, D.C.: U.S. Department of Just-ice, Office of Justice Programs, National Institute of Justice, 2000, at http://www.ncjrs.gov/pdffiles1/nij/183643.pdf (May 12, 2006).
Schwallie, Daniel P. The Impact of Intergovernmental Grants on the Aggregate Public Sector. New York: Quorum Books, 1989.
Sherman, Lawrence. "Police and Crime Control." In Modern Policing. Edited by Michael Tonry and Norval Morris. Chicago: University of Chicago Press, 1992, pp. 159—230.
———. "The Police." In Crime. Edited by James Q. Wilson and Joan Petersilia. San Francisco: Institute for Contemporary Studies, 1995, pp. 327—348.
Sherman, Lawrence W. "Policing for Crime Prevention." In Preventing Crime: What Works, What Doesn't, What's Promising. Edited by Lawrence W. Sherman, Denise Gottfredson, Doris Mackenzie, John Eck, Peter Reuter, and Shawn Bushway. Washington, D.C.: U.S. Department of Justice, Office of Justice Programs, 1997.
Sherman, Lawrence W., and John E. Eck. "Policing for Crime Prevention." in Evidence-Based Crime Prevention. Edited by Lawrence W. Sherman, David P. Farrington, Brandon C. Welsh, and Doris Layton MacKenzie. London: Routledge, 2002, pp. 295—329.
Trojanowicz, Robert, Victor E. Kappeler, Larry K. Gaines, and Bonnie Bucqueroux. Community Policing: A Contemporary Perspective. 2nd ed. Cincinnati, Ohio: Anderson Publishing, 1998.
University of Missouri, Office of Social and Economic Data Analysis. Post-1990 Population Estimates for U.S. Counties & Higher Level Geographies By Age, Race, Sex and Hispanic Origin thru 1999, at http://www.oseda.missouri.edu/uic/uicapps/agersex.html (May 19, 2003).
U.S. Congress, House of Representatives, Committee on the Judiciary, Subcommittee on Crime. 2002. Hearing. Office of Justice Programs. 107th Congress, 2nd Session, March 5, 7, and 14, 2002.
U.S. Department of Commerce, Bureau of Economic Analysis, Regional Accounts Data, Local Area Personal Income, at http://www.bea.doc.gov/bea/regional/reis (May 19, 2003).
U.S. Department of Commerce, Census Bureau, Government Division. 1989—1999. Annual Survey of State and Local Government Finances, at http://www.census.gov/govs/
www/estimate.html (May 19, 2003).
U.S. Department of Justice, Bureau of Justice Statistics. Large Local Agency Crime Trends, at http://bjsdata.ojp.usdoj.gov/dataonline/Search
/Crime/Local/LocalCrimeLarge.cfm (May 19, 2003).
U.S. Department of Justice, Federal Bureau of Investigation. Crime in the United States, 1999. Washington, D.C.: U.S. Government Printing Office, 2000.
U.S. Department of Justice, Office of Community Oriented Policing Services. "What Is Community Policing?" revised April 8, 2003, at http://www.cops.usdoj.gov/default.asp?Item=36 (August 27, 2003).
———. Press release. "About COPS: Rebuilding the Bond Between Citizens and the Government." May 12, 1999, at http://permanent.access.gpo.gov/lps9890/lps9890/
http://www.usdoj.gov/cops/news_info/default.htm (May 12, 2006).
———. COPS Management System (CMS) database. 2000.
U.S. Department of Justice, Office of Inspector General. "Community Policing Grant to Combat Domestic Violence Administered by the City of Tulsa, Oklahoma, Police Department." Executive summary. Audit Report No. GR—80— 99—005, February 12, 1999, at http://www.usdoj.gov/oig/grants/g8099005.htm (May 18, 2006).
———. "Office of Community Oriented Policing Services AHEAD and UHP Grants to the Philadelphia, Pennsylvania Police Department." Executive summary. Audit Report No. GR—70— 97—004, August 1997, at http://www.usdoj.gov/oig/grants/g7097004.htm (May 16, 2006).
———. "Office of Community Oriented Policing Services Awarded to the Houston, Texas Police Department." Executive summary. Audit Report No. GR—80—97—019, September 30, 1997, at http://www.usdoj.gov/oig/grants/g8097019.htm (May 16, 2006).
———. "Office of Community Oriented Policing Services Grants to the Indianapolis, Indiana Police Department." Executive summary. Audit Report No. GR—50—98—005, January 1998, at http://www.usdoj.gov/oig/grants/g5098005.htm (May 18, 2006).
———. "Office of Community Oriented Policing Services Grants to the City of San Francisco Police Department, California." Executive summary. Audit Report No. GR—90—98—003, February 1998, at http://www.usdoj.gov/oig/grants/g9098003.htm (May 16, 2006).
———. "Office of Community Oriented Policing Services Grants to the City of San Jose Police Department, California." Executive summary. Audit Report No. GR—90—98—008, February 1998, http://www.usdoj.gov/oig/grants/g9098008.htm (May 16, 2006).
———. "Office of Community Oriented Policing Services Grants to the City of Mesa Police Department, Arizona." Executive summary. Audit Report No. GR—90—98—015, March 1998, http://www.usdoj.gov/oig/grants/g9098015.htm (May 16, 2006).
———. "Office of Community Oriented Policing Services Grants to the Atlanta, Georgia, Police Department." Executive summary. Audit Report No. GR—40—98—006, April 1998, at http://www.usdoj.gov/oig/grants/g4098006.htm (May 16, 2006).
———. "Office of Community Oriented Policing Services Grants to the Metropolitan Nashville, Tennessee, Police Department." Executive summary. Audit Report No. GR—40—98—010, April 1998, at http://www.usdoj.gov/oig/grants/g4098010.htm (May 16, 2006).
———. "Office of Community Oriented Policing Services Grants to the City of Sacramento Police Department, California." Executive summary. Audit Report No. GR—90—98—022, May 1998, at http://www.usdoj.gov/oig/grants/g9098022.htm (May 16, 2006).
———. "Office of Community Oriented Policing Services Grants to the City of Oakland Police Department, California." Executive summary. Audit Report No. GR—90—98—029, June 1998, at http://www.usdoj.gov/oig/grants/g9098029.htm (May 16, 2006).
———. "Office of Community Oriented Policing Services Grants to the St. Louis Metropolitan Police Department, St. Louis, Missouri." Executive summary. Audit Report No. GR—50—98— 017, June 25, 1998, at http://www.usdoj.gov/oig/grants/g5098017.htm (May 18, 2006).
———. "Office of Community Oriented Policing Services Grants to the Newark, New Jersey Police Department." Executive summary. Audit Report No. GR—70—98—007, June 1998, at http://www.usdoj.gov/oig/grants/g7098007.htm (May 16, 2006).
———. "Office of Community Oriented Policing Services Grants to the City of Pittsburgh, Pennsylvania Police Department." Executive summary. Audit Report No. GR—70—98—011, June 1998, at http://www.usdoj.gov/oig/grants/g7098011.htm (May 16, 2006).
———. "Office of Community Oriented Policing Services Grants to the Boston, Massachusetts Police Department." Executive summary. Audit Report No. GR—70—98—017, September 1998, at http://www.usdoj.gov/oig/grants/g7098017.htm (May 16, 2006).
———. "Office of Community Oriented Policing Services Grants to the Charlotte—Mecklenburg, North Carolina Police Department." Executive summary. Audit Report No. GR—40—98—029, September 1998, at http://www.usdoj.gov/oig/grants/g4098029.htm (May 16, 2006).
———. "Office of Community Oriented Policing Services Grants to the City of Columbus Police Department, Columbus, Ohio." Executive summary. Audit Report No. GR—50—98—025, September 1998, at http://www.usdoj.gov/oig/grants/g5098025.htm (May 16, 2006).
———. "Office of Community Oriented Policing Services Grants to the Cleveland, Ohio Police Department." Executive summary. Audit Report No. GR—50—98—033, September 1998, at http://www.usdoj.gov/oig/grants/g5098033.htm (May 16, 2006).
———. "Office of Community Oriented Policing Services Grants to the Fort Worth, Texas Police Department." Executive summary. Audit Report No. GR—80—98—040, September 1998, at http://www.usdoj.gov/oig/grants/g8098040.htm (May 16, 2006).
———. "Office of Community Oriented Policing Services Grants to the City of Phoenix Police Department, Arizona." Executive summary. Audit Report No. GR—90—99—003, October 1998, at http://www.usdoj.gov/oig/grants/g9099003.htm (May 16, 2006).
———. "Office of Community Oriented Policing Services Grants to the City of Seattle Police Department, Washington." Executive summary. Audit Report No. GR—90—99—009, December 1998, at http://www.usdoj.gov/oig/grants/g9099009.htm (May 16, 2006).
———. “Office of Community Oriented Policing Services Grants to the Tulsa, Oklahoma, Police Department.” Executive summary. Audit Report No. GR–80–99–008, March 16, 1999, at http://www.usdoj.gov/oig/grants/g8099008.htm (May 18, 2006).
———. “Office of Community Oriented Policing Services Grants to the San Diego Police Department California.” Executive summary. Audit Report No. GR–90–99–016, May 1999, at http://www.usdoj.gov/oig/grants/g9099016.htm (May 18, 2006).
———. “Office of Community Oriented Policing Services Grants to the San Antonio, Texas, Police Department.” Executive summary. Audit Report No. GR–80–99–013, May 21, 1999, http://www.usdoj.gov/oig/grants/g8099013.htm (May 18, 2006).
———. “Office of Community Oriented Policing Services Grants to the Arlington, Texas, Police Department.” Executive summary. Audit Report No. GR–80–99–012, April 30, 1999, at http://www.usdoj.gov/oig/grants/g8099012.htm (May 18, 2006).
———. “Office of Community Oriented Policing Services Grants to the Portland Police Bureau, Oregon.” Executive summary. Audit Report No. GR–90–00–005, October 1999, at http://www.usdoj.gov/oig/grants/g9000005.htm (May 16, 2006).
———. “Office of Community Oriented Policing Services Grants to the City of Dallas, Texas, Police Department.” Executive summary. Audit Report No. GR–80–00–003, November 1999, at http://www.usdoj.gov/oig/grants/g8000003.htm (May 16, 2006).
———. “Office of Community Oriented Policing Services Grants to the Omaha, Nebraska Police Department.” Executive summary. Audit Report No. GR–50–00–009, January 2000, at http://www.usdoj.gov/oig/grants/g5000009.htm (May 16, 2006).
———. “Office of Community Oriented Policing Services Grants to the Jacksonville, Florida, Sheriff’s Department.” Executive summary. Audit Report No. GR–50–00–024, February 2000, at http://www.usdoj.gov/oig/grants/g5000024.htm (May 16, 2006).
———. “Office of Community Oriented Policing Services Grants to the Milwaukee, Wisconsin Police Department.” Executive summary. Audit Report No. GR–50–98–033, August 2000, at http://www.usdoj.gov/oig/grants/g5098033.htm (May 16, 2006).
———. “Office of Community Oriented Policing Services Grants to the Metropolitan Police Department, District of Columbia.” Executive summary. Audit Report No. GR–30–01–003, December 29, 2000, at http://www.usdoj.gov/oig/grants/g3001003.htm (May 16, 2006).
———. “Office of Community Oriented Policing Services Grants to the Louisville, Kentucky Police Department.” Executive summary. Audit Report No. GR–40–01–002, February 2001, at http://www.usdoj.gov/oig/grants/g4001002.htm (May 16, 2006).
———. “Office of Community Oriented Policing Services Grants to the El Paso Police Department, El Paso, Texas.” Executive summary. Audit Report No. GR–80–01–013, May 30, 2001, at http://www.usdoj.gov/oig/grants/g8001013.htm (May 16, 2006).
———. “Office of Community Oriented Policing Services Grants to the Austin, Texas, Police Department.” Executive summary. Audit Report No. GR–80–01–015, July 13, 2001, at http://www.usdoj.gov/oig/grants/g8001015.htm (May 16, 2006).
———. “Office of Community Oriented Policing Services Grants to the Albuquerque Police Department, Albuquerque, New Mexico.” Executive summary. Audit Report No. GR–90– 99–016, December 2002, at http://www.usdoj.gov/oig/grants/
g9099016.htm (May 16, 2006).
———. “Office of Community Oriented Policing Services Grants to the Honolulu Police Department, Honolulu, Hawaii.” Executive summary. Audit Report No. GR–80–03–001, February 2003, at http://www.usdoj.gov/oig/grants/g8003001.htm (May 16, 2006).
———. “Police Hiring and Redeployment Grants: Summary of Audit Findings and Recommendations, October 1996–September 1998.” Special Report No. 99–14, at http://permanent.access.gpo.gov/lps9890/lps9890/ http://www.usdoj.gov/oig/au9914/9914toc.htm (May 18, 2006).
U.S. Department of Labor, Bureau of Labor Statistics. Local Area Unemployment Statistics (LAUS) program, at http://www.bls.gov/lau (May 19, 2003).
U.S. General Accounting Office. Community Policing: Issues Related to the Design, Operation, and Management of the Grant Program. GAO/GGD– 97–167. September 1997, at http://www.gao.gov/archive/1997/gg97167.pdf (May 12, 2006).
U.S. Government Accountability Office. Community Policing Grants: COPS Grants Were a Modest Contributor to Declines in Crime in the 1990s. GAO–06–104. October 2005, at http://www.gao.gov/new.items/d06104.pdf (May 12, 2006).
White, H. “A Heteroskedasticity-Consistent Covariance Matrix Estimator and a Direct Test for Heteroskedasticity.” Econometrica, Vol. 48, Issue 4 (May 1980): pp. 817–838.
Wooldridge, Jeffery M. Introductory Econometrics: A Modern Approach. South-Western College Publishing, 2000.
Zhao, Jihong, Matthew Schieder, and Quint Thurman. “Funding Community Policing to Reduce Crime: Have COPS Grants Made a Difference?” Criminology and Public Policy, Vol. 2, No. 1 (November 2002): pp. 7–32.


