On December 14, the United States Conference of Mayors and Sodexho-USA released the results of their annual survey of hunger and homelessness in America. The mayors have released a similar report each year since 1986. The report measures "hunger" by the number of persons using food banks or soup kitchens. The Conference of Mayors has reported that the number of persons using food banks or soup kitchens in major cities has increased substantially in each of the past 18 years and not surprisingly, has claimed dramatic increases in hunger and homelessness during 2004.
The mayors' hunger reports, however, are vague. They do not give the number of persons using food banks or soup kitchens. Instead, they merely report the rate of increase in use compared to the prior year. The mayors' report finds that, overall, emergency food use increased by 14 percent during the past year and that 96 percent of cities registered an increase in emergency food assistance.
There are three reasons to believe that the mayors' claims of rapid and continuing increases in "hunger" or food bank use are inaccurate and exaggerated. Specifically, the mayors' data:
Reflect an implausible rate of growth. The mayors have reported that food bank/soup kitchen use has increased at an average rate of 16 percent per annum for the past decade and a half. The number of persons receiving emergency food aid appears nearly to double every four years or so.
According to the mayors' data, the number of persons receiving emergency food aid is 15 times higher today than in 1986. This seems implausible. The U.S. Department of Agriculture (USDA) reports that, at present, between 18 million and 24 million persons receive emergency food aid each year. If the mayors' data were accurate and representative of the nation, it would mean that fewer than 2 million persons received food aid in 1986 (one-fifteenth of the present number).
Are contradicted by U.S. Census Bureau surveys. Census data show a relatively small increase in the use of food pantries and soup kitchens in either central cities or the nation as a whole between 1995 and 2003. By contrast, the mayors' reports claim an increase in use of 150 percent during the same period.
Are contradicted by Second Harvest reports. The mayors' data are contradicted by detailed surveys conducted by Second Harvest, the major supplier to food banks. Second Harvest reports that emergency food use increased by 9 percent between 1997 and 2001. The mayors' reports claim that emergency food use increased by nearly 100 percent during the same period.
Overall, the mayors' annual reports show an implausible growth in food bank use throughout the past 18 years. Their data are contradicted by other more reliable surveys. One possible explanation is that the 27 major cities surveyed in the mayors' reports are very unrepresentative of the nation as a whole. This seems unlikely. It seems more likely that the mayors' survey methods, which rely on self reports of food bank operators and employ vague counting standards, are flawed and their conclusions inaccurate.
Conference of Mayors' Report
Each year, the U.S. Conference of Mayors releases A Status Report on Hunger and Homelessness in America's Cities that presents an estimate of housing and homeless data from the previous year in major U.S. cities.[1] Year after year, these documents consistently report that hunger and homelessness are "on the rise in major U.S. cities."[2]
The Conference of Mayors began to collect data on hunger and homelessness in 1983 and has been releasing these data in their current form since 1986. The most recent report, from 2004, co-released by Sodexho on December 14, 2004, is compiled from a survey of the 27 U.S. cities whose mayors were members of the Conference's Task Force on Hunger and Homelessness.[3]
To compile the report, the Conference distributes questionnaires to each city. These questionnaires ask for estimates of (1) the demand for emergency food assistance and emergency shelter and the capacity of local agencies to meet that demand, (2) the causes of hunger and homelessness and the demographics of the populations experiencing these problems, (3) exemplary programs of efforts in the cities to respond to hunger and homelessness, (4) the availability of affordable housing for low-income people, and (5) the outlook for the future and the impact of the economy on hunger and homelessness.
The 2004 report finds that requests for emergency food assistance-provided through a variety of resources including food banks, food pantries, and soup kitchens-increased by an average of 14 percent during 2004. Requests increased by an average of 13 percent among families with children and 12 percent among elderly persons. The report also claims that an estimated 20 percent of the requests for emergency food went unmet during 2004.[4]
Fifteenfold Increase in Food Bank Use
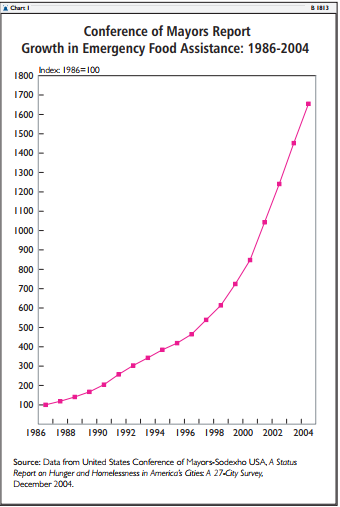
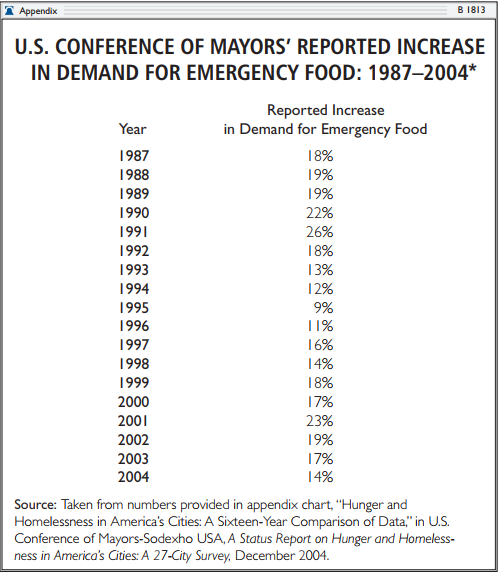
As noted above, the mayors' report does not give figures on the number of persons receiving emergency food aid. Instead, it simply reports the percentage of growth in emergency food use from year to year. Over the past 18 years, the mayors have reported that food bank use has grown at an average rate of 16 percent per year. (See the Appendix to this paper.) According to the mayors' reports, food bank use roughly doubles every four years.
When the mayors' annual growth figures are seen in aggregate, the picture is quite alarming. Chart 1 shows the growth in emergency food use from 1986 to 2004 according the mayors' data. [5] (Since the mayors' reports do not specify actual numbers of users, 1986 is set as the base year equaling 100.) If the mayors' figures are accurate, there were 15 times more people receiving food aid in 2004 than in 1986.
Mayors' Reports Contradicted by Census Surveys
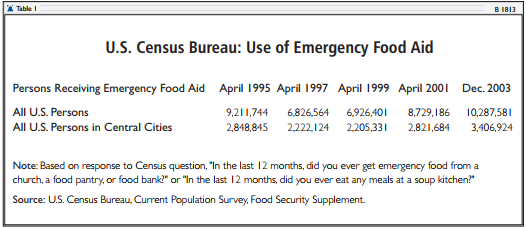
The United States Census Bureau also tracks utilization of food pantries, food banks, and soup kitchens in its annual Current Population Survey. In 1995, the Census Bureau began asking Americans two questions: "In the last 12 months, did you ever get emergency food from a church, a food pantry, or a food bank?" and "In the last 12 months, did you ever eat any meals at a soup kitchen?"[6] These questions were asked again in 1997, 1999, 2001, 2002 and 2003.
The results are shown in Table 1. In the nine-year period between 1995 and 2003, the Census survey showed that the number of persons using food pantries or soup kitchens increased somewhat from 9.2 million to 10.3 million. The number of persons receiving emergency food in central cities increased from 2.8 million to 3.4 million.
It is important to note that the Census survey does appear to underreport the number of persons using emergency food each year to a significant extent. However, since the Census methodology is exactly the same each year, there is no reason to believe that the undercounting would have increased or decreased between 1995 and 2003. Thus, while the absolute numbers of persons reported to receive emergency food in Table 1 may be too low, the trend (increase or decrease) over time reported by the Census Bureau is likely to be fairly accurate.
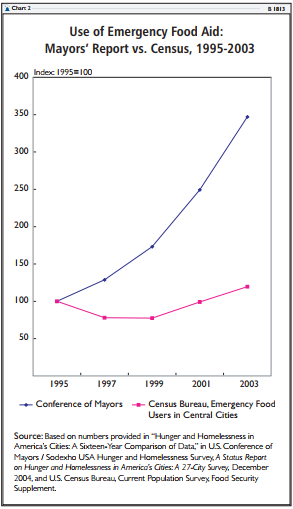
As Chart 2 shows, the trend reported by the Conference of Mayors over the same period is radically different. While the Census shows about a 12 percent growth in emergency food use between 1995 and 2003, the mayors' reports show that emergency food use in major cities increased 150 percent.
Mayors' Reports Contradicted by Second Harvest Surveys
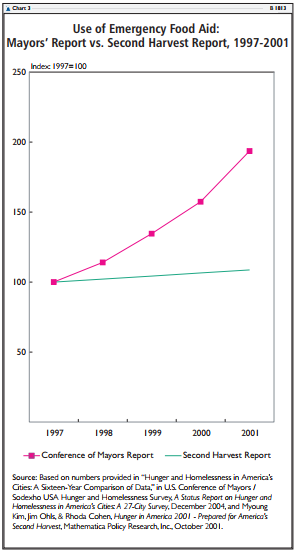
America's Second Harvest, which is the largest food distributor in the nation, consisting of a network of nearly 200 banks, also provides data on the incidence of hunger and food insecurity in the United States. In its Hunger 1997: The Facts and Faces report, Second Harvest estimated that 21.4 million people sought emergency food assistance from a food pantry, food kitchen, or shelter at least once during 1997.[7] In the next version of the report, Hunger in America 2001, Second Harvest reported that 23.3 million clients sought emergency food assistance at least once during 2001.[8] Thus, the two Second Harvest surveys show a 9 percent increase in emergency food use in the four years between 1997 and 2001.
By contrast, the mayors' hunger reports show that emergency food use increased by almost 100 percent during the same time period between 1997 and 2001. This rate of increase is 10 times greater than that shown by Second Harvest. If the mayors' growth figures were accurate and representative of the nation, the number of persons receiving emergency food aid would have grown from 21.4 million in 1997 (as reported by Second Harvest) to around 40 million in 2001. That figure would be 17 million higher than the figure reported by Second Harvest for 2001.
Potential Problems in Conference of Mayors' Methodology
The U.S. Conference of Mayors report may not provide an accurate or complete understanding of the utilization of food pantries and food banks for several reasons. First, the data are compiled based on surveys of city officials, with very minimal apparent documentation requirements. City officials in the 27 surveyed cities are asked to report changes in demand at emergency food providers and city services by reporting whether the demand for emergency food assistance has increased, decreased, or stayed the same, and by what percentage. Respondents are simply encouraged to "include any other data which supports it."[9]
Another reason that the mayors' survey may overcount the growth of emergency food use may be that it fails to account properly for the food pantries that close down. According to USDA estimates, approximately 20 percent of emergency food providers go out of business each year.[10] But new providers often open to replace those that close.
Scrupulous accounting of the food banks that close is necessary for an accurate assessment of changes in emergency food use. If a surveyor reports only increases in food delivery in newly opened and continuing food banks but fails to account fully for banks that ceased operation, the result will be a considerable overcount in the growth rate of emergency food use. Since the mayors' report provides only the sketchiest account of how its numbers are collected, it is impossible to determine to what extent this problem may contribute to the mayors' very rapid growth figures.
How Many People Use Food Banks?
In 2001, to determine the number of persons using food banks and soup kitchens in the United States, the USDA conducted the National Emergency Food Assistance System Client Survey. On the basis of that survey, the USDA estimates that 4.3 million persons are served by food pantries in a given week.
Using these figures, in addition to the number of times a person reports visiting a food pantry during a given month, the USDA estimates that 12.5 million people are served by a food pantry in a given month and that between 18 million and 24 million persons are served at least once during the course of a year. These figures are generally consistent with the estimate made by America's Second Harvest of 23.3 million people seeking emergency food assistance from a food bank, pantry, or kitchen at least once during 2001.
About three-quarters of the individuals receiving emergency food say they prefer getting free food from a pantry, as opposed to using government aid such as food stamps.[11] Roughly three-quarters of the households using food pantries have no employed members.[12]
Is Hunger Widespread?
How many people in the United States experience hunger? The best answer to that question is provided by the Household Food Security Survey, conducted by the U.S. Department of Agriculture each year since 1995. The USDA defines hunger not as the use of food pantries, but as physical discomfort caused by actual food shortages due to a lack of funds to obtain food. The USDA makes clear that hunger is not the same as malnutrition and that most hunger experienced in the United States is short-term.[13]
According to the USDA, on a typical day, less than one American in 200 will experience hunger due to a lack of money to buy food.[14] The hunger rate rises somewhat when examined over a longer time period; according to the USDA, some 7.0 million Americans (2.4 percent of the population) were hungry at least once during 2003.[15] Nearly all hunger is short-term and episodic rather than continuous.
Some 92 percent of those who experienced hunger in 2003 were adults, and only 8 percent were children. Overall, some 462,000 children (or 0.6 percent of all children) were hungry at some point in 2003.[16] In a typical month, roughly one child in 400 skipped one or more meals because the family lacked funds to buy food.
Has Hunger Increased?
According to the USDA, overall hunger has declined slightly since measurement began in 1995. In that year, 4.1 million households had at least one person who experienced hunger at some point during the year. By 2003, the number had fallen to 3.9 million households.[17]
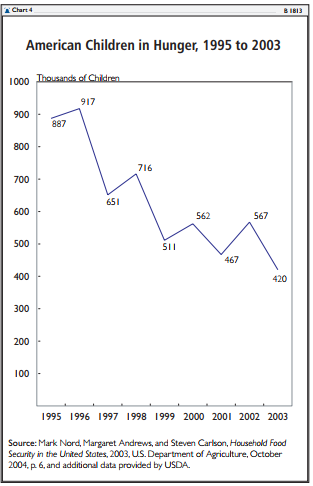
Hunger among children, however, has declined substantially since the mid-1990s. As Chart 4 shows, the number of hungry children was cut in half between 1995 and 2003. According to the USDA, in 1995, there were 887,000 hungry children; by 2003, the number had fallen to 420,000.[18] Put another way, the USDA classifies only 0.6 percent of children as hungry.
What About Food Insecurity Without Hunger?
The USDA also reports on the number of households that are "food insecure without hunger." Advocacy groups often label these families as "at risk" of hunger, although the USDA explicitly states that these households are not hungry and do not face food shortages. These families do face financial constraints in purchasing food at some point or points during the year, and they report anxiety that, at some future time, they may not be able to buy sufficient food. They may temporarily substitute cheaper foods for regular items in their diet.
According to the USDA, 26.6 million individuals (or 9.3 percent of the population) were "food insecure without hunger" at some point during 2003. This condition is generally temporary. The number of persons who were food insecure without hunger was roughly the same between 1995 and 2003.[19]
Conclusion
Overall, some 97 percent of the U.S. population lives in households that reported they had "enough food to eat" during the entire year, although not always the kinds of foods they would prefer. Around 2.5 percent stated that their families "sometimes" did not have "enough to eat" due to money shortages, and one-half of 1 percent (0.5 percent) said they "often" did not have enough to eat due to lack of funds.[20]
According to the U.S. Department of Agriculture, the number of Americans who are "hungry" has changed little since measurement began in 1995. The number of hungry children, however, has declined substantially.
Policymakers should be wary of the claims of "increasing hunger" made again by the U.S. Conference of Mayors in its 2004 report. Year after year, the mayors' hunger report shows an alarming increase in use of food banks. The mayors have consistently reported that use of food banks in major cities has increased at an average rate of 16 percent per year for the past decade and a half. According to the mayors, food-bank use roughly doubles every four years.
The mayors' figures, however, seem implausible; they are contradicted by other more reliable surveys. The continuing broadcast of alarming but inaccurate figures can only distract from real problems facing the nation.
Melissa G. Pardue is Social Welfare Policy Analyst in Domestic Policy Studies, Robert Rector is Senior Research Fellow in Domestic Policy Studies, and Kirk A. Johnson, Ph.D., is Senior Policy Analyst in the Center for Data Analysis at The Heritage Foundation.
[1]United States Conference of Mayors-Sodexho USA, A Status Report on Hunger and Homelessness in America's Cities: A 27-City Survey, December 2004, at www.usmayors.org/uscm/hungersurvey/2004/onlinereport/
HungerAndHomelessnessReport2004.pdf.
[2]See U.S. Conference of Mayors press release, "Hunger, Homelessness Still on the Rise in Major U.S. Cities," December 14, 2004.
[3]The mayors of the 27 cities that participated in the 2004 survey are: Thomas Menino, Boston, Massachusetts; Peter Clavelle, Burlington, Vermont; Paul Pate, Cedar Rapids, Iowa; Joseph Riley, Charleston, South Carolina; Patrick McCrory, Charlotte, North Carolina; Richard M. Daley, Chicago, Illinois; Jane Campbell, Cleveland, Ohio; John Hickenlooper, Denver, Colorado; Kwame Kilpatrick, Detroit, Michigan; Kay Barnes, Kansas City, Missouri; James Hahn, Los Angeles, California; Jerry Abramson, Louisville Metro, Kentucky; Manuel Diaz, Miami, Florida; Bill Purcell, Nashville, Tennessee; Ray Nagin, New Orleans, Louisiana; Paul Fraim, Norfolk, Virginia; John Street, Philadelphia, Pennsylvania; Phil Gordon, Phoenix, Arizona; Vera Katz, Portland, Oregon; David Cicilline, Providence, Rhode Island; Randy Kelly, St. Paul, Minnesota; Rocky Anderson, Salt Lake City, Utah; Ed Garza, San Antonio, Texas; Gavin Newsom, San Francisco, California; Richard Bloom, Santa Monica, California; Greg Nickels, Seattle, Washington; and Doug Palmer, Trenton, New Jersey.
[4]U.S. Conference of Mayors-Sodexho USA, Hunger and Homelessness Survey: A Status Report on Hunger and Homelessness in America's Cities, A 27-City Survey, December 2004.
[5]Based on numbers provided in "Hunger and Homelessness in America's Cities: A Sixteen-Year Comparison of Data," in U.S. Conference of Mayors-Sodexho USA Hunger and Homelessness Survey, A Status Report on Hunger and Homelessness in America's Cities: A 27-City Survey, December 2004.
[6]The use of soup kitchens is far less frequent than use of food banks or pantries.
[7]America's Second Harvest, Hunger 1997: The Facts and Faces, p. 3.
[8]See Key Findings in America's Second Harvest, Hunger in America 2001.
[9]See copy of survey, which is included in U.S. Conference of Mayors-Sodexho USA, A Status Report on Hunger and Homlessness in America's Cities: A 27-City Survey, December 2004. The authors of this paper repeatedly attempted to contact the person at the Conference of Mayors who compiles the results of the survey to learn more about the methodology used to create the report, but calls were not returned.
[10]See U.S. Department of Agriculture, The Emergency Food Assistance System-Findings from the Client Survey, July 2003, p. 19.
[11]See ibid., Executive Summary, p. 6.
[12]Ibid., p.4.
[13]There is little or no evidence of poverty-induced malnutrition or undernutrition in the United States.
[14]In all cases, the figures concerning hunger in this paper refer to hunger caused by a lack of funds to buy food and do not include hunger caused by any other reason.
[15]Mark Nord, Margaret Andrews, and Steven Carlson, Household Food Security in the United States, 2003, U.S. Department of Agriculture, October 2004, p. 6. The numbers in the text were taken from Table 1 of the USDA publication. Many individuals reside in households where at least one family member but not all family members experienced hunger. This is particularly true among families with children where the adults are far more likely than the children to experience hunger. According to Table 1 of Mark Nord, Margaret Andrews, and Steven Carlson, Household Food Security in the United States, 2003, U.S. Department of Agriculture, October 2004, 9.6 million persons lived in households where at least one household member experienced hunger; however, not all of these persons experienced hunger themselves. The number of persons who experienced hunger individually was lower: 7.0 million people, including 6.6 million adults and 420,000 children.
[16]Ibid.
[17]See Household Food Security in the United States in 1995, Summary Report of the Food Security Measurement Project, U.S. Department of Agriculture, September 1997, p. 48. See also Household Food Security in the United States, 2003, Figure 2, p. 5.
[18]Nord, Andrews, and Carlson, Household Food Security in the United States, 2003, p. 6. Additional data provided by USDA.
[19]See ibid., Figure 2, p. 5, or trend chart at www.ers.usda.gov/Briefing/FoodSecurity/trends/.
[20]Calculated from USDA, Household Food Security in the United States, 2001 survey.


