INTRODUCTION
Next week the United States Census Bureau will release its annual report on "poverty" stating, as it has for many years, that there are some 31 million to 32 million poor Americans, a number greater than in 1965 when the War on Poverty began. Evidence mounts, however, that the Census Bureau's poverty report dramatically understates the living standards of low income Americans.
Here is a sample of facts that will not be mentioned in next week's poverty report.
* 38 percent of the persons whom the Census Bureau identifies as "poor" own their own homes with a median value of $39,200.
* 62 percent of "poor" households own a car; 14 percent own two or more cars.
* Nearly half of all "poor" households have air-conditioning; 31 percent have microwave ovens.
* Nationwide, some 22,000 "poor" households have heated swimming pools or Jacuzzis.
"Poor" Americans today are better housed, better fed, and own more property than did the average U.S. citizen throughout much of the 20th Century. In 1988, the per capita expenditures of the lowest income fifth of the U.S. population exceeded the per capita expenditures of the median American household in 1955, after adjusting for inflation.1
Better Off Than Europeans, Japanese
The average "poor" American lives in a larger house or apartment than does the average West European (This is the average West European, not poor West Europeans). Poor Americans eat far more meat, are more likely to own cars and dishwashers, and are more likely to have basic modern amenities such as indoor toilets than is the general West European population.
"Poor" Americans consume three times as much meat each year and are 40 percent more likely to own a car than the average Japanese. And the average Japanese is 22 times more likely to live without an indoor flush toilet than is a poor American.
The Census Bureau counts as "poor" anyone with "cash income" less than the official poverty threshold, which was $12,675 for a family of four in 1989. The Census completely disregards assets owned by the "poor," and does not even count much of what, in fact, is income. This is clear from the Census's own data: low income persons spend $1.94 for every $1.00 in "income" reported by the Census. If this is true, then the poor somehow are getting $0.94 in additional income above every $1.00 counted by the Census. Indeed, the gap between spending and the Census's count of the income of the "poor" has grown larger year by year till, now, the Census measurement of the income of poor persons no longer has any bearing on economic reality.
Ignoring Billions of Dollars
A key reason that the Census undercounts the financial resources of the "poor" is that, remarkably, it ignores nearly all welfare spending when calculating the "incomes" of persons in poverty. Thus, as far as the Bureau is concerned, billions of dollars in in-kind benefits to poor Americans have no effect on their incomes. Out of $184 billion in welfare spending, the Census counts only $27 billion as income for poor persons. The bulk of the welfare system, including entire programs that provide non-cash aid to the poor, like food stamps, public housing, and Medicaid, is completely ignored in the Census Bureau's calculations of the living standards of the "poor." The missing welfare spending that is excluded from the Census Bureau poverty reports comes to $158 billion, or over $11,120 for every "poor" U.S. household.
The Census Bureau's poverty reports should be replaced by a new survey that counts income and assets accurately. With accurate counting, the number of poor persons would be shown to be only a small fraction of the Census Bureau's current estimate of 31.8 million.
Behavioral Effects of Welfare
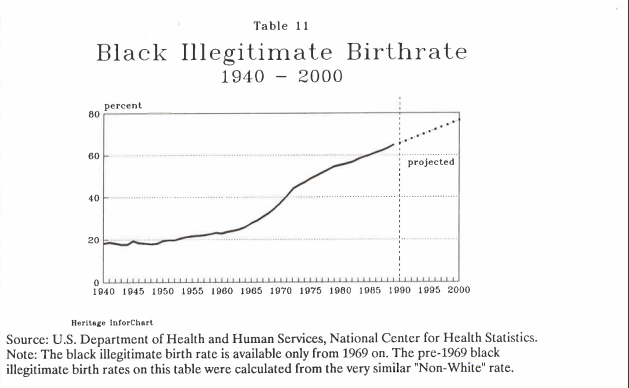
However, the fact that there are fewer Americans living in material poverty than the official Census poverty report indicates, does not mean that the War on Poverty has been a success. Welfare spending seriously diminishes work effort and earned income. The largest effect of increased welfare spending is not to raise income but merely to replace self- sufficiency with dependence. Welfare also undermines family structure. In 1965 the black illegitimate birth rate was 28 percent; today it is 64 percent. Properly measured, the number of persons in material poverty has shrunk since 1965, but at the unnecessary cost of producing a burgeoning underclass. The current welfare system has created entire communities where work is rare, intact families virtually unknown, and dependence on government a way of life passed on from generation to generation.
HOW THE CENSUS BUREAU UNDERSTATES INCOME
The most comprehensive survey of welfare spending is provided by the nonpartisan Congressional Research Service (CRS) of the Library of Congress. The CRS tracks state, local, and federal welfare spending in 75 "means-tested" programs, which are programs with benefits restricted to persons with low or limited income.2 The CRS figures include programs targeted to low income persons such as Aid to Families with Dependent Children (AFDC), food stamps, and public housing. By contrast, the CRS does not include programs available to the general population, such as Social Security.
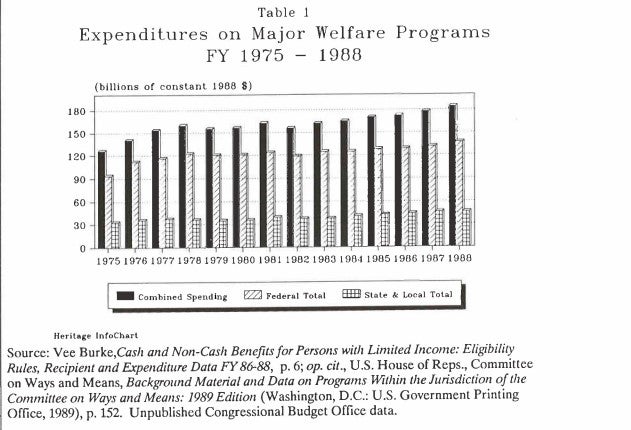
In fiscal 1988, the CRS recorded $173 billion in means-tested welfare spending at all levels of government.3 There was an additional $11.2 billion in Medicare spending on poor persons that year which was not included in the CRS total.4 The CRS means-tested figures plus Medicare benefits for poor persons yield a total welfare spending of $184.2 billion in 1988.
During the presidency of Ronald Reagan, Americans were inundated by media reports of draconian cuts in welfare spending. But, the CRS data show otherwise.5 Today, welfare spending is at an all-time high. Adjusted for inflation, welfare spending at the state, local, and federal levels rose consistently through the 1980s. As Table 1 shows, welfare spending in constant 1988 dollars rose from $156.6 billion in 1980 to $184.2 billion in 1988. The total comes to $5,790 for every poor person in the U.S., or $23,160 for a family of four.
The Missing Billions
The Census Bureau considers a household as "poor" if its income falls below a specified "poverty income threshold." In 1988 the poverty income threshold for a family of four was $12,675. That year, the Census Bureau estimates there were 33.3 million people who were poor before receiving welfare benefits; after receiving welfare benefits the number of poor persons fell to 31.9 million.6 In other words, according to the Census Bureau, $184 billion in welfare spending reduced the number of poor persons in the U.S. by only 1.4 million, or $131,570 in spending for each person lifted out of poverty. How is this possible?
The answer is simple: In counting the incomes of poor persons the Census Bureau actually excludes almost all welfare assistance. Some 75 percent of welfare spending in the U.S. is in the form of "non-cash" assistance. Yet the Census Bureau ignores all non-cash benefits in determining the income of poor persons. Non-cash programs such as food stamps, public housing, energy assistance, school lunch and breakfast programs, and the Women, Infants, and Children's (WIC) food program are excluded from the Census Bureau's poverty calculations entirely.
Thus, the Census Bureau counts most persons receiving non-cash welfare as poor even if the total value of the welfare assistance received greatly exceeds the poverty income thresholds.
Example: In 1988, many indigent elderly couples in New York state received income support from the Supplemental Security Income program and public housing assistance worth, on average, $12,290. These couples also received Medicaid benefits costing an average of $7,548. Despite the fact that they received welfare benefits with an average value of $19,838, compared to the official poverty income threshold in 1988 of $7,704 for elderly couples, the Census Bureau counted such elderly persons as "poor."7
Example: In Massachusetts in 1988 a welfare mother with three children could receive welfare benefits in the form of AFDC, food stamps, public housing, Medicaid, and school lunch and breakfast programs costing the taxpayers $18,765 per year. The poverty income threshold for such a family that year was $12,092. But the family would still be counted as poor by the Census Bureau.
Contradicting Itself
The misleading income figures used in the Census Bureau's annual poverty reports even contradict other Census data. Each year the Census Bureau undertakes a detailed survey of family expenditures to determine spending on rent, food, clothing, transportation, medical care, entertainment, and other items. While the Census Bureau poverty survey estimated that the average annual income of the poorest 20 percent of U.S. households in 1986 was $5,904, the Bureau's Consumer Expenditure Survey showed that these same households were spending an average of $11,477 that year. Thus the Census Bureau found that low income households spent $1.94 for every $1.00 of income reported in the Bureau's own income estimates. 8 A small part of this discrepancy might be explained by some retired or temporarily unemployed individuals spending their savings. But a major part is due to excluded welfare income.
Underestimating the Welfare State
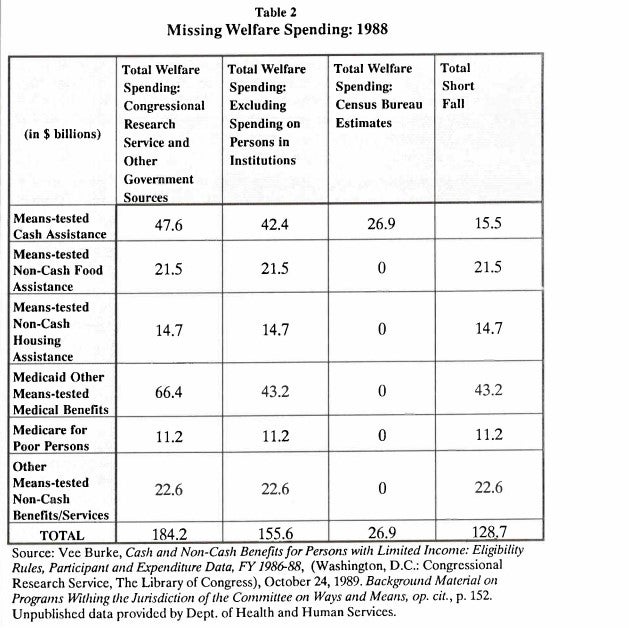
Table 2 analyzes the discrepancy between CRS and Census Bureau figures on welfare spending. According to CRS and other government sources, welfare spending was at least $184 billion in 1988. But the Census Bureau counted only $27 billion in welfare assistance when measuring household income. Part of this difference can be explained by welfare spending on persons in nursing homes and other institutions. These Americans are not included in the population surveyed by the Census in compiling its incomes and poverty data. Excluding welfare spending on persons in institutions, total welfare spending still equalled at least $155.6 billion, so the total funds "lost" by the Census Bureau poverty reports amounted to $128.7 billion in 1988.
Why the "Poor" Will Always Be With Us
The Census Bureau not only counts the number of poor persons in the U.S.; it also calculates the "poverty gap." This is the total amount of government assistance that would be needed to raise the income of all poor Americans up to the poverty income threshold. In 1986, the last year for which data are available, the poverty gap -- before persons received any welfare benefits -- was $64.9 billion. 9 After taking welfare benefits into consideration, the Census Bureau put the poverty gap at $48.8 billion.10 Thus, according to the Bureau, $126.2 billion spent on non-institutionalized persons in 1986 shrank the poverty gap by just $16.1 billion. Every $1.00 reduction in poverty, in other words, required at least $7.80 in welfare spending.
Besides the exclusion of non-cash aid in measuring the impact of government assistance, two other factors help explain why enormous welfare spending appears to make such a small dent on poverty. First, up to 10 percent of all cash welfare spending is diverted to administrative costs. Second, the government distributes up to half of all welfare spending to persons who have low incomes but are not below the poverty line.
The implications of these figures are sobering. The total pre-welfare poverty gap in 1990 is approximately $70 billion. Given the Census Bureau's current methods of measuring income, if the government expanded the existing welfare system, which provides 75 percent of benefits in non- cash assistance and targets nearly half of all aid to non-poor persons, it would require a staggering $546 billion in welfare spending -- or 46 percent of the total federal budget -- to eliminate "poverty" in the U.S. As long as the Census Bureau continues to count poverty with its current methods, the U.S. inevitably will have a large number of "poor" persons every year for the foreseeable future.
EXAMINING "POVERTY" IN AMERICA
In addition to the serious deficiencies of the Census Bureau's measurement of income, the government's view of what constitutes "poverty" would be surprising to most Americans. Government data on the possessions of officially poor households starkly contradict the general public understanding of what it means to be "poor."
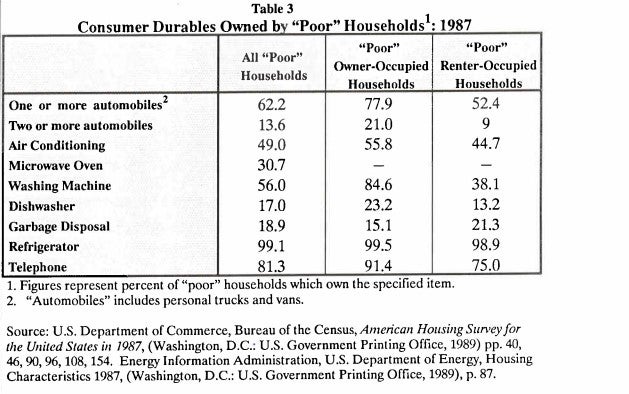
Example: Nearly a third of all "poor" American households have microwave ovens.11
Example: Sixty-two percent of "poor" households own a car, truck or van. Fourteen percent own two or more cars.12
Example: According to government figures, over 22,000 "poor" households have a heated swimming pool or a Jacuzzi.13
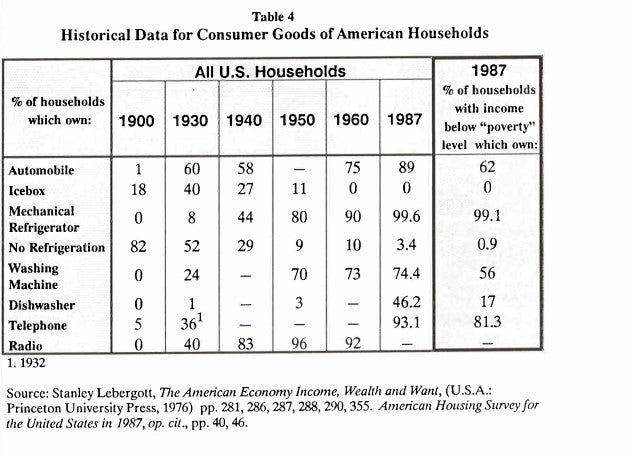
Today, officially "poor" households are more likely to own common consumer durables such as televisions and refrigerators than the average family in the 1950s. In 1930, nearly two-thirds of U.S. households did not own a radio; over half had no form of refrigeration. Among the poor today, less than one percent lack a refrigerator.14
Seventeen percent of U.S. households in "poverty" have automatic dishwashers, well above the rate for the general West European population in 1980.15 Among America's "poor" there are 344 cars per 1,000 persons.16 This is roughly the same ratio as exists for the total population of the United Kingdom. A poor American is 40 percent more likely to own a car than the average Japanese; 30 times more likely than the average Pole; and 50 times more likely than the average Mexican.17
Housing Conditions of the "Poor"
According to the 1987 U.S. Census Housing Survey, 38 percent of poor households own their own homes, with a median value of $39,205.18 Nearly 50 percent of officially poor households are air conditioned. 19
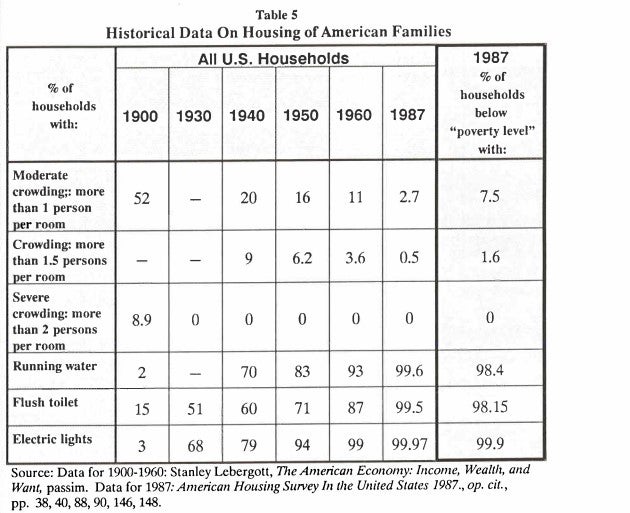
The homes of these households, whether owned or rented, also are on average quite spacious by historic or international standards. By American standards, "crowded" housing means more than 1.5 persons occupy each room. Less than 2 percent of "poor" U.S. households were "crowded" in 1987, according to this definition, and only 7.5 percent of poor households had more than one person per room.20
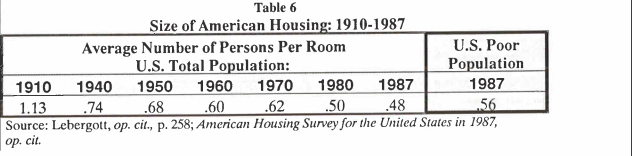
On average, officially poor U.S. households have 0.56 persons per room, which means they have more space than that available to the average American household in 1970, and the average West European household in 1980.21 By contrast, the average Japanese lives in a home with 0.8 persons per room, the average Mexican lives in a house with 2.5 persons in a room, while the average citizen of India lives in a house with 2.8 persons per room.22
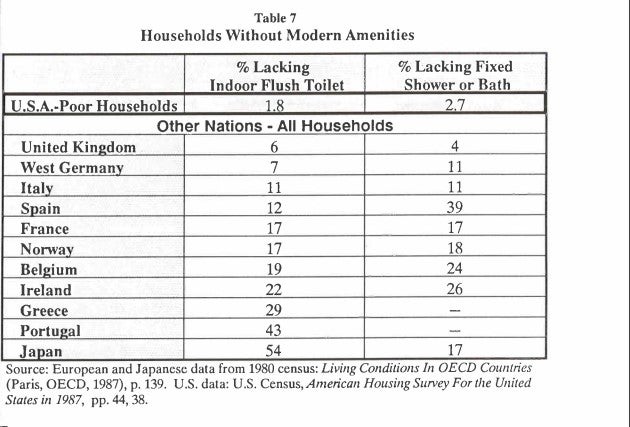
Nearly all officially poor U.S. households, moreover, are equipped with basic modern plumbing, including running hot and cold water, indoor flush toilets and indoor baths. While 30 percent of all Americans were without indoor toilets, in 1950, less than 2 percent of poor Americans lacked them by 1987.23 As Table 7 shows, America's poor are less likely to lack indoor plumbing than the general population in Western Europe. The average Japanese is 22 times more likely to lack an indoor toilet than is an American officially classified as "poor."
The houses and apartments of America's "poor" are in far better condition than generally assumed. The median age of such housing units is only seven years greater than the median age for the overall U.S. housing stock.24 The overwhelming majority of this housing is in sound condition. According to the 1987 American Housing Survey of the U.S. Census, only 2.4 percent of housing units owned or rented by households deemed "poor" had significant structural defects such as crumbling foundations or missing roof material.25 Some 9 percent of poor households reported being uncomfortably cold at least once during the previous winter due to inadequate insulation, inadequate heating capacity, or equipment failure.26 This was roughly double the rate for the general population.
Food Consumption Of Low Income Americans
On a per capita basis, low income households in 1988 spent 80 cents on food for every $1.00 spent by the median American household.27 And out of every food dollar spent by low income persons, 32 cents was spent in restaurants.28
Surveys conducted by the Department of Agriculture show relatively little difference in overall food consumption between high and low income households. Though the food purchased by low income households normally
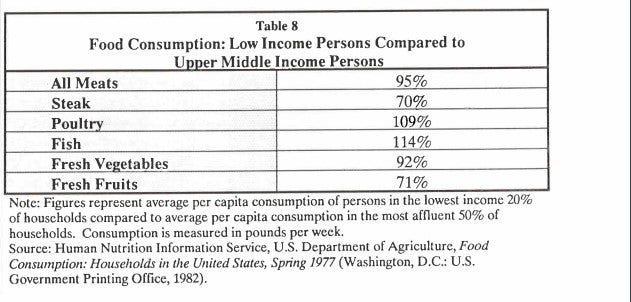
is of lower quality and less expensive than that consumed by the upper middle class, there is little evidence of material shortages. For instance, the average low income person eats 95 percent as much meat as the average person in the upper middle class. Measured in pounds of food consumed per week, low income persons actually consume 114 percent as much poultry, 109 percent as much fish and 92 percent of the fresh vegetables consumed by the upper middle class.
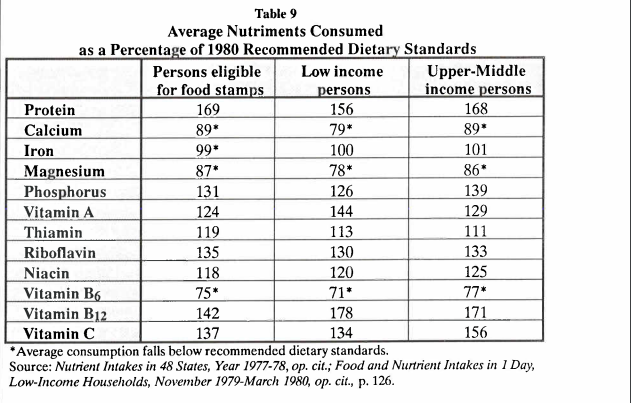
Table 9, derived from studies conducted by the Nutrition Information Service of the U.S. Department of Agriculture, shows the average nutritional status of persons from three income groups:
- Low income persons, from the least affluent 20 percent of the population.
- Persons receiving food stamps, and those whose income is low enough to be eligible for food stamps but who did not actually receive them.
- Upper middle class persons from the most affluent half of the population.
The table compares average food consumption in each of the three income groups to USDA recommended nutritional standards. For all three groups food consumption exceeds the standards in almost every nutritional category. Differences between the upper middle class and poor in almost all cases are quite modest.
Food Consumption of Poor Children
Many advocates have expressed concern about malnutrition caused by poverty among young children. In 1985 the Department of Agriculture conducted a thorough study of the food consumption and nutritional status of pre-school children. This study showed very little difference in the nutritional content of food consumed by low income as compared to affluent Americans. Children from families with incomes below 75 percent of the poverty level consumed 54.4 grams of protein per day compared to 53.6 grams for children in families with incomes above 300 percent of poverty (roughly $33,000 for a family of four in 1985).29 Black pre-school children consumed 56.9 grams of protein per day compared to 52.4 grams for white children.30 Surprisingly, protein and calorie consumption was slightly higher among children in the central cities than in the suburbs.31
Average consumption of nutrients was very high for pre-school children of all income classes. Protein consumption among children living in families with incomes below 75 percent of the poverty level equalled 211 percent of recommended USDA standards.32 Consumption of essential vitamins and minerals among both high income and poor children generally exceeded USDA standards, often by as much as 50 to 100 percent. Shortfalls were found in the average consumption of iron and zinc, but these were unrelated to income class or race.33
International Comparisons
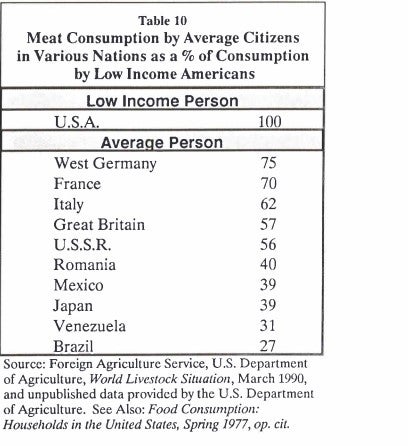
Rich and poor Americans typically eat rich diets in comparison to the rest of the world. The item most associated with an expensive diet is the level of meat consumption; as income increases, the level of meat consumption increases sharply. Table 10 compares the level of meat consumption of persons living in the 20 percent of American households with the lowest incomes, with the average citizen in various other countries. There is very little difference in meat consumption between high and low income Americans, but the differences between poor Americans and the average population in the rest of the world are dramatic. Low income Americans eat 75 percent more meat than the average Briton and 61 percent more than the average Italian. In a nation allegedly afflicted with a "hunger crisis," low income Americans eat twice as much meat as the average Portuguese, and two and a half times as much meat as the average Mexican, and nearly four times as much meat as the average Brazilian.
Poverty and Malnutrition
Malnutrition and hunger caused by poverty are virtually non- existent in the U.S. Protein and overall caloric intake are the most expensive factors of any diet. Nevertheless, in its extensive surveys the U.S. government has found no evidence of significant caloric or protein deficiencies among the poor.34 Indeed, being overweight is the number one dietary problem of both rich and poor Americans.35
Poor persons have lower levels of serum cholesterol than non-poor persons of the same age, sex, and race.36 Moderate deficiencies of certain vitamins and minerals such as vitamin B6 and zinc occur in part of the U.S. population but are unrelated to income class.37 Moderate calcium and iron deficiencies do occur more frequently among poor women than non- poor women. But such deficiencies normally are the result of the type of food consumed rather than the amount of money spent on food; simply raising the income of poor women would have little bearing on the problem. A more efficient response would be to distribute inexpensive vitamin and mineral supplements to adult female recipients of food stamps and WIC assistance.
CREATING A NEW POVERTY REPORT
The Census Bureau's annual estimate of poverty does not provide useful information about the standard of living of low income Americans or the impact of antipoverty programs. The current poverty report should be abolished and replaced with a new report based on the following methodology:
- The economic well-being of American households would be measured using a detailed survey of household expenditures, not the deficient "income" survey currently used.
- For those households receiving government non-cash assistance, such as energy assistance or public housing, the Census Bureau would determine the full cost of the subsidy provided. Special care would need to be taken to ensure that the number of Americans receiving such programs was properly counted. The value of medical benefits would be determined by what is generally termed the "insurance value": the average cost of the benefits received by individuals of a similar age and gender.
- The survey would determine home ownership, housing quality, and other household assets. If assets exceeded a certain level -- say $15,000 -- the household would not be defined as poor.
- Any household where expenditures plus the cost of additional government benefits did not exceed the current poverty income threshold, and which did not have assets above the fixed asset limit, would be counted as poor.38
More Accurate PictureSuch a survey could be conducted readily by expanding the existing Consumer Expenditure Survey undertaken by the Census Bureau each year.39 The new survey would provide a far more accurate picture of the economic conditions of poor households than the current Census poverty reports. It would also give far more useful information about the specific financial needs of poor families, such as whether they lack sufficient funds for medical care, food, or housing. Such a reformed survey still would show that there are poor households in America. But by including all cash and in-kind income, and making proper allowances for assets, the number would be a small fraction of the 31.9 million poor persons estimated by the Census in recent years.
WAS THE WAR ON POVERTY A SUCCESS?
About half of today's official "poor" actually are elderly Americans with assets, working families who have suffered a temporary job loss or a divorce, or self-employed persons hiding income from the government. Few of these households are poor by any normal standard, especially when assets and non-cash benefits are counted.
The other half of the officially poor population consists of what might be called the traditional poor: welfare families and individuals and family heads with chronic underemployment. The material living conditions of this group are far better than the Census Bureau poverty reports suggest. Many have income and benefits putting them well above the poverty thresholds. However, it would be a mistake to conclude from this that the War on Poverty has been a success. On the contrary, these households, intended to be the primary beneficiaries of the welfare state, have turned out to be its victims.
The explosion of welfare spending in the last 25 years may, possibly, have raised the material living standards of some less affluent Americans, but it has done so at an enormous cost in terms of destroyed families, an eroded work ethic, and possibly irreparable damage to the social and moral fabric of low income communities.
Welfare Dependence
The strongest effect of welfare is to diminish work effort, reducing earned income and thus making families more dependent on welfare. In the mid-1970s the U.S. Department of Health Education and Welfare undertook the most extensive and thorough controlled experiment on the behavioral consequences of welfare ever attempted in the United States: the Seattle/Denver Income Maintenance Experiment, known as "SIME/DIME," involving nearly 5,000 families over seven years. The SIME/DIME experiment showed that every $1.00 of welfare given to low income persons reduced labor and earnings by 80 cents.40 In other words, while welfare is very ineffective in raising the incomes of the poor, it is very effective in replacing work with dependence. Recent national data show that among the poorest 20 percent of U.S. households there is only one full-time worker for every seven full-time workers in the most affluent 20 percent of households.41
Tragically, the system designed to alleviate poverty in large part has been responsible for destroying the work ethic in low-income neighborhoods. There has been an enormous growth in the number of non-working poor families since the advent of the "War on Poverty." In the 1950s, nearly one-third of poor families as defined by the Census Bureau were headed by adults who worked full-time throughout the year. In those days the problem was low earnings. In 1988, only 16.4 percent of poor families had full-time working heads of households.42 Today, the problem is that adults do not work.
Destroying Families
A second major consequence of welfare is the destruction of families. The black illegitimate birth rate was 25 percent in 1963 when the War on Poverty began. Today it is 64 percent. If current trends continue it will reach 75 percent within ten years. Recent research by Shelley Lundberg and Robert D. Plotnick of the University of Washington shows that an increase of roughly $200 per month in welfare benefits per family causes the teenage illegitimate birth rate in a state to increase by 150 percent.43 According to the Census Bureau, a single parent family is six times more likely than an intact married couple family to be officially poor.44 To a considerable extent, the welfare state is generating poverty in the United States.
The impact of welfare dependency also seems to spread from one generation to the next. Children born into welfare normally remain in the system for many years. Of the 3.8 million families currently on AFDC, well over half will remain on welfare for over ten years; many for fifteen or more years.45 Research shows that, holding demographic and income variables constant, being raised in a welfare family has serious negative effects on the behavior of young adults and their life prospects, as indicated by factors such as high school graduation, employment, criminal activity, and drug use.46 And June
O'Neill, Director of the Center for the Study of Business and Government at Baruch College, City University New York, has found that after adjusting for racial and socio-economic differences, young women from AFDC families are three times more likely to receive AFDC themselves, as mothers.47
Material Poverty Versus Behavioral Poverty
In the late 1920s the median household income in the U.S. was around $1,600. After adjusting family incomes for inflation, over half of the families in this period would be considered "poor" using current official standards.48 Indeed, nearly all adult Americans living today had a parent or grandparent who was "poor" according to the Census Bureau definition adjusted for inflation. Yet despite their low material standard of living, most of these individuals from earlier generations were not "poor" in a meaningful sense. Their behavior and values were middle class.
But many of today's poor, while having a material standard of living above average Americans in an earlier period, are in another more important sense, very poor. They are trapped in "behavioral poverty": a vicious cycle of illegitimacy, destroyed families, absent work ethic, crime, drug addiction, and welfare dependency. Senator Daniel Moynihan, the New York Democrat, has stated that "in many if not most of our major cities we are facing something like social regression."49 The welfare state, while transferring enormous financial resources to these lower income Americans, adds to this "behavioral poverty," rather than relieving it. And the Census poverty reports, by exaggerating poverty in the U.S. and thereby stimulating even greater welfare spending, in a real sense has added to the misery of these households.
CONCLUSION
It seems incredible to most Americans that so much can be spent combatting poverty and yet millions of households remain poor. They are right to be incredulous. The fact is that the annual Census Bureau poverty reports vastly overstate the number of American poor because in determining who is "poor" they ignore assets and dramatically undercount the incomes of low income households.
An accurate examination of the expenditures, food consumption, housing, and assets of so-called poor families shows that there are far fewer persons in poverty than the Census Bureau indicates.
The principal reason the Census Bureau undercounts the incomes of the poor is that it deliberately ignores the effects of nearly the entire welfare system. Programs such as food stamps, public housing and Medicaid simply are excluded from the Census Bureau poverty estimates. The total welfare spending ignored in this way amounts each year to about $128.7 billion.
New Underclass
Yet it would be a mistake to conclude that systematic errors by the Census Bureau mask success in the War on Poverty. Vast welfare spending designed to eliminate material poverty has in turn generated a new underclass, destroying the work ethic, family structure, and the social fabric of large segments of the U.S. population. Most material poverty has been replaced by a far deeper and more serious "behavioral poverty."
Census "Openness"
For most of this century the Soviet government conducted a "disinformation" campaign using government statistics to show that the living standards of Soviet citizens were far higher than they actually were. For thirty years the U.S. Census Bureau has, in effect, been conducting a disinformation campaign suggesting that the living standards of America's "poor" are far lower than, in reality, they are. It is time for "glasnost" at the Census Bureau.
Endnotes:
-
U.S. Department of Labor, Bureau of Labor Statistics, "Consumer Expenditures in 1988," USDL Press Release Number 90-96, February 26, 1990, Table 1. U.S. Department of Commerce, Bureau of the Census, Historical Statistics of the United States, Part I (Washington, D.C., U.S. Bureau of the Census), 1975, pp. 297 and 301.
-
Vee Burke, Cash and Non-cash Benefits for Persons with Limited Income: Eligibility Rules, Participant and Expenditure Data, FY 1986-88 (Washington, D.C., Congressional Research Service, The Library of Congress, October 24, 1989).
-
Ibid., p. 6.
-
Estimate of percent of total Medicare spending going to "poor" is based on Congressional Budget Office figures showing 12.8 percent of Medicare recipients are "poor."
-
Vee Burke, op. cit., p. 6.
-
U.S. Bureau of the Census, Money Income and Poverty Status in the United States: 1988, P-60, Number 166, p. 109.
-
Average Medicaid benefit values for elderly persons in New York, excluding persons in institutions, is provided in the U.S. Bureau of the Census, Technical Paper Number 58: Estimates of Poverty Including the Value of Non-Cash Benefits, 1987, (U.S. Government Printing Office, December 1988), p. 25. Supplemental Security Insurance benefits are provided by in the House of Representatives, Committee on Ways and Means "Green Book," 1989 edition, p. 683. Public Housing subsidies from unpublished data provided by the U.S. Department of Housing and Urban Development.
-
Bureau of Labor Statistics, U.S. Department of Labor, Consumer Expenditure Survey: Integrated Survey Data, 1984-86, Bulletin No. 2333 (Washington, D.C.: U.S. Government Printing Office, August 1989) p.6. U.S. Census Bureau, Measuring the Effect of Benefits and Taxes on Income and Poverty: 1986, P-60, No.164-RD-1, p.20.
-
U.S. Census Bureau, Measuring the Effects of Benefits and Taxes on Income and Poverty: 1986, op. cit., pp. 163, 183.
-
Ibid., pp. 158, 170.
-
U.S. Department of Energy, Energy Information Administration, Housing Characteristics 1987 (Washington, D.C.: Government Printing Office, 1989), p. 87.
-
American Housing Survey 1987, op. cit., p. 46.
-
Housing Characteristics 1987, op. cit., p. 87.
-
Lebergott, op. cit., p. 282. American Housing Survey 1987, op. cit., p. 40.
-
Organization for Economic Cooperation and Development, Living Conditions in OECD Countries (Paris, OECD, 1986) pp. 126-127.
-
American Housing Survey 1987, op. cit., pp. 46, 50.
-
Ibid., pp. 46, 50. U.S. Department of Commerce, Bureau of the Census, Statistical Abstract of the United States: 1989, Table 1418. Comparison based on cars per 1,000 persons.
-
Fifty-eight percent of "poor," owner-occupied households are non-elderly. Data from the U.S. Department of Commerce and the U.S. Department of Housing and Urban Development, American Housing Survey for the United States in 1987, Current Housing Reports H-150-87, pp. 34, 84, 114, and 304.
-
Ibid., p. 40.
-
Ibid., p. 38.
-
Living Conditions, op. cit.,, p. 133. U.S. average computed from American Housing Survey data, 1987.
-
United Nations, Compendium of Housing Statistics, 1983, pp. 251-261.
-
Stanley Lebergott, The American Economy: Income, Wealth and Want (U.S.A.: Princeton University Press, 1976) p. 272. American Housing Survey 1987, op. cit., p. 272.
-
American Housing Survey 1987, op. cit., p. 34.
-
Ibid., p. 36.
-
Ibid., p. 44.
-
Bureau of Labor Statistics, "Consumer Expenditures in 1988," USDL Press Release, Feb.26, 1990, No. 90-96, op. cit., pp.90-6. Throughout this paper the term "low-income" shall be used in reference to the one-fifth of households with the lowest income in a given year, usually termed the "Bottom Quintile." The term upper middle class shall refer to the most affluent 50 percent of households.
-
Ibid.
-
Human Nutrition Information Service, U.S. Department of Agriculture, Low Income Women 19-50 Years and Their Children 1-5 Years, 4 Days: 1985, CSF II Report 85-5, (Washington, D.C.:U.S. Department of Agriculture, 1988), p.50. Human Nutrition Information Service, U.S. Department of Agriculture, Women 19-50 Years and Their Children 1-5 Years, 4 Days:1985, CSF II Report No. 85-4, (Washington, D.C.:U.S. Department of Agriculture, 1987), p.42.
-
Women 19-50 Years and Their Children 1-5 Years, 4 Days:1985, op. cit., p.42.
-
Ibid.
-
Low Income Women 19-50 Years and Their Children 1-5 Years, 4 Days:1985, op.cit., p. 72.
-
Low Income Women 19-50 Years, op.cit., p.73. Women 19-50 Years, op.cit., p.65.
-
Life Sciences Research Office, Federation of American Societies for Experimental Biology, Nutrition Monitoring in The United States: An Update on Nutrition Monitoring, Report prepared for the U.S. Department of Agriculture and the U.S. Department of Health and Human Services, (Washington, D.C.:U.S. Government Printing Office, 1989), p.51.
-
Ibid., p. 73.
-
Ibid., p. II 72-47.
-
Ibid., p. II 136-142.
-
In some cases a household could have an income above the poverty threshold but expenditures below it. Under the proposed system such a household would not be counted as poor.
-
Technically, the proposed survey would incorporate elements for the Survey of Income and Program Participation, the American Housing Survey and the Consumer Expenditure Survey.
-
Gregory B. Christiansen and Walter E. Williams, "Welfare Family Cohesiveness and Out of Wedlock Births," in Joesph Peden and Fred Glahe, The American Family and the State (San Francisco: Pacific Institute for Public Policy Research, 1986), p. 398.
-
Robert Rector and Kate Walsh O'Beirne, "Dispelling the Myth of Income Inequaltiy," The Heritage Foundation, Backgrounder No. 710, June 6, 1989, p. 8.
-
Rector and O'Beirne, "Poverty and Plenty in America: Understanding Census Bureau Data," Executive Memorandum No. 253, October 18, 1989.
-
Shelley Lundberg and Robert D. Plotnick, "Adolescent Premarital Childbearing: Do Opportunity Costs Matter?", June 1990, a revised version of a paper presented at the May 1990 Population Association of America Conference in Toronto, Canada.
-
Rector and O'Beirne, op.cit. See also: Kate Walsh O'Beirne, "U.S. Income Data: Good Numbers Hiding Excellent News," The Heritage Foundation, Backgrounder No. 667, August 19, 1988, pp.4-5.
-
David Elwood, Targeting "Would-be" Long-term Recipients of AFDC (Washington, D.C.: U.S. Department of Health and Human Services, January 1986), p. 5.
-
Richard B. Freeman, "Who Escapes? The Relation of Churchgoing and Other Background Factors to the Socioeconomic Performance of Black Male Youths from Inner-City Poverty Tracks," pp. 357-377 and Robert Lerman, "Do Welfare Programs Affect the Schooling and Work Patterns of Young Black Men?", pp. 403-443. In Richard Freeman and Harry J. Holzer. The Black Youth Employment Crisis, 1986, University of Chicago Press.
-
M. Anne Hill and June O'Neill, Underclass Behaviors in the United States: Measurement and Analysis of Determinants, Center for the Study of Business and Government, March 1990.
-
Estimated from Historical Statistics, op. cit., pp. 300, 301. Income figures include self consumed food and fuel production by farm households.
-
Daniel Patrick Moynihan, "Toward a Post-Industrial Social Policy," The Public Interest, No. 96, Summer 1989, p. 24.


