During his two terms in office, President Barack Obama claimed that global warming is an urgent problem and implemented costly policies in an effort to mitigate climate change.[REF] This includes not only very public proposals like the Clean Power Plan and Paris Protocol, but also regulatory measures that are profound in their impact but less visible to the public. Chief among these are Environmental Protection Agency (EPA) estimates of the social cost of carbon (SCC); the social cost of methane (SCM); and the social cost of nitrous oxide (SCN2O), which have artificially inflated estimated benefits from energy and climate regulations.
The EPA defines these “social cost” metrics as the accumulated economic damages over the course of the next 300 years that are associated with the emission of one ton of the respective chemicals in any given year.[REF] A high cost for carbon dioxide, methane, or nitrous oxides emissions would make regulations limiting or reducing these emissions appear like a better investment and, conversely, activities that cause emissions to appear more harmful and less desirable.
Three statistical models are used by the EPA to estimate these metrics: the DICE (Dynamic Integrated Climate-Economy) model; the FUND (Climate Framework for Integrated Climate-Economy) model; and the PAGE (Policy Analysis of the Greenhouse Effect) model.[REF] [REF] In earlier research, we looked at both the DICE and the FUND models’ estimates of the social cost of carbon.[REF] In this study, we provide a close examination of the DICE model regarding the SCM and SCN2O.
As found in previous research, the DICE model is far too sensitive to assumptions to have the capacity to be able to provide meaningful or legitimate policy advice. The next EPA Administrator should therefore eliminate from the agency’s cost-benefit analysis of regulatory actions any use of estimates of the social cost of greenhouse gas emissions until such time as more accurate and reliable models of those costs can be developed.
The DICE Model and Its Shortcomings
William Nordhaus has developed various versions of his DICE model over the past two decades. The version used by the EPA employs five different scenarios regarding projections of economic growth, population growth, CO2 emissions, and other factors.
Through a series of equations representing economic and environmental activity as well as a damage function, the DICE model generates its estimates via Monte Carlo simulation. One of the primary inputs into the damage function is the projected rise in the sea level due to a variety of factors including melting of ice caps and thermal expansion from temperature increases.[REF] From this damage function, the SCM and SCN2O are estimated. The EPA has used the average value of these estimates as the primary point estimates of these “social costs.”[REF]
As with any model, however, the DICE model is dependent on a series of assumptions. These assumptions include a discount rate, a time horizon, and specification of an equilibrium climate sensitivity (ECS) distribution. In earlier research, we examined the DICE model by performing a sensitivity analysis with respect to changes in these assumptions. We concluded that the model is not a dependable tool for regulatory use regarding carbon dioxide.[REF] In this study, we take a closer look at the impact of the choice of ECS distributions in the DICE model’s estimates of SCM and SCN2O.
Assumptions Made in the DICE Model
Before looking at the impact of the ECS distribution, we first review a number of assumptions made in the DICE model as well as other statistical models used to estimate the SCM and SCN2O.
Discount Rate. Those of us who are alive today can take many actions that would be expected to provide benefits for those who will live decades or centuries from now. For example, we could pay down the national debt, increase investment in any number of industries, or simply save more in order to leave a larger bequest to our heirs.
The rationale for the EPA’s economic regulations that employ the DICE SCC estimates is that altering CO2, methane, and nitrous oxide emissions today is a form of investment that provides benefits in the future. As with any investment, however, the future benefits [REF]need to be compared to the value of alternative investments and not just to the plain dollar value of current costs. The tool for making that comparison is discounting, and the choice of discount rate is critical both to correctly comparing the costs and benefits of climate policy and to accurately estimating the SCC.
That discount rate should be one that reflects the best alternative return available, not the worst. As Cass Sunstein and David Weisbach have written, “If we are going to increase the amount we leave for the future, it is incumbent on us not to do [so] in a way that wastes resources.”[REF] Investment in firms listed on the New York Stock Exchange has returned earnings of nearly 7 percent per year (after accounting for inflation) over the past two centuries. After adjusting for the impact of corporate taxes, the social rate of return on the New York Stock Exchange rises to more than 7.5 percent.[REF] Though there is no guarantee that this rate of return will continue for centuries into the future, it is a reasonable benchmark.
In fact, the Office of Management and Budget (OMB) stipulates that a 7 percent discount rate be used as part of this type of cost-benefit analysis along with the 3 percent discount rate used by the EPA. Other discount rates can also be used when justified.[REF] Researchers at the EPA have ignored the OMB guidance and have estimated the SCM and SCN2O using only 2.5 percent, 3 percent, and 5 percent discount rates.[REF] To better assess the model’s sensitivity, we estimated these metrics using a 7 percent discount rate, as we did in our past analysis of both the DICE model and the FUND model.[REF]
Time Horizon. As noted, the DICE model attempts to forecast economic damages years into the future, but however interesting three-century forecasts may be in academia, they strain credibility when moving to the real world of policy implementation. It is difficult enough to forecast several decades, let alone centuries, into the future. In our previous research, we examined the impact of truncating the time horizon at a still-ambitious end year one and a half centuries from the present rather than the EPA’s chosen time frame of 300 years from now.[REF]
Equilibrium Climate Sensitivity. Global warming activists, including members of the Obama Administration, consistently argue that global warming is indisputably occurring and that the Earth is warming at catastrophic rates.[REF] Although a variety of studies in the peer-reviewed literature suggest that global warming is occurring, there is considerable uncertainty regarding the critical question: the magnitude of the warming, especially projected for three centuries.[REF]
Equilibrium climate sensitivity distributions quantify this uncertainty by providing a distribution of values of the Earth’s temperature changes in response to a doubling of carbon dioxide emissions. The DICE model utilizes an ECS distribution to simulate temperatures for future years. However, the EPA used an ECS distribution published by Gerard Roe and Marcia Baker in Science nearly a decade ago.[REF] A close look at this ECS distribution clearly suggests significantly higher probabilities of extreme global warming compared to more up-to-date distributions.
Table 1 contains the probabilities associated with the outdated 2007 Roe–Baker distribution as well as two more up-to-date distributions published by Alexander Otto et al. in 2013 and by Nicholas Lewis in 2013.[REF] 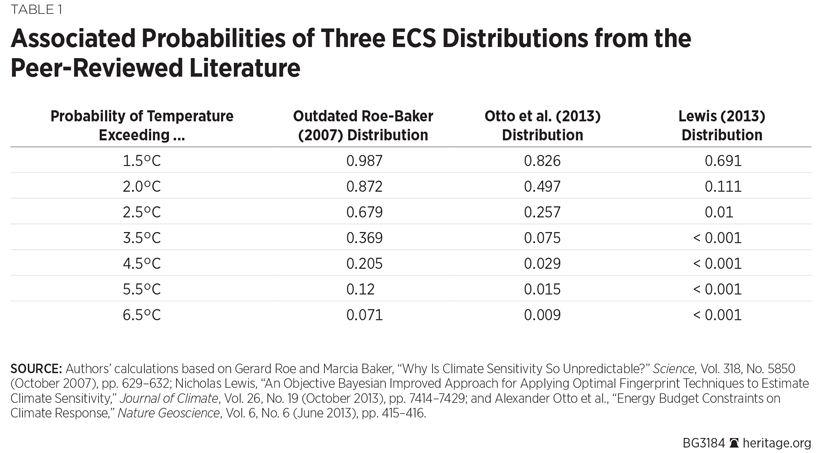
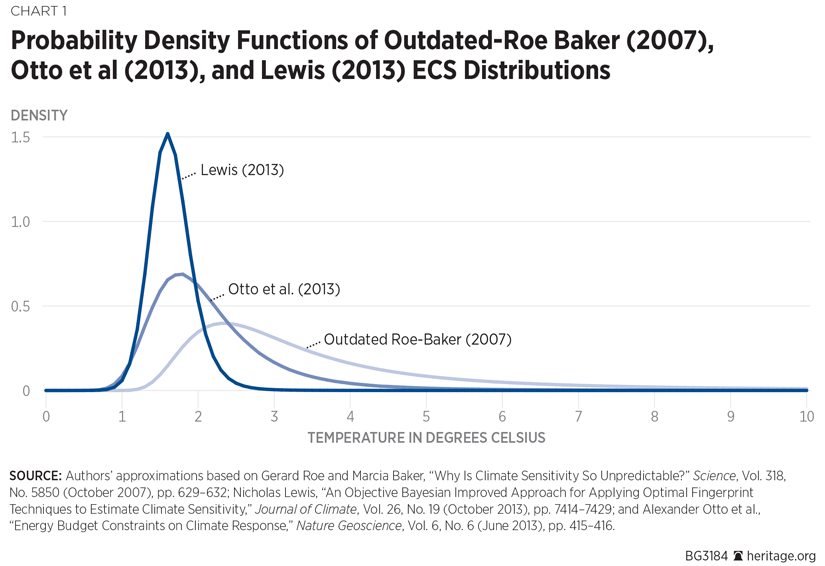
Chart 1 provides visual representations of these three ECS distributions. As Chart 1 illustrates, the outdated 2007 Roe–Baker distribution has a much fatter right-tail probability than the more up-to-date 2013 Otto et al. and Lewis distributions. As a result, the Roe–Baker probability distribution predicts a significantly higher probability of extreme global warming than the other two probability distributions suggest. In other words, the severity of global warming under the outdated Roe–Baker distribution used by the EPA is grossly overstated with respect to the other two distributions.
Just like the SCC, the SCM and SCN2O, as estimated by the EPA, are based on the evaluation of an arbitrarily chosen damage function of sea level rise and temperature change. Two of the primary causes behind sea level rise are thermal expansion, induced by warming of the oceans, and the melting of land-based ice. Since more up-to-date ECS distributions estimate lower probabilities of extreme global warming, it makes sense that the more recent distributions suggest lower sea level rise and therefore reduced SCC estimates. We examined the DICE model estimates of the SCM and SCN2O using more up-to-date ECS distributions as well as the 7 percent discount rates mandated by the OMB.
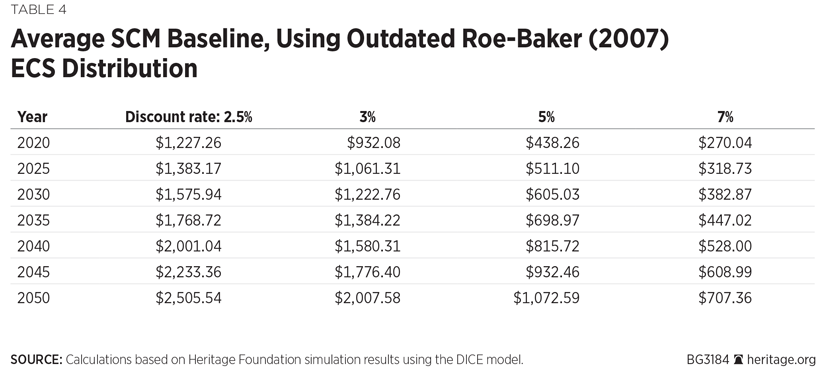
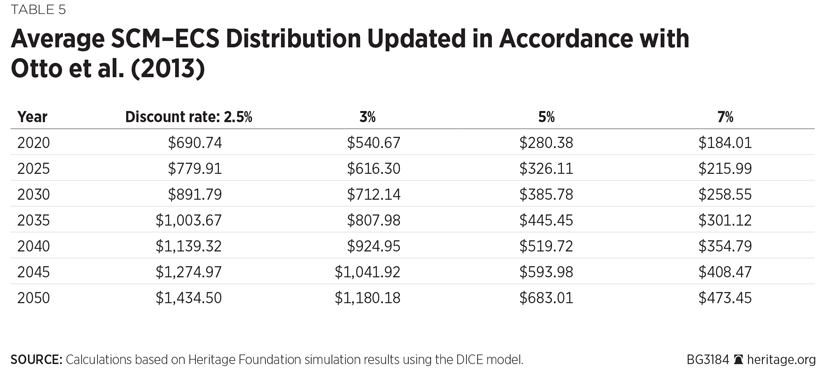
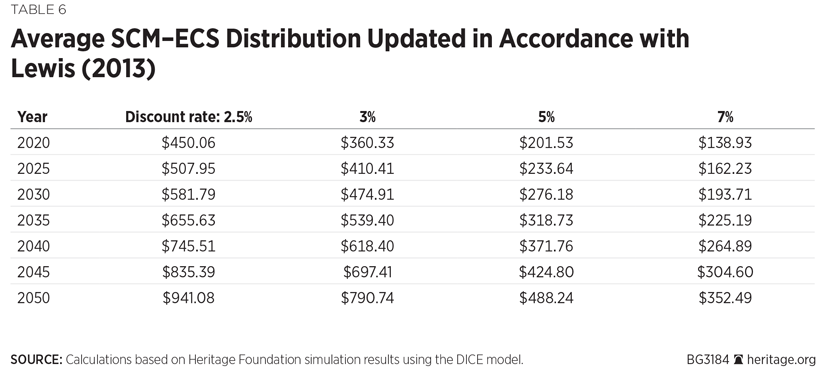
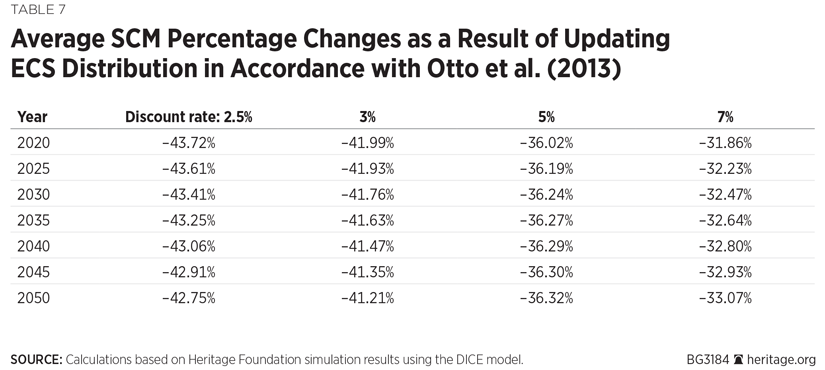
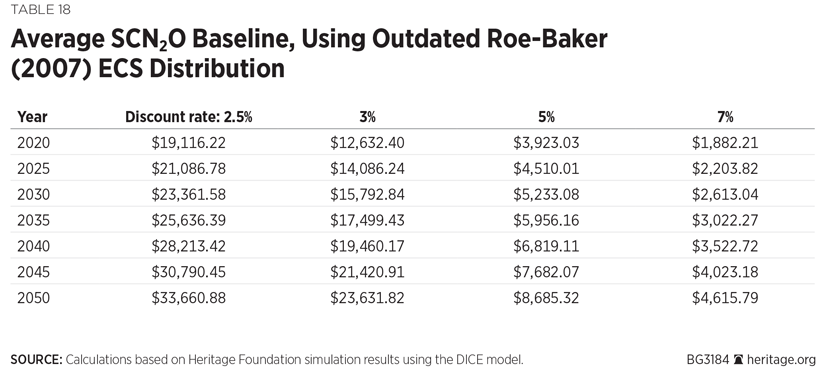
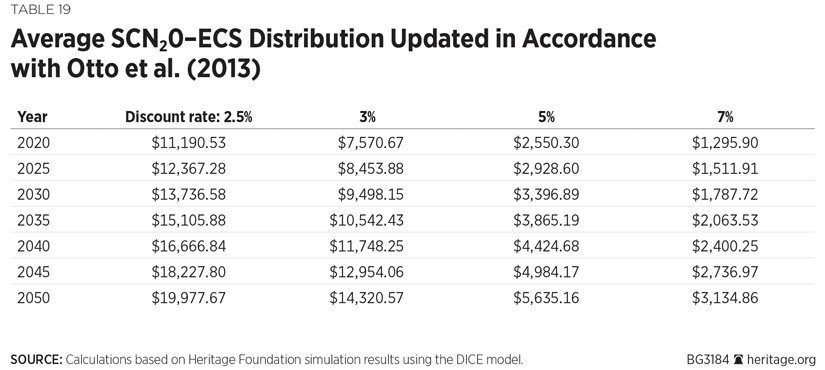
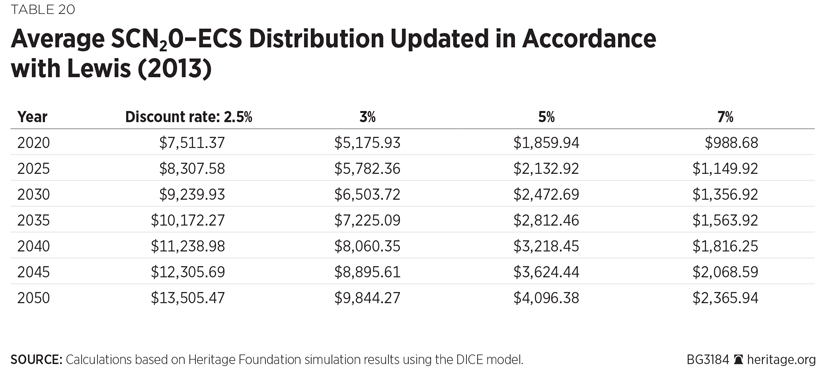
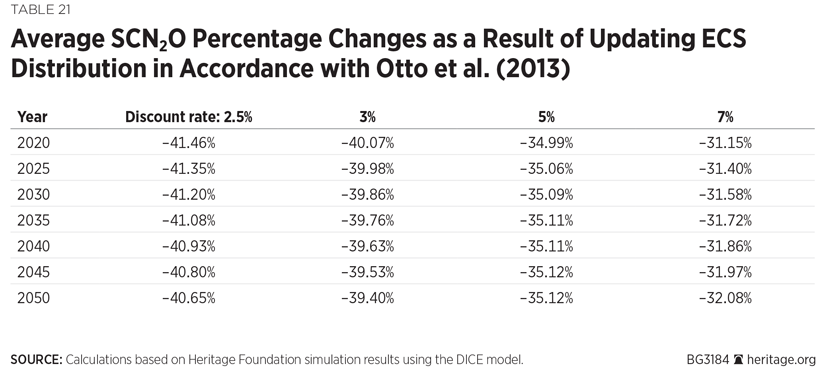
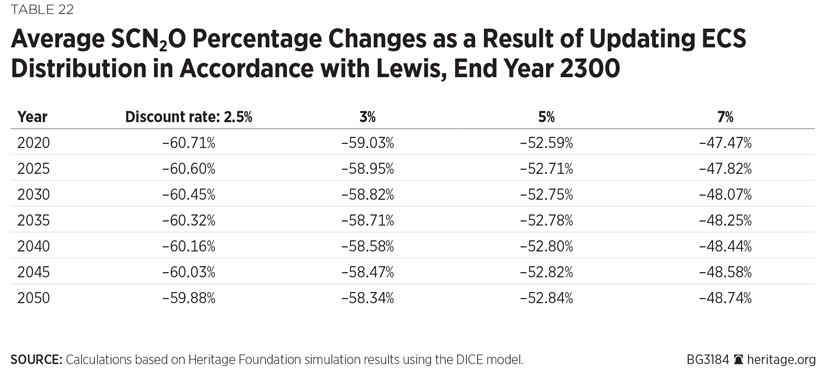
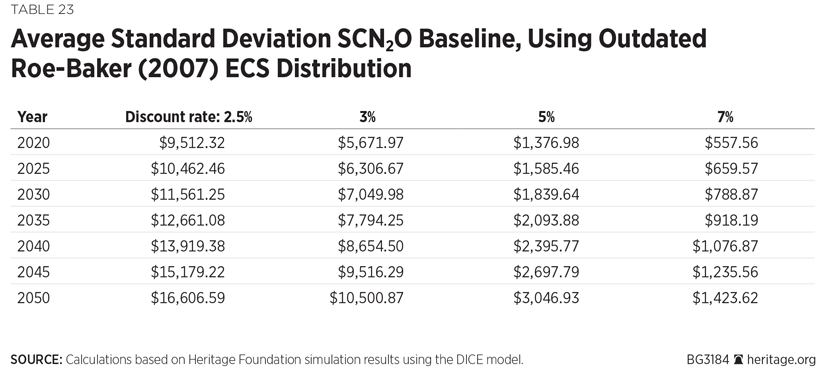
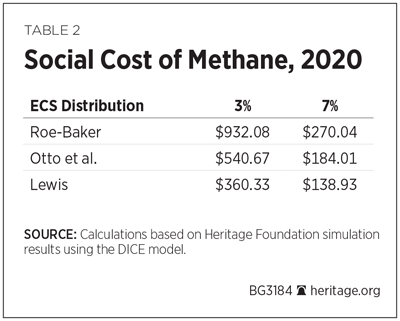
The following two tables show how sensitive the DICE model is both to updating the ECS distribution and to employing the 7 percent discount stipulated in the OMB’s guidance document.[REF]
Using the Roe–Baker distribution and only the 3 percent discount rate, the DICE model calculates a $932.08 SCM for the year 2020. However, using the more up-to-date distribution from Lewis and the 7 percent discount rate, the DICE model calculates a $138.93 SCM. Combined, these two reasonable changes cause the calculated value of the SCM to drop by 85 percent.
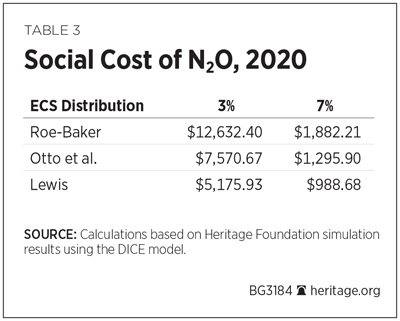
We notice a similar phenomenon with the social cost of nitrous oxide. In particular, doing the same substitution to calculate the SCN2O produces an even larger drop in the calculated value for 2020. In this case, the SCN2O drops 92 percent when using the Lewis ECS distribution and the 7 percent discount rate.
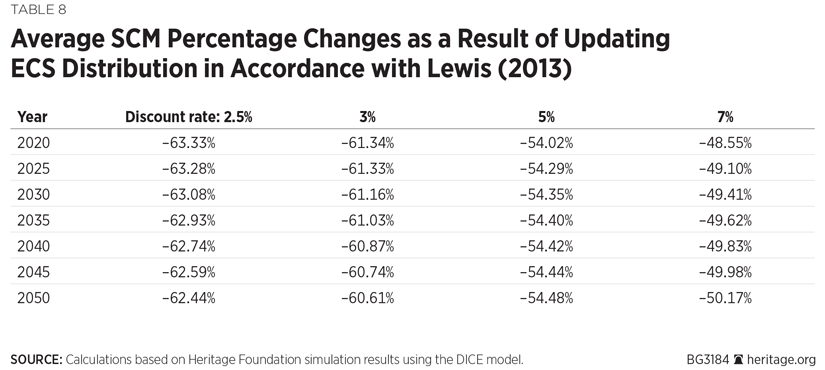
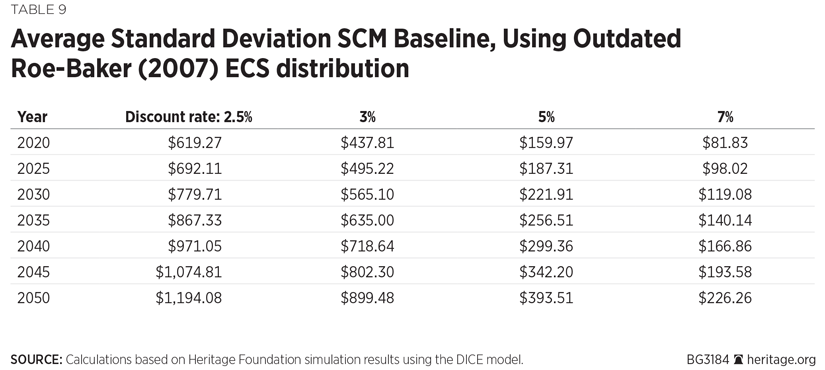
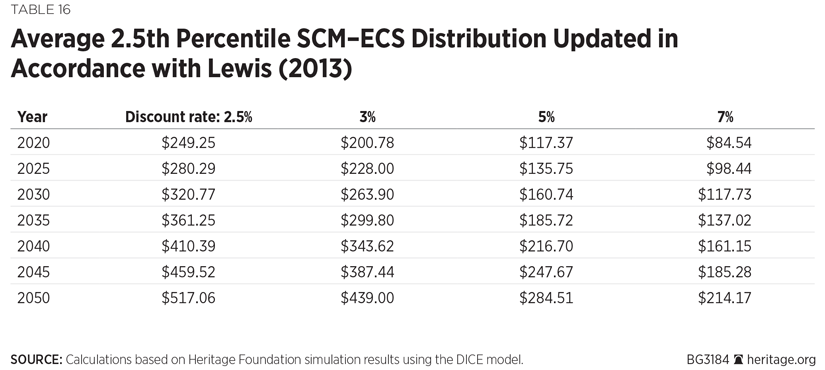
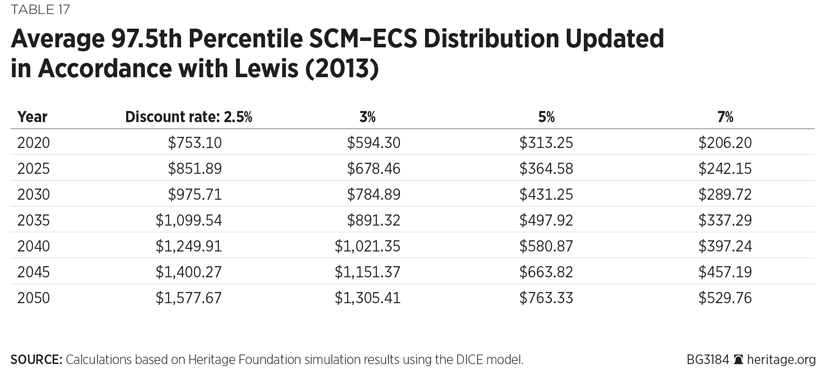
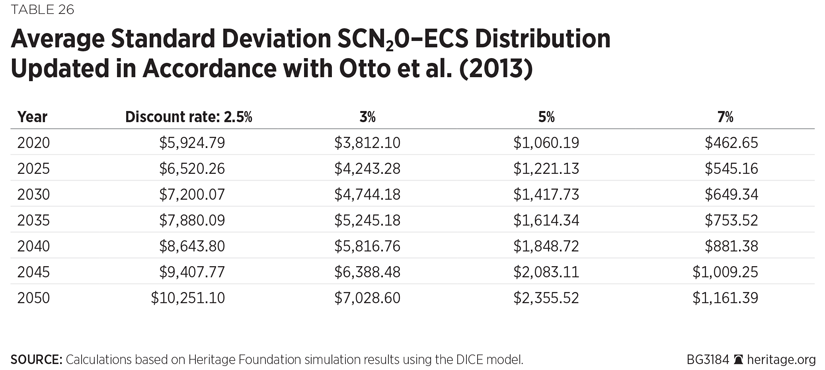
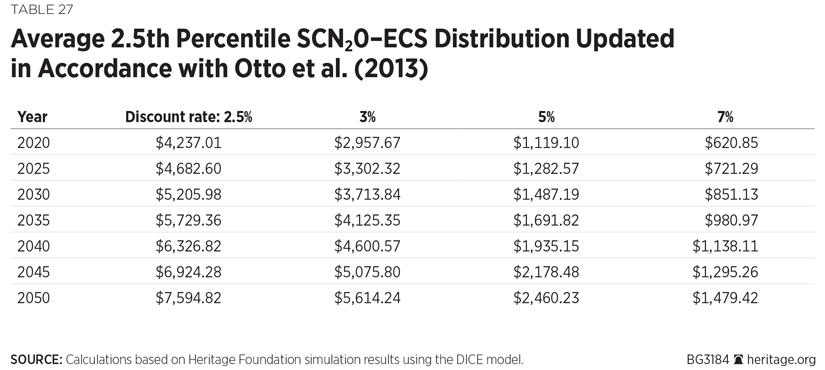
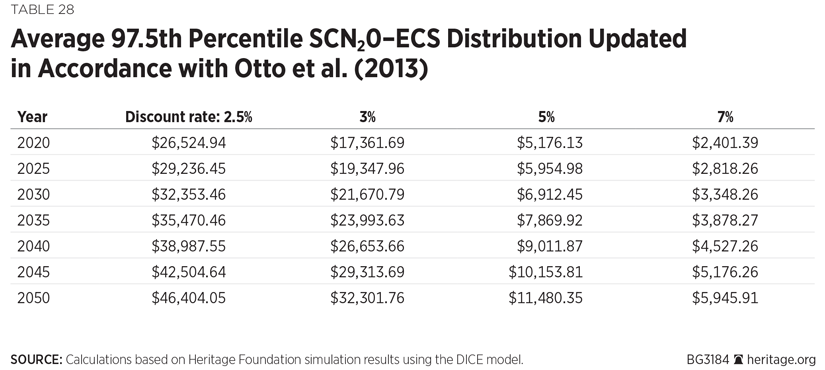
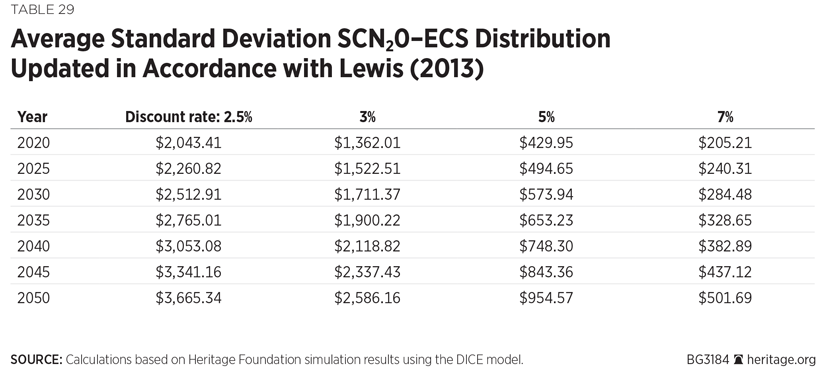
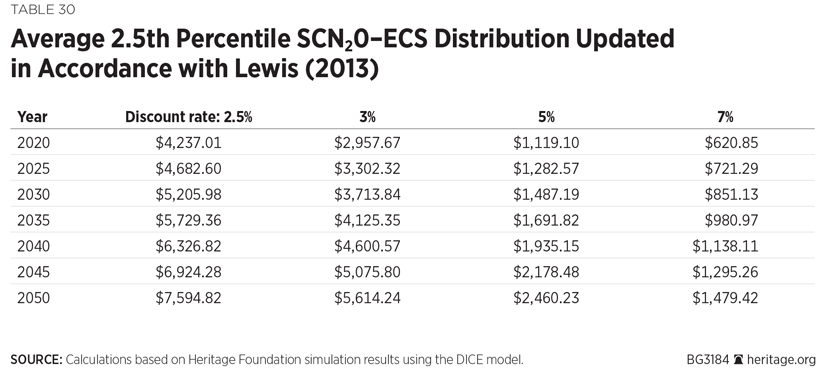
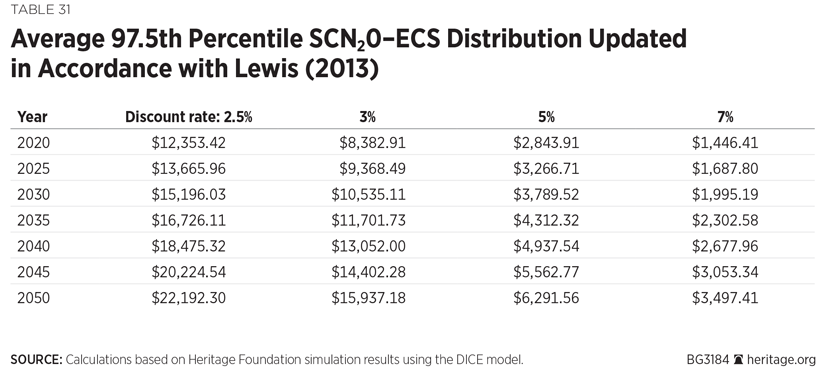
What is particularly interesting about these results is how the distributional properties of the SCM and SCN2O change as a result of alterations in the ECS distribution and the discount rate. In particular, when based on more up-to-date ECS distributions and higher discount rates, the distributions’ probability masses become translated toward potential values that are notably lower than the EPA’s estimates by as much as 60 percent. The distributions also appear to have lower standard deviations as a result of these changes.
These results signify not only great uncertainty about the EPA’s estimates of the SCM and SCN2O, but also the tremendous sensitivity of the DICE model. Though our focus in this paper is the DICE model’s sensitivity to reasonable changes in two parameters (the ECS distribution and the discount rate), concerns about the accuracy of the DICE model go well beyond these sensitivities.[REF]
Implications for the Environment
We ran the Model for the Assessment of Greenhouse-Gas Induced Climate Change (MAGICC) to find the impact of theoretically eliminating methane and nitrous oxide emissions from the United States completely. The World Bank has estimated levels of CH4 and N2O emissions for the United States as well as for the entire world.[REF] Assuming that the United States provides a constant fraction of these emissions over the rest of the century, Heritage Foundation simulations using the MAGICC model indicate that completely eliminating all methane emissions from the United States would result in a reduction of less than 0.03 degrees Celsius and an overall reduction of less than 0.27 centimeters in sea level rise. Eliminating all nitrous oxide concentrations from the United States would have an impact of less than 0.02 degrees Celsius on global temperatures and an impact of less than 0.17 centimeters on overall sea level rise.
Thus, given its sensitivity to reasonable changes in assumptions and the fact that regulatory policies implied by the model would have no meaningful impact on the climate, policymakers would be well advised to refrain from using the DICE model in devising regulations.
Conclusion
The integrated assessment models that the EPA uses to calculate the social costs of carbon dioxide, methane, and nitrous oxide are not legitimate for regulatory analysis. They are unsubstantiated tools that regulators can use to justify costly regulations or thwart new investments. Our results, in line with our previous work regarding the SCC, clearly demonstrate the DICE model’s tremendous sensitivity to reasonable changes in assumptions for both the SCM and the SCN2O. Estimates of sea level rise, a primary driver for climate change–related economic damages, also change considerably when the outdated Roe–Baker distribution used by the EPA is altered to reflect more up-to-date distributions.
The issues raised in this study are not the only problems associated with the DICE model. For example, as noted, the model is based on an extremely unrealistic time horizon that sums damages over the course of 300 years. Additionally the damage function used by the EPA in estimating these statistics is arbitrary and unjustified.
Given these issues, the DICE model, albeit an interesting academic exercise, is not nearly robust enough to serve as a meaningful statistical model for regulatory policy. Policymakers should therefore refrain from using these integrated assessment models in devising regulatory policy. Using these models would only mislead the public and their representatives as to the costs and benefits of regulations and government activities intended to counter global warming.
—Kevin D. Dayaratna, PhD, is Senior Statistician and Research Programmer in the Center for Data Analysis, of the Institute for Economic Freedom, at The Heritage Foundation. Nicolas D. Loris is Herbert and Joyce Morgan Research Fellow in Energy and Environmental Policy in the Center for Free Markets and Regulatory Reform, of the Institute for Economic Freedom.
Appendix
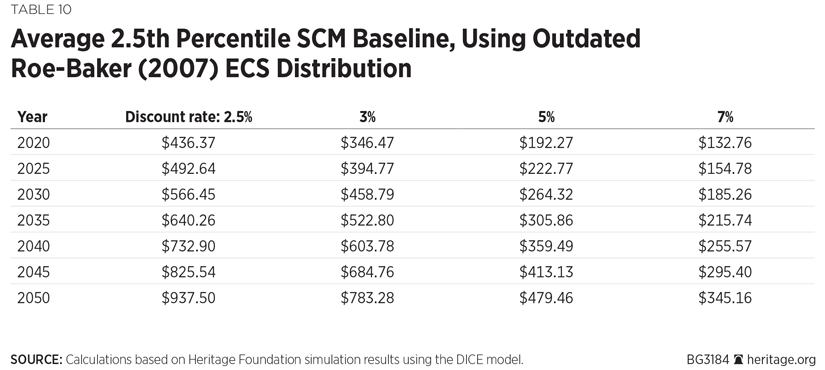
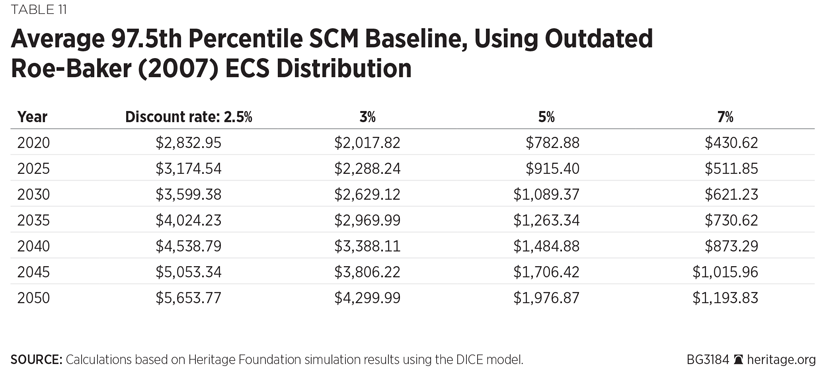
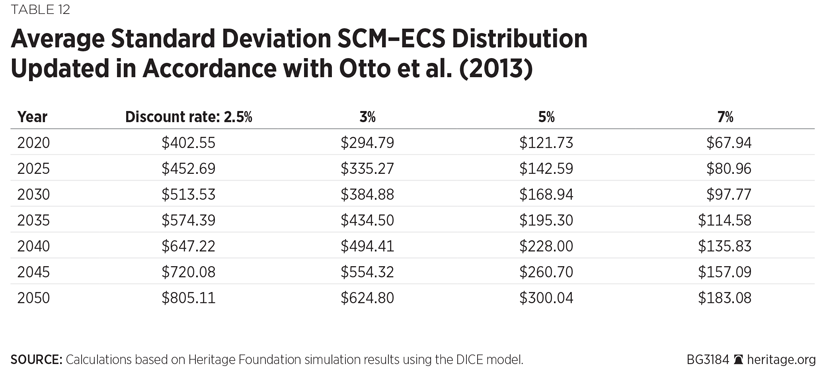
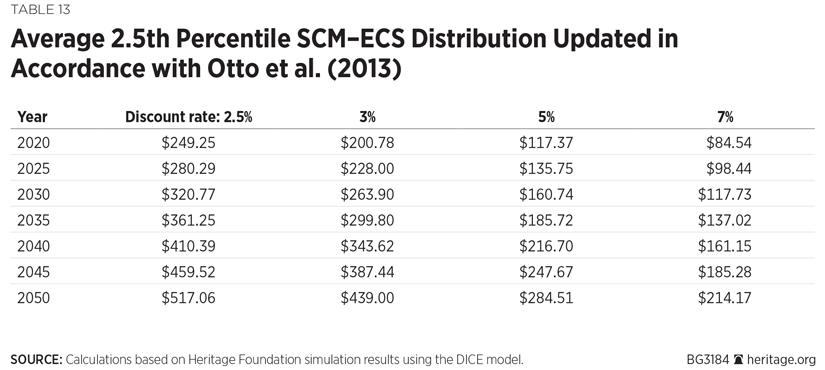
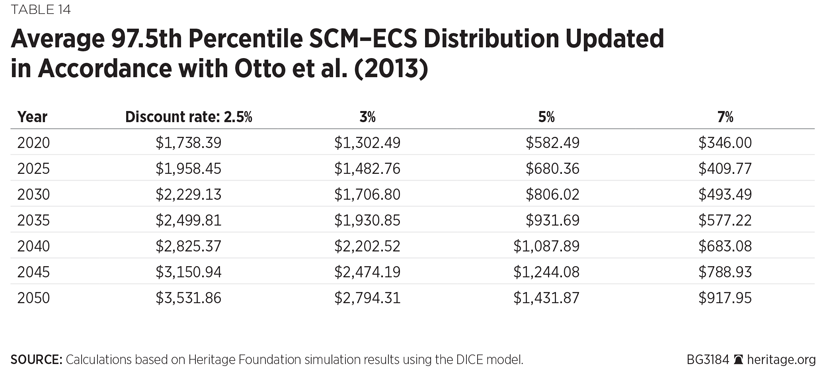
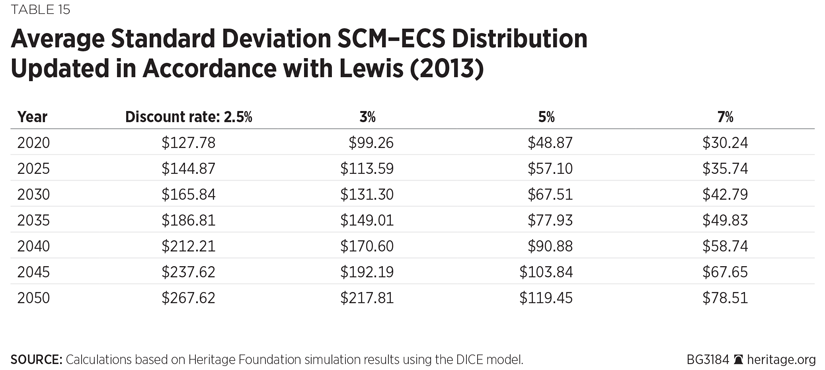
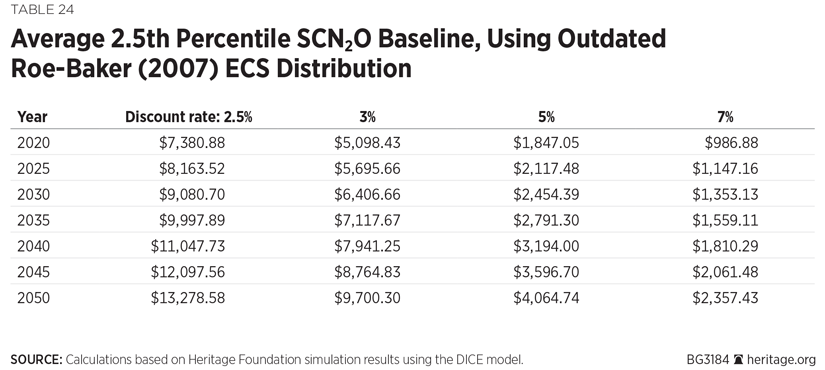
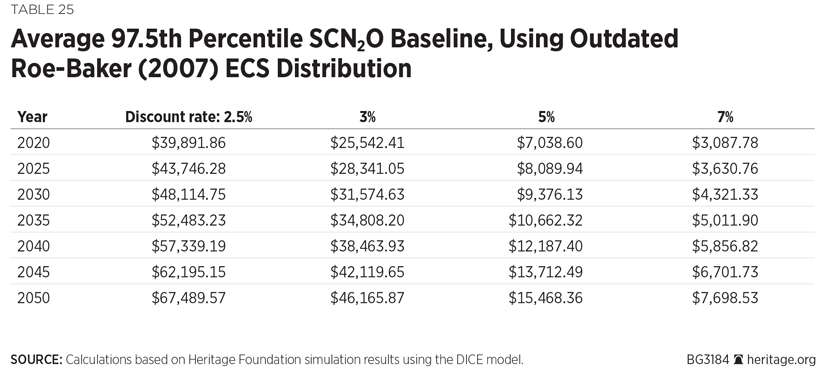
This appendix contains detailed results regarding means, standard deviations, and percentiles from our Monte Carlo simulations using the DICE model for a variety of choices of discount rates and ECS distributions. The following results are for the SCM. 