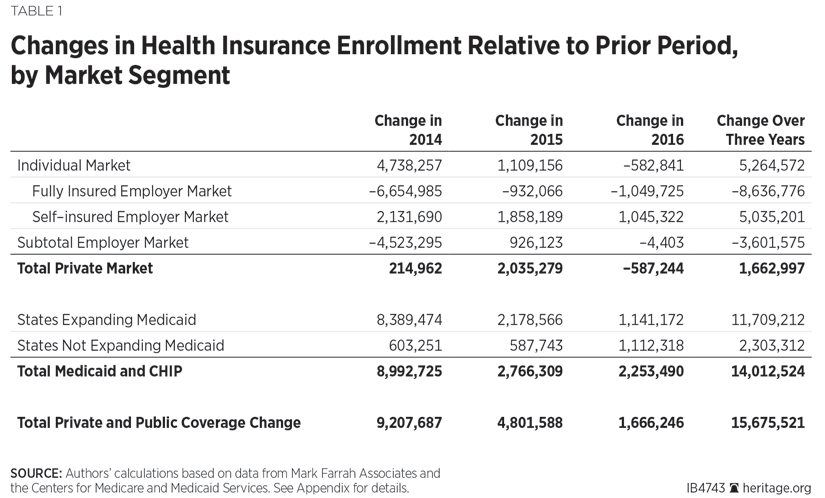
During 2016, individual-market enrollment decreased by 583,000 individuals and employer-group coverage decreased by 4,000 individuals for a net decrease in private-market coverage of 587,000 persons.[REF] For the employer-group coverage market, enrollment in fully insured plans decreased by 1.049 million individuals; enrollment in self-insured plans increased by 1.045 million individuals.[REF] The net effect was a decrease of 4,000 in the number of individuals with employer-sponsored coverage in 2016.
Public program enrollment in Medicaid and the Children’s Health Insurance Program (CHIP) increased by 2.25 million individuals in 2016. States with the Affordable Care Act’s (ACA) Medicaid expansion in effect experienced Medicaid enrollment growth of 1.14 million people; states without the expansion in effect experienced Medicaid enrollment growth of 1.11 million individuals.
Thus, the combined net changes in private and public enrollment resulted in about 1.7 million individuals gaining coverage during 2016—all of which was attributable to increased enrollment in public programs.
Evidence from Three Years (2014–2016) of Enrollment Data
With three years of enrollment data now available, the effects of Obamacare on insurance coverage have become clearer.
Over the three-year period of 2014–2016, enrollment in individual-market policies increased by 5.3 million individuals, from 11.8 million individuals at the end of 2013 to almost 17.1 million at the end of 2016.
For the employer-group coverage market, enrollment in fully insured plans dropped by 8.6 million individuals, from 60.6 million individuals at the end of 2013 to 52 million as of the end of 2016. Enrollment in self-insured employer plans increased by 5 million individuals, from 100.6 million in 2013 to 105.6 million in 2016.
The combined effect of the changes in individual-market and employer-group coverage resulted in a net increase in private-sector coverage of 1.7 million individuals.
Net Medicaid and CHIP enrollment grew by 14 million individuals, from 60.9 million at the end of 2013 to 74.9 million at the end of 2016. In states that adopted the ACA Medicaid expansion, enrollment increased by 11.7 million; in states that did not adopt the expansion, enrollment increased by 2.3 million individuals.
Thus, from 2014–2016, combined enrollment growth for both private and public coverage was 15.7 million individuals—with 89 percent of that increase attributable to additional Medicaid and CHIP enrollment. Furthermore, higher Medicaid enrollment in states that adopted the ACA Medicaid expansion accounted for almost three-quarters (73.5 percent) of total (public and private) enrollment gains.
The Effects of Obamacare
A number of provisions in Obamacare affect health insurance enrollment. The ones that do so most directly are the subsidies for individual-market coverage purchased through exchanges and the expansion of Medicaid eligibility to able-bodied adults without dependent children.
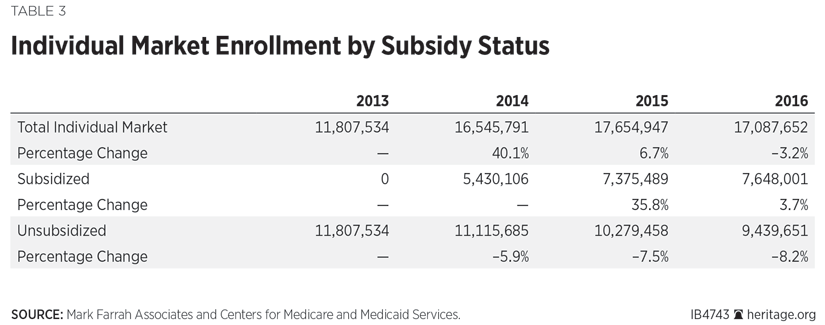
With respect to the individual market, Obamacare’s effects occurred primarily in the first year of implementation. The addition of 4.7 million persons to the individual market in 2014 was a 40 percent enrollment increase relative to the preceding three years, during which total enrollment in that market segment fluctuated between 11.8 million and 12 million people. Individual market enrollment grew by an additional 7 percent in 2015, but then declined by 3 percent in 2016.
Data from the Department of Health and Human Services (HHS) reproduced in Table 2 show a similar pattern for the subset of individual-market enrollees that obtained subsidized coverage through the new health insurance exchanges. The number of individuals with subsidized coverage through the exchanges was 5.4 million at the end of 2014, increasing to 7.4 million at the end of 2015, and 7.6 million at the end of 2016.[REF] Thus, after growing by 36 percent in 2015, the number of subsidized exchange enrollees grew by less than 4 percent in 2016.
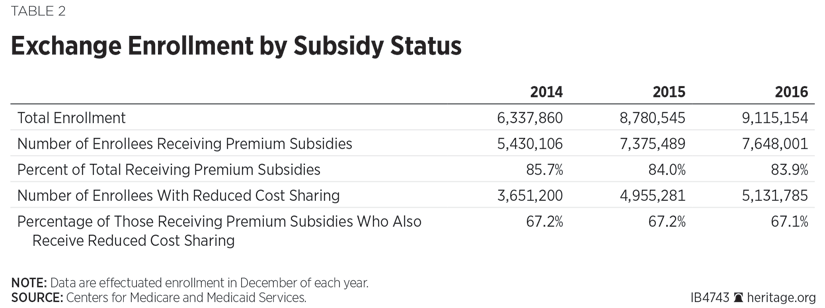
Table 2 also shows that the distribution of exchange enrollment by subsidy status has been remarkably consistent. In all three years, about 84 percent of exchange enrollees received premium subsidies; 67 percent of those receiving premium subsidies also qualified for cost-sharing reduction subsidies (paid to insurers). Because subsidized cost-sharing reductions are available only to enrollees with incomes below 250 percent of the federal poverty level who pick a Silver-level plan, the data clearly indicate that the exchanges have consistently attracted disproportionately low-income enrollees.
Notably, the flattening of enrollment trends for both subsidized and unsubsidized individual-market coverage predated any major political or policy changes. This suggests that, absent any changes to the law, future Obamacare enrollment gains would likely be marginal at best.
Another notable detail is that in 2016 the number of persons with unsubsidized individual-market coverage declined by 839,807 and the number with subsidized coverage increased by only 272,512. Table 3 shows that the unsubsidized individual market shrank at successively higher rates in each of the past three years.
The above trend is a disturbing indicator that Obamacare may be shifting from insuring the uninsured to un-insuring the previously insured—particularly when viewed in the context of flattening growth in subsidized individual-market enrollment and no net change in employer-plan enrollment.
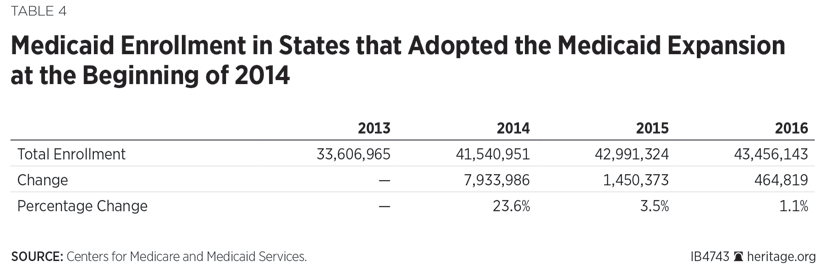
With respect to the Medicaid expansion, three years of data are now available for the 24 states and the District of Columbia where the expansion took effect at the beginning of 2014. The data show that the vast majority of enrollment gains occurred in the first year. (See Table 4.) That experience is consistent with projections made by the Centers for Medicare and Medicaid Services Actuary at the time of enactment.[REF]
Conclusion
2014 and 2015 saw significant increase in enrollment in individual-market policies. However, those gains have tapered off and may even be in the process of reversing as a result of the law significantly driving up premiums in that market. Lower-income individuals who qualify for premium subsidies for coverage purchased through the exchanges are largely insulated from those costs. However, middle-income, self-employed persons—the more typical pre-Obamacare individual-market customers—do not qualify for subsidies and are finding coverage to be increasingly unaffordable or even unavailable.
Thus, the present danger is that, if Obamacare’s most costly insurance regulations remain in place, the law will effectively force more of those middle-income individuals to drop their coverage, with some of them becoming uninsured.
The evidence of the past three years also indicates that the vast majority of enrollment gains under Obamacare have come through the law’s expansion of Medicaid coverage to include able-bodied adults without dependent children. While health insurance enrollment increased by 15.7 million individuals over the three-year period, 89 percent of that increase (14 million) was attributable to additional Medicaid enrollment and 73.5 percent of the total (11.7 million) came from higher Medicaid enrollment in the 31 states and the District of Columbia that adopted the Obamacare Medicaid expansion.
—Edmund F. Haislmaier is Preston A. Wells Jr., Senior Research Fellow in Domestic Policy Studies, of the Institute for Family, Community, and Opportunity, at The Heritage Foundation. Drew Gonshorowski is Senior Policy Analyst for Simulations in the Center for Data Analysis, of the Institute for Economic Freedom and Opportunity, at The Heritage Foundation.
Appendix: Data Sources and Adjustments
We used the Mark Farrah Associates dataset, derived from insurer regulatory filings compiled by the National Association of Insurance Commissioners (NAIC), for private-market enrollment by market segment. We excluded, as not relevant to our analysis, enrollments in: Federal Employee Health Benefit plans, Medicare Advantage plans, and supplemental coverage products (such as dental, vision, prescription drug, Medicare supplemental, and single disease).
For enrollment in self-insured employer plans, we used the data reported by Mark Farrah Associates for plans administered by an insurance carrier. Mark Farrah compiles that data from insurer regulatory filings, supplemented by other public and private sources, such as Securities and Exchange Commission filings. While the firm’s data on the self-insured market are the most comprehensive available, there are no reliable figures for enrollment in self-insured plans that are administered by independent third-party administrators (TPAs)—that is, TPAs that are not a subsidiary of an insurance carrier. However, based on its research, Mark Farrah Associates believes that truly independent TPAs likely account for no more than 5 percent of the total self-insured market.[REF]
For Medicaid and CHIP enrollment, we used the figures from CMS state-level monthly enrollment reports as they include enrollment under both Medicaid fee-for-service and Medicaid managed-care plans and are “point-in-time” counts, which makes them consistent with the “point-in-time” counts of private-market coverage in insurer regulatory filings.[REF] The CMS reports do not include enrollment data for December 2013, but we were able to obtain those figures from a report by the Kaiser Commission on Medicaid and the Uninsured and used them as the basis for calculating enrollment growth during 2014.[REF]
We made several adjustments to the Mark Farrah Associates private-market data to make it as complete and accurate as possible. Specifically:
- Arkansas implemented the Medicaid expansion through a so-called private-option design. Under that approach, qualified individuals are enrolled in the state’s Medicaid program, and then, at the beginning of the month following enrollment, select (or are assigned) coverage through a Silver-level plan offered in the exchange, with Medicaid paying almost all of the premiums. This arrangement could result in double counting those individuals in our analysis. The CMS Medicaid enrollment reports include private-option enrollees in Arkansas’s Medicaid enrollment figures. However, the regulatory filings by carriers offering exchange coverage in Arkansas include private-option enrollees in their enrollment counts for individual-market coverage—which, from the carrier perspective, would be appropriate. Separately, the Arkansas Department of Human Services (DHS) reported that the number of individuals with completed private-option enrollment at the end of 2016 was 276,141.[REF]
Consequently, to avoid counting private-option enrollees twice, we subtracted the Arkansas DHS figures from the figures for total individual-market enrollment for Arkansas derived from the insurer regulatory filings. Thus, our analysis counts Arkansas private-option enrollees as Medicaid enrollees.
- One California carrier was missing from the Mark Farrah Associates dataset as it reports its Covered California exchange business in a table of “Other Sources of Enrollment” in its filings with the California Department of Managed Health Care. We added that carrier’s Covered California enrollment to the individual-market data.
- Four New York carriers that offer coverage through that state’s exchange are Medicaid managed-care insurers that did not offer coverage in the individual or group markets prior to 2014, and do not file NAIC reports, as they are regulated by the New York State Department of Health. For those carriers, we used the figures from the 2016 enrollment report published by the state exchange.[REF] However, we were able to obtain enrollment numbers for those carriers for the end of 2014 and 2015 from their federal medical loss ratio (MLR) report filings, and updated our 2014 and 2015 figures accordingly.
- Fourth-quarter reports were missing for three insurers. We used the enrollment figures that they reported on their most recent (3rd Quarter 2016) NAIC filings on the presumption that most, if not all, of those enrollees still had their coverage in force through the end of 2015.
The net effects of these adjustments to the enrollment figures derived from the Mark Farrah Associates dataset were a decrease of 88,772 for the individual market and an increase of 9,938 for the fully insured group market.