Central banks … will do wisely to lay aside their inexpert ventures in half-baked monetary theory, meretricious statistical measures of trade and hasty grinding of the axes of speculative interests with their suggestion that by so doing they are achieving some sort of vague “stabilization” that will, in the long run, be for the greater good.
—H. Parker Willis, first Secretary of the Federal Reserve Board, and a principal architect of the Federal Reserve System, 1936
Many economists take for granted that the Federal Reserve has positively contributed to economic stabilization in the U.S. Regarding prices, the conventional wisdom is that the Fed has tamed inflation. A close look at the evidence, though, suggests that this conclusion should be reconsidered. For instance, while it does appear that the Fed has lowered the variability in inflation after it received a formal price stability mandate in 1977, the average rate of inflation has actually increased.
In fact, the evidence shows that the average rate of U.S. inflation since the Fed was founded has been much higher than it was prior to 1913. Consequently, the long-term purchasing power of the dollar has dramatically declined. Furthermore, the U.S. price level has become more difficult to forecast since World War II, and the benign deflation that arises from improved productivity has all but disappeared. Policymakers should, therefore, actively question the Fed’s long-term success on price stability. This Backgrounder highlights the Federal Reserve’s impact on prices, one narrow aspect of its economic stabilization policies.[1]
General Data Problems
Most modern macro data, as well as the procedures for compiling the data, did not exist prior to the Great Depression. The economists who began compiling these data series in the 1920s and the 1930s did the best they could to estimate data from earlier time periods, and they clearly understood that their approximations were rife with potential errors. For instance, the Bureau of Labor Statistics provides official Consumer Price Index (CPI) figures dating to 1913, and any price-level data prior to 1913 requires some type of approximation.
Another problem with comparing economic performance in the pre– and post–Federal Reserve eras is that three anomalous events occurred soon after the Fed was created in 1913. World War I, the Great Depression, and World War II produced major disruptions to the world’s economies. As a result, many economic studies exclude the period from approximately 1914 to 1945 in order to avoid these somewhat unique economic conditions. Nonetheless, the Federal Reserve did exist during this time period, so several studies also include the interwar years. Whenever possible, this Backgrounder presents data comparisons both with and without the interwar period.
High Inflation vs. Price Stability
Inflation refers to a rise in the economy’s overall price level, and the U.S. price level is typically measured by the CPI or the Personal Consumption Expenditure (PCE) index. The Bureau of Labor Statistics publishes the CPI every month, and it is designed to broadly represent how much the average U.S. consumer spends on a market basket (a representative bundle) of goods and services. The Bureau of Economic Analysis provides the PCE index, a measure of prices based on personal consumption in the official National Income and Product Accounts (NIPAs).[2] The Federal Reserve currently focuses on the PCE index to gauge inflation, but it relied on CPI inflation prior to 2000.[3]
Regardless of the index used, the rate of inflation is given by the rate of change in index values from one period to the next. High rates of inflation dilute the value of peoples’ cash holdings and have been associated with stifled economic growth.[4] Nevertheless, there is no objective measure of what constitutes “high” inflation. The Fed officially “judges that inflation at the rate of 2 percent … is most consistent over the longer run with the Federal Reserve’s mandate for price stability and maximum employment.”[5] Although the Fed does define this policy goal, the Fed does not define price stability per se, a concept that also lacks an objective measure.
In general, price stability refers to inflation that is low or stable enough so that people can ignore inflation when they make economic decisions. In 1996, Fed Chairman Alan Greenspan stated that price stability is zero inflation “if inflation is properly measured.”[6] Because many economists believe that official inflation numbers are biased slightly upward, Fed officials have set a positive value for its inflation target. In other words, if “true” inflation is zero, the official inflation numbers would still indicate some positive level of inflation, perhaps a bit higher than 1 percent.
Thus, consistently low rates of inflation are one type of price stability, although no particular statistical value precisely denotes low inflation. Similarly, low rates of variation in inflation are a type of price stability, but no specific value—regardless of which variability measure is used—objectively signifies that inflation is stable. Regardless, higher rates of inflation reduce purchasing power as time goes on unless wages and rates of return adjust along with inflation.[7] Evidence suggests that, on average, income does tend to adjust along with inflation over time, although distortionary short-run effects cannot be ignored.[8]
Of course, for any given rate of nominal income growth, all else being equal, higher inflation reduces the purchasing power of money more than would lower inflation. Therefore, lower rates of inflation are clearly closer in spirit to price stability, even though there is little agreement on whether, for example, 1 percent or 3 percent is sufficiently low to declare inflation stable.[9] In order to know whether the Federal Reserve has maintained price stability, whatever the precise definition, one must first ask: What has happened to inflation since the Fed was founded in 1913?
What Is the Fed’s Track Record?
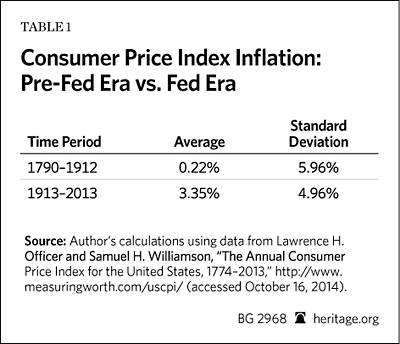
It is widely accepted—even celebrated by some economists—that the average inflation rate in the Federal Reserve era is higher than it was prior to the Fed’s founding. Federal Reserve policy has openly aimed at creating predictable “low” inflation and preventing a fall in the price level (deflation). Average inflation measures, from several different data sets, suggest that the Fed has succeeded in this policy goal: Average inflation has increased and deflation is rare. Furthermore, the overall variation in inflation has declined. Using an approximation of the annual CPI, the average annual inflation rate before the establishment of the Fed was approximately 0.2 percent, whereas the average rate has been 3.35 percent in the Fed era. (See Table 1.) Furthermore, the average inflation rate in the post–World War II era has been 3.65 percent.[10] (See Table 2.)

The annual price data also shows that from 1790 to 2013, not counting the Civil War years, the single highest inflation rate in the nation’s history—20.49 percent in 1917—occurred on the Fed’s watch.[11] The (nearly indistinguishable) pre-Fed maximum rate of 20.02 percent occurred in 1813. An alternative data series, consisting of quarterly inflation rates from 1875 to 2010, also shows that the highest rates of inflation in the U.S. occurred after the founding of the Fed.[12]
Some of the highest inflation rates in recent history occurred between 1973 and 1975, and between 1978 and 1982, but these rates (ranging from 6 percent to 13 percent) did not exceed the high rates of the early Fed era. From 1917 to 1920, for instance, annualized inflation rates from some quarters approached 40 percent.[13] As one study notes:
Significantly, both of the major post-Federal Reserve Act episodes of inflation coincided with relaxations of gold-standard based constraints on the Fed’s money creating abilities, consisting of a temporary gold export embargo from September 1917 through June 1919 and of the permanent closing of the Fed’s gold window in 1971.[14]
While average inflation rates have increased in the Federal Reserve era, the variability in inflation rates appears to have declined. For instance, the Officer–Williams CPI series, named for economists Lawrence Officer and Samuel Williams, estimates that the standard deviation in inflation rates from 1790 to 1912 was 5.96 percent. On the other hand, the standard deviation was 4.96 percent from 1913 to 2013. Because the full Federal Reserve era includes many unique economic problems between the two world wars, many economists focus only on the post–World War II economic data. In this narrower time period, from 1948 to 2013, the standard deviation was slightly less than 3 percent. (See Table 2.) This lower postwar variation is often cited as evidence that economic stabilization policies—both fiscal and monetary—have worked.
Post–World War II vs. Post–Dual Mandate
Some policymakers find it unjust to hold the central bank responsible for price stability before 1978 because the Fed did not yet operate under a formal price stability mandate.[15] Splitting the post–WII time period into pre-mandate and post–mandate time frames, the CPI data reveal higher average inflation and a small reduction in variability after the mandate. The average inflation rate was 3.56 percent from 1948 to 1978, and 3.74 percent from 1979 to 2013. Variation fell from 3.03 percent to 2.78 percent in the post–mandate period. (See Table 2.)
Thus, there was an increase in the average rate of inflation, and a decline in variability after Congress formally directed the Fed to focus on price stability. Economists generally view this reduction in variability as an increase in price stability. Still, more sophisticated analyses show that, as these newly “stable” rates of inflation became the norm after World War II, a complicating factor appeared in the inflation data.
This complicating factor is known as persistence, and it has been well documented in U.S. price data since at least the 1970s.[16] Generally speaking, this term indicates that any external shocks tend to influence future changes in inflation for a longer time than would be expected in the absence of persistence. This issue may not outweigh the benefits of the overall decline in inflation variability, but it does have important implications for monetary policy.
One consequence of this data trait is that it has become very difficult to improve upon a basic naïve forecasting model, which predicts that next period’s inflation will be equivalent to last period’s inflation.[17] In particular, the ability to predict inflation with various macroeconomic variables, such as “the unemployment rate, commodity prices, capacity utilization, the money supply, and interest rates,” has drastically declined since the mid-1980s.[18] That is, there is little empirical support for using anything other than inflation itself to guide forecasts.
More broadly, the debate over persistence—its causes and its exact nature—is “part of the general debate on whether the relatively stable inflation that characterized the so-called Great Moderation period (1985 until the Great Recession) was due to lower volatility of the shocks (better luck) or less persistence in the effects of the shocks, which could be partly attributed to better policy.”[19] This debate is far from settled, and possible explanations for the change in inflation include, among others, a change in the conduct of monetary policy after 1984, changes in the fundamental structure of the economy, a general improvement in financial intermediation, or changes to the nature of the shocks that occur in the economy.[20]
Deflation
Aside from these technical statistical issues, it is also clear that deflation (a general decline in prices) has all but disappeared from the U.S. data. Many economists argue that central banks should set a policy of targeting positive inflation rates specifically because doing so helps to avoid deflation. A falling price level can be particularly harmful when, for example, a drop in demand leads to a sort of deflationary spiral from which businesses are unable to recover. For example, former Federal Reserve Chairman Ben Bernanke once noted that:
The sources of deflation are not a mystery. Deflation is in almost all cases a side effect of a collapse in aggregate demand—a drop in spending so severe that producers must cut prices on an ongoing basis in order to find buyers.[21]
Bernanke’s view is conventional—deflation has become synonymous with depression. Recent research, however, provides evidence that deflation and severe economic contractions are not inseparable. In fact, one study that surveyed nearly 20 countries documents “many more periods of deflation with reasonable growth than with depression, and many more periods of depression with inflation than with deflation.”[22] There is no doubt that deflation can be harmful, but it is just as true that deflation can be the byproduct of a healthy, growing economy.[23]
As business owners take advantage of new technology, for example, they produce more and more products at a lower cost, thus enabling consumers to buy more goods at lower prices. Still, in the U.S., average prices have rarely fallen since World War II even though the Fed did not have a formal inflation target until 2012. In fact, the annual CPI has fallen from its previous level only twice since 1950 (in 1955 and 2009).[24] In both of these cases, the rate of deflation was less than 0.4 percent. Thus, to whatever extent the Fed has successfully influenced inflation, it has done so by virtually eliminating deflation.
Inflation: Too High? Too Low?
Throughout the 1970s and the early 1980s, the U.S. experienced several severe recessions as inflation rose and fell sharply. This period was followed by a marked decline in inflation which coincided with robust economic growth. (The improvement was so dramatic that this latter period is frequently referred to as the Great Moderation.) The average rate of CPI inflation, for instance, was almost 7.5 percent from 1970 to 1983, whereas the average rate from 1984 to 2009 was approximately 3 percent. Similarly, the standard deviation of CPI inflation fell from about 3 percent to 1 percent during the latter period.
Aside from the reduction in variability, this improvement raises interesting questions for policymakers regarding the level of inflation. Namely, is inflation of 3 percent still too high? After all, the Fed’s official inflation target is 2 percent, and the average rate during the pre-Fed era was less than 0.5 percent. Should policymakers aim for zero inflation? There is a general consensus that high inflation is harmful, but there simply is no such consensus on exactly what the optimal number should be.[25] Notwithstanding Alan Greenspan’s affection for zero inflation, two of the main arguments for targeting an inflation rate higher than zero hinge on the ability of monetary policy to stimulate the economy.
The first argument holds that inflation helps to increase employment, particularly in a crisis but also on a regular basis. The basic logic is as follows: Inflation can increase employment because it reduces inflation-adjusted (“real”) wages. While nominal wages rarely fall, inflation lowers the “real” cost of hiring workers. Therefore, inflation can “grease the wheels” of the labor market by giving a boost to employment.[26]
One counterargument to this proposition is that, over time, average compensation tends to rise with productivity, which means that nominal wages may not need to fall in order help labor markets function smoothly.[27] Furthermore, if inflation makes nominal wage rigidity more palatable, inflation may actually perpetuate nominal rigidity. The grease-the-wheels story also ignores the possibility that higher inflation might have the opposite effect on other aspects of the labor market, thus cancelling out any beneficial impact from inflation. That is, inflation could also put “sand in the wheels” of the labor market by distorting other prices. Though this issue is not completely settled, there is evidence that these two effects may largely cancel each other out in labor markets.[28]
A second argument for greater-than-zero inflation is that it can provide a central bank more flexibility to stimulate the economy through lowering interest rates. This argument centers around what is called the zero-lower-bound constraint, so named because nominal interest rates cannot fall below zero. Proponents of this view hold that nominal interest rates should always remain high enough so that the Fed can adequately cut interest rates to stimulate the economy, particularly during a crisis but also during normal business cycles.[29]
A main argument against this view is that the goal of monetary policy is to provide liquidity, not to manage interest rates. Although the Fed does target the nominal federal funds rate to implement its policies, nominal interest rates are not always an accurate indicator of whether monetary policy is too expansionary or contractionary.[30] Liquidity is the key factor and the Fed can always inject liquidity into the market, regardless of the level of nominal interest rates. Moreover, a policy of constantly influencing interest rates could have distortionary effects on capital investment projects, which are often undertaken—or not—based partly on expected interest rates.[31]
Conclusion
Most mainstream economists take for granted that the Federal Reserve has positively contributed to economic stabilization in the U.S., particularly regarding price stability. The Fed does appear to have achieved some type of price stability in the post–World War II era, but it is not entirely clear that this achievement has been beneficial. In the post–World War II years, the average rate of inflation has increased, but variability in the rate of inflation has declined. This improvement in variability is not as dramatic when the entire Fed era is examined, largely due to the Great Depression.
Furthermore, the benign deflation that can arise from improved productivity has all but disappeared from U.S. price data. Policymakers should actively question the Fed’s long-term success regarding price stability and whether that record is an improvement over the monetary system that was in place in the U.S. between the Civil War and World War I. These issues deserve a thorough examination, preferably in the context of a congressional commission, such as proposed by the Centennial Monetary Commission Act of 2013 (H.R. 1176 and S. 1895) sponsored by Representative Kevin Brady (R–TX) and Senator John Cornyn (R–TX).
—Norbert J. Michel, PhD, is a Research Fellow in Financial Regulations in the Thomas A. Roe Institute for Economic Policy Studies, of the Institute for Economic Freedom and Opportunity, at The Heritage Foundation.


