Abstract: Many of the claims and assertions that U.S. Secretary of Transportation Ray LaHood makes on behalf of the transit industry are inconsistent with the data and studies produced by many agencies of the federal government, including his own Department of Transportation. Secretary LaHood has based his policy largely on the work of lobbyists, rather than on the work of analysts and statisticians who work in the DOT, and has largely ignored the extensive work by the U.S. Government Accountability Office, Congressional Research Service, Congressional Budget Office, United States Bureau of the Census, and U.S.-based academics and independent research organizations. Virtually none of Secretary LaHood’s claims can withstand scrutiny. Unless realistic expectations based on objective and reliable information replace the ideological and undeliverable goal of trying to divert travel away from cars to transit, the nation could find itself spending hundreds of billions more dollars without accomplishing anything but further congesting its urban areas, increasing unemployment, and retarding productivity.
Shortly after Secretary of Transportation Ray LaHood, at a May 2009 Washington press conference, made known his agenda to coerce people out of their cars,[1] he posted an article on his Department of Transportation (DOT) blog touting the purported benefits of urban rail systems (subways, light rail, and commuter rail).[2] Secretary LaHood cited seemingly impressive figures to show that the net benefits from the nation’s urban rail systems are greater than its costs.
In his blog, Secretary LaHood makes the following assertions, all derived from a 2004 Canadian study prepared for the American Public Transportation Association (APTA), the country’s principal transit lobbying organization. Secretary LaHood contends:
- That transit produces substantial regional economic benefits;
- That rail transit is far more energy efficient than automobiles, consuming only one-fifth the energy per passenger mile; and
- That in 2002, rail transit saved $19.4 billion annually in congestion costs, $22.6 billion in consumer transportation costs, $20.1 billion in road and parking costs, and $5.6 billion in traffic accident costs.
As this report will demonstrate, not one of these claims is correct.
The Secretary concludes that the annual rail subsidy cost of $12.5 billion was offset several times by these savings. But as this review reveals, these assertions are from an insufficiently vetted and dated report outsourced to a Canadian consulting company by the American Public Transportation Association.
There are proposals for substantial increases in government subsidies for transit. Such a program could yield, at best, marginal benefits. Transit has a record of attracting new ridership that is well below levels that correspond to inflation-adjusted subsidy increases.
Further, the rail transit benefits claimed in the APTA paper largely reflect the New York metropolitan area or even New York City itself and are not transferable to other areas of the nation. Indeed, there is a strong movement of households underway from the large-rail metropolitan areas to other large metropolitan areas and other parts of the nation.
Parroting Lobbyist Hype
Much of Secretary LaHood’s blog post is based on a report prepared for the American Public Transportation Association in 2004 by a Canadian consulting firm, the Victoria Transportation Policy Institute.[3] The Secretary relies on the report to imply that the benefits that he perceives would occur if there were more emphasis on transit.
APTA represents the interests of transit agencies, multinational construction firms, and transit industry suppliers, including U.S and international firms that stand to benefit financially if there is more development of urban rail systems. While there is nothing inappropriate about research that is funded by special interests, it must be accurate, objective, and comprehensive to be credible. This analysis indicates that the APTA report falls short of such a standard.
Nonetheless, Secretary LaHood relied solely on a five-year-old report of an industry lobbying association whose government and private-sector members have a substantial financial interest in the subject, ignoring reports by the Department of Transportation’s own research departments and the extensive work by the U.S. Government Accountability Office, the Congressional Research Service, the Congressional Budget Office, and U.S.-based academics and independent research organizations.
According to the APTA/Canadian report’s abstract, the “report evaluates rail transit benefits based on a comprehensive analysis of transportation system performance in major U.S. cities.” The report claims that cities with “large, well-established rail systems” produce various economic and transportation benefits compared to urban areas with “less or no rail service.”[4] The report also claims that “[w]hen all benefits and costs are considered, rail transit often turns out to be the most cost effective way of accommodating additional urban travel.”[5]
While the APTA report is intended to contrast characteristics of large-rail metropolitan areas in comparison to other metropolitan areas, most of the differences are driven by the New York urban metropolitan area, especially New York City. (See the Appendix.)
Flawed from the Beginning. The APTA report sets up a “straw man” to suggest how costs would differ in urban areas if rail transit service did not exist. Of course, no such policy has been seriously proposed. Moreover, any serious inquiry into what urban areas would be like if their rail systems had not developed would require a more complete analysis than the APTA report provides. For example, such an analysis would need to consider the costs and benefits of the alternative urban development that would have occurred without rail transit.
Even if such an analysis had been provided, however, it would not necessarily shed light on the impacts of present policy proposals to increase transit funding, build new urban rail systems, or expand existing urban rail systems.
Evaluating the APTA Report. This paper will critique APTA’s claims with respect to the benefits of rail transit and will review the potential for rail transit to contribute materially to reducing traffic congestion in the nation’s metropolitan areas.
The APTA Report
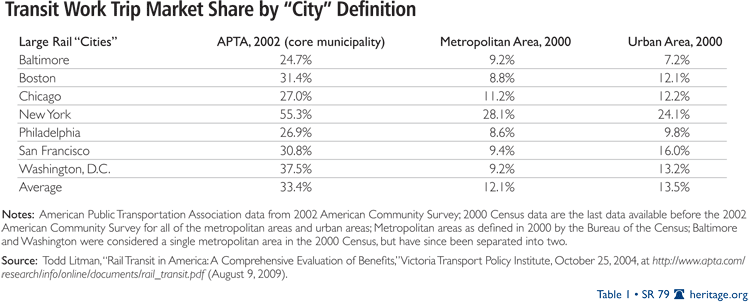
APTA’s consultant, the Victoria Transport Policy Institute, divides U.S. “cities” into three categories: “large-rail,” “small-rail,” and “bus-only,” with much of its focus on the 50 largest “cities.” APTA is imprecise and inconsistent about what it means by “city,” which, depending on the element of analysis, may be “metropolitan area,” “urban area” (urbanized area), or a core municipality, each of which has a distinct meaning. Valid research requires appropriate labeling.[6]
The distinctions are as follows:
- A core municipality is the principal city within either a metropolitan area or an urban area. For example, Washington, D.C., is the core municipality (city) of the Washington, D.C., metropolitan area and the Washington, D.C., urban area. The city of Washington covers 61 square miles and has a population of 572,000 (2000). The city of Washington accounts for less than 2 percent of the land area in the urban area and 15 percent of the population of the urban area.
- An urban area is an “urban footprint,” or area of continuous development, which is also defined by the U.S. Bureau of the Census. An urban area is generally outlined by the concentration of lights visible on a clear night from high above in an airplane. By definition, there is no rural land in an urban area. For example, the Washington, D.C., urban area covers 1,157 square miles and extends into both Maryland and Virginia. The Washington urban area accounts for 20 percent of the land area in the metropolitan area and its 3,934,000 residents (2000) account for 80 percent of the population.[7]
- A metropolitan area is a labor market, which includes economically connected urban and rural areas as defined by the U.S. Bureau of the Census. For example, the Washington, D.C., metropolitan area covers 5,629 square miles and has a population of 4,796,000 (2000). The metropolitan area includes not only the city of Washington (the District of Columbia), but also the entire urban area and five counties in Maryland, nine counties in Virginia, six independent cities in Virginia, and one county in West Virginia.
Based on the data sources cited, it is clear that much of the APTA analysis is at the metropolitan-area or urban-area level. This is appropriate because these alternative terms define the entire urban form. It is permissible to use both metropolitan-area and urban-area data in analysis, when properly labeled, since comparable data are not always available for both definitions.[8]
A third definition of “city” is a municipality, such as the city of Atlanta or the city of New York. All of the nation’s largest municipalities are smaller in both population and land area than their corresponding metropolitan areas or urban areas. For example, the core cities of Atlanta and Hartford represent approximately 10 percent or less of the corresponding metropolitan-area population. The core city of San Antonio represents the largest share of the corresponding metropolitan-area population, with more than 65 percent.
In an “apples and oranges” comparison, APTA uses core municipality transit market shares in an analysis of urban areas or metropolitan areas.[9] The result is that the APTA transit market shares are more than double the metropolitan-area and urban-area market shares that were available at the time the APTA report was prepared.[10] (See Table 1.) Similar inconsistencies are found elsewhere in the APTA report.[11]
Economic Impact Claim
The economic benefits claimed by Secretary LaHood are based on a flawed and narrow analysis that is limited to a single metropolitan area. The economic study cited by the Secretary indicates that “each 1% of regional travel shifted from automobile to transit increases regional income about $2.9 million” (not billion).[12] To put this supposed benefit in perspective, $2.9 million is equal to about eight days of sales at the typical Costco warehouse store.
The report was commissioned by the San Antonio transit agency and is limited in scope to the San Antonio metropolitan area. Transit’s share of travel in San Antonio was slightly less than 1 percent in the analysis year (1999). To transfer 1 percentage point of automobile use to transit would thus require an increase of more than 100 percent in transit ridership, yet the report indicates that transit service would increase by only 8 percent and transit operating costs would increase by only 6 percent. It is inconceivable that transit ridership could be increased by 100 percent while transit service increased by only 6 percent.
However, it is unlikely that the transit agency could double ridership without increasing service (and costs) by at least that amount.[13] It is estimated that the additional service and buses that would be needed to accommodate a 1 percentage point shift from cars to transit would be approximately $150 million annually.[14] The overall result for the San Antonio economy would be a net loss of at least $145 million. The lost productivity due to the additional travel time would approximate another $100 million, bringing the total loss to nearly $250 million, compared to the claimed $2.9 million ($3.8 million in 2008 dollars) gain indicated in the economic analysis.
Conclusion: Economic Impact. The purported economic benefits are both minuscule and unachievable and would be more than offset by the high costs of transit service expansion.
Energy Efficiency Claim
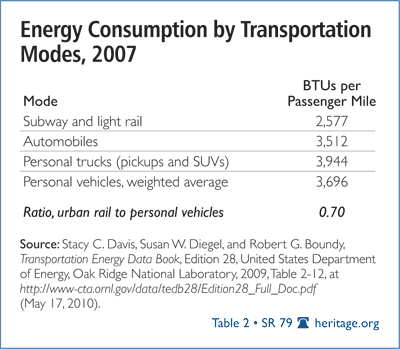
The Secretary’s transit energy-efficiency claim is incorrect, based on United States Department of Energy data. The APTA report’s claim that rail transit “consumes about a fifth as much the energy (80% less energy) per passenger mile as automobile travel” contradicts Department of Energy data.
The Secretary’s claim is based on Figure 27 in the APTA report, which takes data from a 2002 APTA report by Robert Shapiro, Kevin Hassett, and Frank Arnold[15] purportedly showing that the electric rail transit modes (light rail and heavy rail, or Metros) consume approximately 1,000 British Thermal Units (BTUs) per passenger mile.[16] This report, however, is based on a data source that excludes the energy required to generate the electric power. This is a major and inappropriate omission. The U.S. Department of Energy’s Transportation Energy Data Book indicates that subways and light rail consume 2,577 BTUs per passenger mile when power plant emissions and transmission are included.[17]
Shapiro, Hassett, and Arnold then produce calculations to show that the average personal vehicle consumes 5,250 BTUs per passenger mile.[18] In fact, the most recent U.S. Department of Energy data indicate that the average personal vehicle consumes 3,696 BTUs per passenger mile. (See Table 2.) Thus, rail transit does not consume one-fifth (80 percent less) the energy of automobiles per passenger mile; it consumes 30 percent less,[19] a difference that could well be eliminated in the future.
It seems curious that APTA would use data from a secondary and insufficiently vetted research report on energy efficiency when primary U.S. government data were available. The Transportation Energy Data Book has been published annually for more than 25 years.
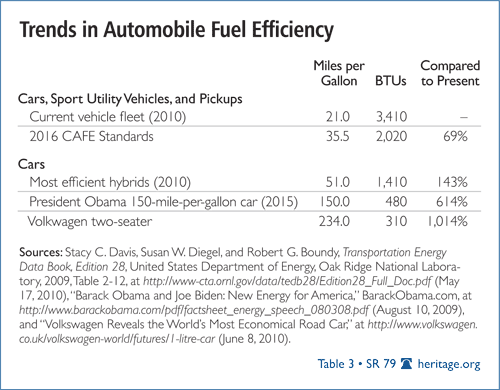
Moreover, even the present difference between rail transit and automobiles may be only temporary. The Obama Administration has mandated that new cars and personal trucks must achieve 35.5 miles per gallon by 2016. This means that new cars will average approximately 2,100 BTUs per passenger mile, well below the current energy consumption of urban rail.
The newest hybrid cars already achieve more than 50 miles per gallon, consuming slightly more than one-half the BTUs per passenger mile of rail transit.[20] During the 2008 campaign, the President indicated a commitment to developing 150-mile-per-gallon cars with the objective of having 1,000,000 on the road by 2015.[21] Neither the President nor Secretary LaHood appears to have taken action on this initiative. Finally, Volkswagen has developed a 235-mile-per-gallon two-seater car.[22] (See Table 3.) Cars such as these would consume less than 500 BTUs per passenger mile, far less than current transit services.
Further, fuel-economy developments will lead to radically lower levels of greenhouse gas emissions because GHG emissions are emitted in direct proportion to fuel consumption. If all automobiles were to achieve hybrid-equivalent fuel by 2030, automobile-related GHG emissions in urban areas would decline by about 55 percent from 2005 levels, even with the increases in travel projected by the Department of Energy.[23]
Conclusion: Energy Efficiency. U.S. Department of Energy data indicate a much smaller difference between rail transit and automobile energy intensity. Regulations have been adopted that will make automobiles more energy-efficient than rail transit, and material technological improvements are on the horizon.
Cost-Savings Claims
This analysis reviews the APTA report’s rail transit cost-savings claims by comparing the seven large-rail metropolitan areas to the 43 other largest metropolitan areas.[24] No distinction is made between small-rail urban areas and bus areas, because more than 90 percent of the purported APTA savings is attributable to the larger-rail areas. APTA itself noted that only a few cities have rail transit systems that are large enough to “significantly effect regional transportation performance.”[25]
Moreover, as will be illustrated below, APTA’s large-rail urban-area classification is principally a measure of rail’s impact in New York City (not the New York urban or metropolitan areas) rather than in large-rail urban areas outside New York.
Congestion Cost (Cost of Lost Time). The APTA report’s claim that “rail transit services are estimated to provide $19.4 billion in annual congestion cost savings” ($22.7 billion in 2007 dollars)[26] is taken from the Texas Transportation Institute’s (TTI) Urban Mobility Report for 2003.[27] According to TTI, this congestion cost is principally the cost of the purported additional time that automobile users would spend in traffic if there were no transit service. This is an absurd and irrelevant construct with respect to the future of urban mobility, since no such policy has been proposed.
TTI’s transit congestion cost estimate has been scaled downward by 45 percent in the most recent Urban Mobility Report (covering 2007) to $12.5 billion,[28] approximately 55 percent of which was in the New York urban area. More important, however, even the newer, more modest estimates are doubtful.
A 2004 Heritage Foundation report[29] provided a detailed criticism of the 2003 Urban Mobility Report, proving that its estimates were exceedingly high. Rather than answering with an analysis of a strategy (elimination of transit) that has not been proposed, the Heritage researchers chose to forecast the impacts based on a more plausible strategy—and one that Secretary LaHood presumably would endorse: expanding transit service in an attempt to double transit’s market share. The potential average time savings from such a development were estimated at an average 22 seconds per one-way work trip. It seems unlikely that such a minuscule difference would be perceivable, much less that it would justify the many billions of dollars in additional funding than would be required to double transit’s share.[30]
A special report by Clifford Winston of the Brookings Institution and Vikram Maheshri of the University of California, Berkeley, estimated the nationwide congestion cost savings from rail transit at $2.6 billion annually in 2000. Nearly one-half of that savings was in the New York metropolitan area. When all costs and benefits were counted, the Brookings–University of California study found that rail transit produced a net social cost of nearly $4 billion annually. Rail transit was found to produce net social benefits only in one metropolitan area only under one of two scenarios that were considered.[31]
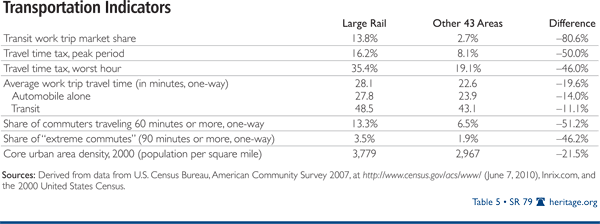
Traffic Congestion. The APTA report contends that the seven areas with “large, well established rail transit systems have…less traffic congestion.”[32] The latest INRIX traffic congestion scorecard indicates that excess roadway travel times are twice as high in large-rail metropolitan areas as in the 43 other large metropolitan areas. The excess peak period travel time (the “travel time tax”) is 16.2 percent in the large-rail metropolitan areas and 8.1 percent in the 43 other large metropolitan areas. Further, the additional time required to travel during the worst commuting hour is also higher in the large-rail metropolitan areas: 35.4 percent compared to 19.1 percent in the other metropolitan areas.[33]
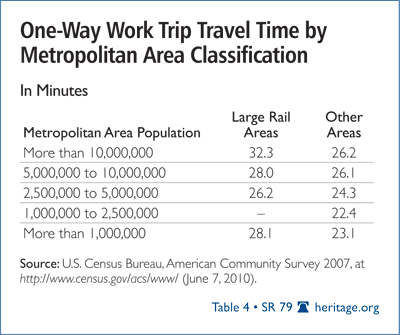
People also spend more time commuting to work in the large-rail metropolitan areas. In 2007, the average work trip was 28.1 minutes each way per day in the large-rail metropolitan areas. In the 43 other large metropolitan areas, commuters spend less time traveling to and from work than they do in the large-rail metropolitan areas (23.1 minutes one way). Workers in large-rail metropolitan areas spend an average of nearly one hour more each week commuting than is spent by workers in the 43 other metropolitan areas.[34] Work-trip travel times are longer in large-rail metropolitan areas of various population classifications. (See Table 4.)
The share of workers commuting more than one hour one way is also much higher in the large-rail metropolitan areas, where 13.3 percent of commuters travel to work 60 minutes or more in each direction (at least two hours of commuting per day). Less than one-half that share of commuters travel 60 minutes or more to work in the 43 other metropolitan areas (6.5 percent). Similarly, the large-rail metropolitan areas have a larger share of the 90-minute and over commutes (called “extreme commutes”). In the large-rail urban areas, 3.5 percent of workers have 90-minute one-way commutes. The other 43 metropolitan areas have a 1.9 percent extreme commute share.
Thus, despite their higher share of travel by transit, the large-rail metropolitan areas have worse traffic congestion and longer travel times than are found in the 43 other metropolitan areas. Two factors appear to contribute to this situation.
- Population densities are higher in the core urban areas in large-rail metropolitan areas than they are in the other urban areas.[35] The large-rail core urban areas had an average population density of 3,779 per square mile in 2000.[36] This is more than one-quarter higher than the 2,967-per-square-mile density in the 43 other urban areas. Higher population densities are associated with more intense traffic congestion.[37]
- It is possible that large-rail urban areas have insufficiently expanded their road systems. The Texas Transportation Institute indicates that urban areas that have been expanding their roadway systems have experienced smaller increases in traffic congestion.[38] Indeed, the Urban Mobility Report indicates that urban areas that increased their roadway capacity have experienced smaller increases in traffic congestion.[39]
APTA ignores longer transit travel times. There is a more fundamental problem with the APTA report: It ignores time lost in longer commutes by transit. The Texas Transportation Institute’s methodology for estimating congestion costs presumes that additional time lost in travel on transit does not have an economic cost, while additional time spent traveling by car in traffic congestion does have an economic cost. Of course, the economic cost of excess time does not vary depending on whether one is traveling by car or transit. What is seldom acknowledged is that one-way transit work trips are nearly double the length of work trips by cars: 26.0 minutes for people driving alone compared to 48.9 minutes for transit.[40] Indeed, transit commutes take longer that commuting by car in all major metropolitan areas.
APTA indicates that “rail transit can be compared to a luxury vehicle” and notes that passengers can “read, converse and rest.”[41] APTA refers to “quality transit” in which “each passenger has a comfortable seat, and vehicles are safe, clean, reliable and not too noisy.” This idyllic image of transit as a “luxury vehicle” is substantially at odds with the reality of commuting on trains in the large-rail metropolitan areas. In contrast to the APTA characterization, riders of the nation’s largest rail transit systems (such as the New York subway and the Chicago El) routinely encounter overcrowded conditions during peak periods, with riders forced to stand. Reading and resting can be nearly impossible.
In the end, lost time is lost time and has the same economic impact whether it is on rail transit or in a car.
APTA ignores the economic losses from longer travel times. Urban areas in which more people can reach an area’s jobs in a certain amount of time (such as 30 minutes) tend to be more productive. Research at the University of Paris indicates that each 10 percent increase in employment accessibility (the number of jobs that can be reached by employees in a fixed time) increases metropolitan productivity by 1.3 percent.[42]
A Reason Foundation study by David Hartgen and M. Gregory Fields looked at job accessibility in eight U.S. urban areas: Atlanta, Charlotte, Dallas, Denver, Detroit, Salt Lake City, San Francisco, and Seattle.[43] Hartgen and Fields chose a 25-minute commute period (the approximate national average one-way work trip) to evaluate accessibility and found, generally, that each 10 percent increase in the number of jobs made accessible within a 25-minute one-way commute resulted in a 1 percent increase in productivity as measured by the gross domestic product (GDP) of the urban area. They also found that if free-flow traffic conditions could be established, considerable improvements in urban productivity would be achieved because employees could get to more jobs in less time. At the same time, they showed that traffic congestion will worsen considerably by 2030 under present plans as adopted by metropolitan planning organizations.
Hartgen and Fields also noted that areas outside downtowns are becoming more important in regional economies:
Contrary to conventional planning wisdom, the research suggests that regional economies might be more dependent on access to major suburbs, malls and universities than on access to downtowns or airports. Not only are models of productivity somewhat stronger for these sites than for CBD [central business district] accessibility, but access to them has a stronger effect on regional productivity.[44]
This is an ominous finding for transit, which depends on downtown areas for much of its commuting share.[45]
By ensuring that there is sufficient roadway capacity to minimize traffic congestion, an urban area can improve its economic performance and facilitate employment opportunities for its citizens, especially those with lower incomes, and minimize unemployment.[46] Travel takes longer in the large-rail urban areas (whether by rail transit or by automobile) than in the 43 other urban areas. This means that the related costs, whether they are called congestion costs or excess travel time costs, are higher in the large-rail urban areas.
APTA ignores the association between longer travel times, unemployment, and poverty. The loss of productivity from relying on transit can be even greater than longer travel times for the employed. Unlike commuting by cars, it may be impossible to commute in a metropolitan area by transit. For example, a Federal Transit Administration study found that few low-income central-city residents in Boston could reach high-growth suburban employment areas within one hour by transit, a fact that reduces regional productivity.[47] University of California research indicates far smaller unemployment rates among African–American households where there is an automobile available.[48] This is because cars shorten commute times and broaden access to jobs throughout the metropolitan area, not just to the limited areas with adequate transit service.
Other research by the Progressive Policy Institute has shown that access to cars improves minority and low-income employment and productivity, noting that “[i]n most cases, the shortest distance between a poor person and a job is along a line driven in a car.”[49] Additionally, a Brookings Institution report concluded that, “[g]iven the strong connection between cars and employment outcomes, auto ownership programs may be one of the more promising options and one worthy of expansion.”[50] This research demonstrates that in the modern urban area, transit cannot substitute for cars for a large share of trips.
This connection between employment and automobile ownership led the Clinton Administration to ease welfare-program restrictions to make it easier for recipients to own a car. In announcing the new policy, the White House stated that:
Even in metropolitan areas with extensive transit systems, studies have shown that less than half the entry level jobs are accessible by transit. One national study found that twice as many welfare recipients with cars were working than those without cars, and 25 percent more low-income families with cars were working than those without cars.[51]
Conclusion: Congestion Costs. Work-trip travel times are longer and traffic congestion is more intense in the large-rail metropolitan areas than in the other 43 metropolitan areas. (See Table 5.) The costs of lost time (including longer travel times due to congestion and transit travel) are thus higher in large-rail metropolitan areas. Further, these longer travel times retard economic and employment growth and can result in higher rates of unemployment especially for lower-income households.
Consumer Cost Claim
The APTA report claims that rail transit saves consumers $22.6 billion per year in large-rail metropolitan areas, based on data from the Bureau of Labor Statistics (BLS) Consumer Expenditures Survey. However, the Consumer Expenditures Survey has been subject to unusual variation and may not be a reliable predictor of differences between metropolitan areas.[52] Comparable consumer expenditure data are not available for the latest year (2007–2008) because the number of metropolitan areas covered in the survey has been reduced from 28 to 18.
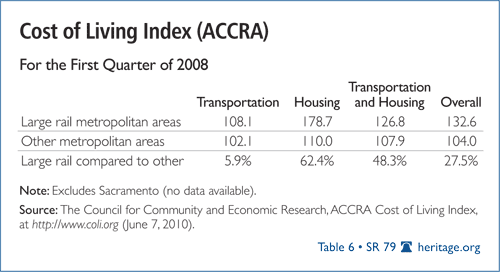
Alternative data are available from the widely used ACCRA Cost of Living Index, which covers more than 250 metropolitan areas. [53] The ACCRA Cost of Living Index indicates that average transportation costs per household are 6 percent higher in the large-rail metropolitan areas than in the other metropolitan areas.[54]
Moreover, there is a well-known tendency for households to “drive until they qualify” (for mortgages), which involves driving farther to work and spending more on transportation to afford the houses they prefer. These more distant houses are generally larger and have more room for children to play. Further, households are often attracted to more suburban locations because of lower crime rates and better schools.
This is illustrated by the ACCRA data, which show that housing is 62 percent more costly in the large-rail metropolitan areas than in the other large metropolitan areas. (See text box, “Why the Cost of Living Is Higher in Large-Rail Metropolitan Areas.”) The far higher cost of housing makes the combined cost of transportation and housing 48 percent higher in the large-rail metropolitan areas than in the other metropolitan areas. The overall cost of living is also higher in the large-rail metropolitan areas. (See Table 6.)
This reality will be important to both Secretary LaHood and Secretary of Housing and Urban Development Shaun Donovan now that they are partners in a new federal effort to combine housing and transportation costs in a new index that will better guide federal policy.
Conclusion: Consumer Costs. Transportation (and housing) costs are higher, not lower, in large-rail metropolitan areas.
Why the Cost of Living Is Higher in Large-Rail Metropolitan Areas
Virtually all of the large-rail metropolitan areas have high housing costs that are the principal contributor to their higher overall cost of living. This is not the result of their having rail systems; rather, these metropolitan areas often have more prescriptive land-use regulation policies (often referred to as “smart growth,” “growth management,” or “compact city” policies) that raise the price of housing.
More prescriptive land use policies tend to ration land for development, and this drives up land and, thus, house prices. Economists as diverse as Nobel laureate Paul Krugman, Bank of England Monetary Policy Committee member Kate Barker, and the Hoover Institution’s Thomas Sowell have noted the cost-escalating impact of stronger land-use regulations.[55] Former Governor of the Reserve Bank of New Zealand Donald Brash has written that “the affordability of housing is overwhelmingly a function of just one thing, the extent to which governments place artificial restrictions on the supply of residential land.”[56]
Further, Edward Glaeser of Harvard University and Joseph Gyourko of the University of Pennsylvania have shown that more prescriptive land-use regulation leads to greater house-price volatility.[57] Areas with more prescriptive land-use regulation were the locus of both the housing bubble and its bursting.[58] Secretary LaHood has expressed support for these land-use policies that can only lead to lower levels of housing affordability and greater traffic congestion due to their densification effects (which Secretary LaHood believes would increase transit ridership).
Housing costs in the other metropolitan areas are lower because most have responsive rather than prescriptive land-use regulation. As a World Bank report indicates, “markets…with the most responsive [land use regulation] systems have comparatively low [house price-to-income] ratios.”[59]
Roadway and Parking Cost-Savings Claims
The APTA report contends that transit saves $20.1 billion annually in roadway and parking costs.
Roadway Savings. The roadway savings were estimated at $8 billion per year that purportedly would be saved by not having to expand roadways, $7.7 billion of which would supposedly be saved in large-rail urban areas. The APTA estimate of forgone roadway costs is driven by assuming that an unreasonably large number of rail passengers would be attracted from driving cars (the “automobile trip substitution rate”).
APTA’s estimate depends on an assumption that rail systems would attract so many drivers out of their cars that substantially lower road expenditures would be required. The data bear out no such assumption.
The APTA report assumes that 60 percent of rail riders in large-rail urban areas would travel by car if there were no rail service.[60] This is a far higher figure than the experience indicates. Moreover, if there were no rail systems in the large-rail metropolitan areas, there would probably be greater employment dispersion, shorter average work trips, and fewer long commute trips, as tends to be the case in most of the 43 other metropolitan areas.
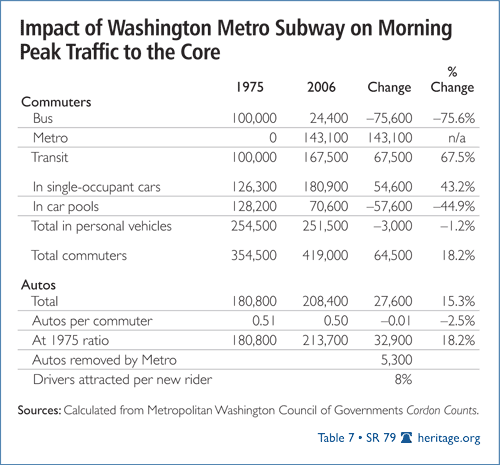
There are few data on the issue of how people would travel if there were no rail. There is, however, a single significant exception: Washington, D.C. The Washington Metro subway opened in 1976 and is the most highly patronized new urban rail system in the nation. Only New York’s subway carries more riders.
Systematic counts have been conducted of vehicles and people entering the core of Washington, D.C., which includes the downtown area, the Pentagon, and the Rosslyn, Virginia, business center,[61] since 1975, the year before the first segment of Metro opened.[62] From 1975 to 2006, the number of people commuting into the core rose 18 percent, while the number of cars entering the core rose nearly as much, at 15 percent. If it is assumed that car volumes would have increased at the same rate as commuters without Metro, then Metro reduced car traffic by approximately 5,300 vehicles.
Overall, the number of new transit passengers entering the core in 2006 compared to 1975 was 67,500. Only 8 percent (5,300) of these new passengers were former car drivers. This suggests that the APTA assumption of 60 percent is more than seven times the rate indicated by the experience of Washington’s Metro. (See Table 7.) Nearly all of Metro’s ridership was taken from buses and former car pool passengers.
Given that the Washington Metro serves the nation’s third largest core employment center,[63] it seems implausible that other new systems would perform materially better.
Parking Savings. The APTA report estimates that avoided parking costs are $12.1 billion annually, which includes $4.8 billion at residences and $7.1 billion at employment centers. Like the roadway cost savings estimate, these estimates are based on “automobile substitution rates” that are unreasonably high, which renders the parking cost estimate similarly unreliable.
Conclusion: Roadway and Parking Costs. The roadway and parking estimates are invalid because they are based on automobile driver attraction rates that are far beyond the levels indicated by experience.
Accident Cost Claims
Traffic safety is an issue of great concern, and a wide array of government and private programs have been established to make the nation’s roadways safer. The APTA report claims that avoided accident costs from transit use save $5.6 billion annually in the large-rail urban areas.
This report cannot evaluate the APTA claim because the cited documentation for per capita traffic deaths by “city” is not correct and the methodology is unclear.[64] However, even if the claim is true, people overwhelmingly choose to commute by car rather than by transit. Secretary LaHood’s accident cost claims ignore the reality that switching from cars to transit would lower the standard of living for most people because transit is so much slower and often does not go where they need to go.
American metropolitan areas are the world’s most mobile by virtue of their high levels of automobile ownership and generally superior urban roadways. This mobility, in turn, helps to make America’s metropolitan areas the most productive in the world. The Organisation for Economic Co-operation and Development found that the 12 metropolitan areas with the highest GDP per capita were in the United States and that 22 of the 25 metropolitan areas with the highest GDP per capita were in the United States.[65] People choose to commute by car because, considering all factors, including safety, greater mobility improves their standard of living.
The APTA analysis also ignores the cost of time lost from longer transit commutes, which in the large-rail urban areas would equate to nearly twice the claimed accident costs.[66]
People are free to choose cars or transit for their travel, and the car tends to be preferred by those who can afford it, whether in the United States or elsewhere. Moreover, even where transit service is intensive or improving, car ownership is increasing. For example, the share of households without cars is falling in New York City, which has by far the most intense rail transit system in the nation. Further, car ownership has continued to increase in the core county of the Portland, Oregon, metropolitan area, where rail transit has been expanded substantially.[67]
Conclusion: Accident Costs. The overwhelming majority of transit services are not time-competitive with automobiles, which is a principal reason why most people travel by automobile. The purported potential accident savings are insufficient to deter households from using cars to achieve important economic and other benefits.
Ignoring Transit’s Record of Excessive Costs
Transit is very heavily subsidized, especially compared to other modes of transportation. The federal transit subsidy per 1,000 passenger miles amounted to $166 in 2006, while federal highway revenues produced a net profit of $1.21 per passenger mile.[68] Moreover, transit expenditures have risen far faster than ridership.
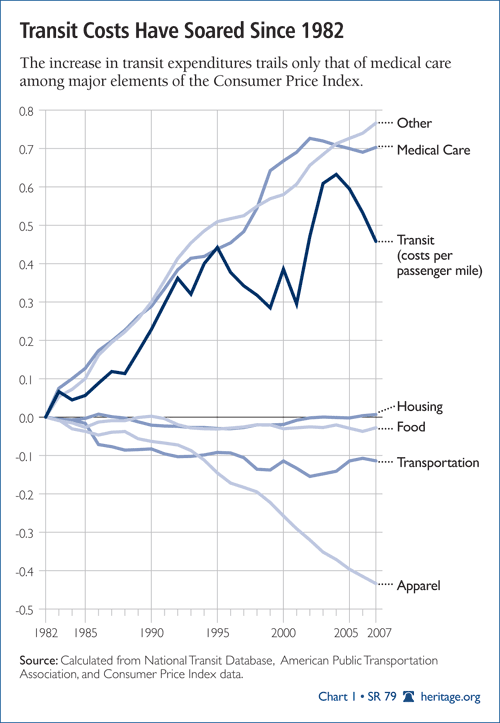
Since 1982, when the federal government granted transit access to highway user fee subsidies, transit expenditures (adjusted for inflation) have increased approximately 100 percent. At the same time, transit usage has increased less than 40 percent. If transit had maintained its 1982 cost efficiency, ridership would have increased 100 percent. Thus, each new dollar of transit expenditure produced only 40 percent in benefits. Transit’s share of urban travel has fallen more than 35 percent.[69]
Between 1982 and 2007, the increase in transit expenditures has been far greater than the increase in major elements of the consumer price index, such as housing, food, apparel, and transportation. (See Chart 1.) The increase in transit has been 60 percent of the increase in the medical care element of the consumer price index.[70]
There are serious proposals in Washington to provide more funding for transit and less for highways and, by extension, automobiles and the nation’s trucking system. Yet highways account for 99 percent of the nation’s personal mobility and a large share of its freight movement.
Indeed, with growing freight volumes and the Administration’s emphasis on substantially increasing passenger rail service on freight tracks, freight railroad reliability could suffer, with additional volumes being diverted to trucks on the highway system. There is no reason to believe that the next doubling of transit spending will produce any more value than the last.
This is not to diminish the important role that transit plays in carrying a large share of commuters to a few of the nation’s largest and principally pre-automobile downtown areas.[71] However, virtually all employment growth has been outside these areas for decades, and transit’s potential to carry a material share of commuters outside these districts is minimal.
Missing the Migration Away from Large-Rail Metropolitan Areas
People are moving away from large-rail metropolitan areas as the decades-long dispersion of the national population continues. If the large-rail metropolitan areas were as attractive to people as the APTA report indicates, the opposite would be true.
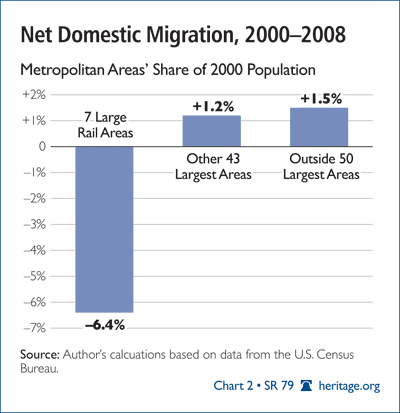
Between 2000 and 2008, a net 3,165,000 people moved away from large-rail metropolitan areas to other parts of the nation. This represented a net domestic migration loss of 6.4 percent compared to 2000 population levels. All seven of the large-rail metropolitan areas experienced net domestic migration losses to other parts of the nation. The 43 other metropolitan areas gained 1,224,000 residents from other areas of the nation, an average increase of 1.2 percent relative to 2000 population levels.[72]
However, a larger net number of people (1,941,000) moved from the large-rail metropolitan areas to areas outside the 50 largest metropolitan areas. This represented a net domestic migration gain of 1.5 percent relative to their 2000 populations. (See Chart 2.)
It is not suggested that this apparent lack of competitiveness results from the presence of large-rail systems. This net outward migration of residents seems most likely to be the result of comparative quality-of-life difficulties in the large-rail metropolitan areas, such as higher costs of living (particularly in housing), greater traffic congestion, and longer work-trip travel times.
Separating Myth from Reality
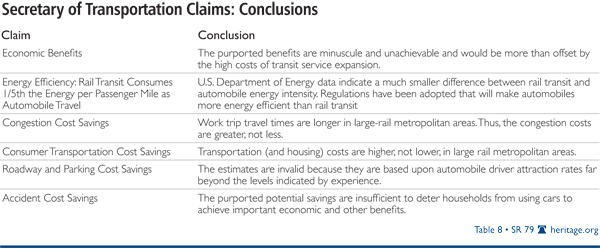
In the end, virtually none of Secretary LaHood’s or APTA’s claims stand up to scrutiny. (See Table 8.)
The reality is that the quality of life is perceived as better by households in the other metropolitan areas and other parts of the nation than in the large-rail metropolitan areas. The cost of living is lower, there is less traffic congestion, and people spend less time commuting. It is not surprising that all of the large-rail metropolitan areas are experiencing net domestic outmigration.
It is time for realistic expectations to replace the ideological and undeliverable lip service given to diverting travel from cars to transit. Otherwise, the nation could find itself spending hundreds of billions more dollars without accomplishing anything beyond making its metropolitan areas more congested while retarding productivity and economic growth. Worst of all, the result is likely to be a reduced standard of living, higher levels of unemployment, and higher poverty rates.
Members of Congress and the Administration should insist on objective and reliable information while proposing strategies that can stand the test of rigorous economic analysis. Success in meeting the challenges ahead requires no less.
Wendell Cox is principal of Demographia, a St. Louis public policy firm; a visiting professor at the Conservatoire National des Arts et Metiers in Paris; and a visiting fellow at The Heritage Foundation.
Appendix
Measuring New York City
While the APTA report is intended to contrast characteristics of large-rail urban areas in comparison to other urban areas, most of the differences are the result of the disproportionately high and overwhelming transit usage in the New York area (urban or metropolitan) and principally New York City (the core municipality).
The rail transit systems of the New York urban area account for approximately 65 percent of the rail ridership in all of the large-rail urban areas and nearly 60 percent of all rail ridership in the nation. New York’s fabled subway system accounts for nearly 20 percent of all transit usage in the United States, and four commuter rail systems[73] account for another 15 percent of transit usage. Virtually all of the subway ridership is in New York City. The overwhelming majority of commuter rail trips begin or end in Manhattan.[74] Thus, the New York rail system principally serves New York City.
New York, especially New York City, is unique. It is the home of the nation’s largest (and the world’s second-largest) central business district, Manhattan, with more than 1,700,000 jobs. The nation’s second-largest central business district (Chicago) has less than one-third as many jobs.[75] New York City is also by far the nation’s largest municipality, with a population of 8.3 million, more than double the size of second-place Los Angeles (3.8 million).
A most distinct feature is New York City’s population density. With a density of 26,400 residents per square mile, the city’s five boroughs are more than 10 times as dense as the average U.S. urban area. New York City is nearly 60 percent more dense than the city of San Francisco, more than double the density of the city of Chicago, four times the density of the city of Los Angeles, and nearly seven times the density of the city of Portland, Oregon. The borough at New York City’s core, Manhattan, is among the highest-density areas in the high-income world, with approximately 65,000 people per square mile.[76] This is nearly 30 times as dense as the average U.S. urban area.
The Suburbs of New York
New York City is surrounded by the world’s largest expanse of suburbanization.[77] More than half of the New York metropolitan area’s population lives in the suburbs. New York’s suburbs have more people than the entire Chicago metropolitan area and nearly as many people as the Los Angeles metropolitan area. Testifying to the uniqueness of New York City, the suburbs resemble the rest of the nation more than they do the city in a number of ways.
New York City’s suburbs (within the urban area)[78] had a population density of 3,300 in 2000, which is not quite 10 percent greater than the average density of the nation’s top 50 urban areas. This compares to the population density of the core city (New York City), which was 26,400 per square mile in 2000. Because New York’s suburbs have such a low density, the New York urban area had become less dense than the Los Angeles, San Francisco, and San Jose urban areas by 2000 at 5,400 persons per square mile.[79]
The Suburbs of New York: More Like Houston than New York City. Houston is often thought of as the ultimate automobile metropolitan area. Yet the suburbs of New York, despite their proximity to the city, are much more like Houston than they are like New York City even though a dense mesh of commuter rail systems covers the New York suburbs, contributing significantly to New York’s large-rail metropolitan area status.
The APTA report notes that the large-rail urban areas have much lower automobile ownership[80] rates than other urban areas. In fact, nearly all of the difference is attributable to New York City, which has 0.64 automobiles per household while the entire metropolitan area has 1.23 automobiles per household. However, the suburbs of New York City have an automobile ownership rate of 1.72 per household, which is only slightly less than the large metropolitan area average of 1.76. The suburban New York figure is much closer to the Houston automobile ownership rate of 1.77 than it is to the New York City rate.[81]
The APTA report further notes that there is substantially less driving per capita in the New York area than in other urban areas. On average, daily driving per capita in the New York urban area was 16.9 miles in 2005.[82] Within New York City, driving per capita was 8.0 miles, while in the suburbs, driving per capita was 24.5 miles. Suburban driving is only slightly below the average for the 50 largest urban areas (25.9) for 2005. The suburban New York figure is approximately the same as the Houston rate.[83]
As noted, most transit work trips in the New York metropolitan area are to or from jobs in New York City. In 2000, 53 percent of people working in New York City used transit. Nearly two-thirds of the transit commuting in New York City was to Manhattan, where 74 percent of workers used transit in 2000. Only 4.8 percent of workers commuting to the suburbs of New York used transit, a figure nearly identical to the national average of 4.7 percent.[84] The suburban New York employment market share is much closer to the Houston transit work-trip market share of 2.6 percent than it is to the New York City rate. [85]
Only 53.5 percent of New York metropolitan-area households own their own homes, compared to the national rate of 67.2 percent. However, home ownership in the New York suburbs is higher than the national average at 69.8 percent. In New York City, the home ownership rate is 33.6 percent. The suburban New York figure is much closer to the Houston home ownership rate of 63.9 percent than it is to the New York City rate.[86]
High Cost of Living. New York City has significantly higher transportation and housing costs than its suburbs. ACCRA indicates that the overall cost of living in New York City is as high as 218.8 in Manhattan and 155.8 in the outer borough of Queens, on a scale where 100.0 is average. Transportation costs are also higher in New York City. By contrast, in the three suburban areas, with their greater use of automobiles, the overall cost of living ranges from 125.4 to 152.6, with transportation costs only slightly above average.
Housing costs are far higher in New York City, ranging from 229.8 to 404.9. Housing costs are also high in the suburbs but far lower than they are in New York City, ranging from 156.7 to 240.6. (See Appendix Table 1.)
Net Domestic Migration Losses. At the same time, many people either prefer not to live in New York City or cannot afford to do so. Net domestic migration (movement within the nation) is perhaps the ultimate indicator of an area’s attractiveness to households.
Despite being by far the best-served by urban rail of any area in the nation, New York City is losing people to other areas at a rapid rate. Between 2000 and 2008, New York City lost a net 1,118,000 people[87] to the suburbs and the rest of the nation. This is an amount equal to 13.9 percent of its population in 2000. The metropolitan area (including New York City) has lost even more with overall domestic migration losses of 1,790,000, or 9.8 percent of its population in 2000.[88]
New York City : The Ultimate in Transit. New York City is the nation’s ultimate transit-friendly environment. Nearly 75 percent of commuters to the Manhattan central business district travel by transit. New York City’s other central business district, Brooklyn, has a transit work-trip market share of 58 percent, which ranks it second in the nation ahead of Chicago (55 percent).[89]
This illustrates transit’s importance to the nation’s largest downtown areas. Five other downtowns (Boston, San Francisco, Philadelphia, Washington, D.C., and Seattle) have transit market shares of more than one-third. However, downtown areas generally account for less than 10 percent of urban-area employment. Even in New York, the Manhattan central business district accounts for only 20 percent of the urban-area employment. Moreover, less than 10 percent of suburban workers in the New York area commute to Manhattan.[90] The share of trips captured by rail transit in corridors outside those leading to a few of the nation’s largest downtown areas is small and cannot reduce traffic congestion perceptively.[91]
Transit also provides another important service by providing mobility to low-income residents where it operates service. Federal data indicate that at least 70 percent of transit riders either do not have access to cars for their trips or do not have driver’s licenses.[92]
The Unlivable Livable City. New York City is a model for what Secretary LaHood calls a “livable city” with its high-density, mixed-use development, and dependence on rail transit. However, the environment of New York City—reflecting nearly four centuries of organic growth supported by a variety of transportation technologies, from walking and horses to subways and cars—cannot be replicated elsewhere. This uniqueness does not extend to its suburbs, which resemble other suburbs around the nation far more than they resemble New York City. Households moved to the suburbs of New York to achieve the American Dream of home ownership and superior personal mobility just as they moved to the suburbs of Atlanta, Indianapolis, or Portland.
Moreover, the first principle of livability is affordability. Because of its high costs, New York City may be the most unlivable city in the United States for most households. This is probably a principal reason why so many people are moving out of New York City and locating elsewhere in the country. A report commissioned by the city of New York found that “housing costs were a major reason for almost two-thirds” of those who left the city.[93]


