As gasoline prices approached or exceeded $4 per gallon around the United States, two presidential candidates and some Members of Congress have recommended that the federal fuel tax be suspended in June, July, and August of this year to provide financial relief to American drivers. Under current law, motorists and truck owners pay a federal fuel tax -- 18.3 cents per gallon on gasoline, 24 cents per gallon on diesel fuel -- into the highway trust fund, which returns these fuel tax revenues to the states according to a mathematical formula that attempts to measure each state's need for road and transit projects.
Many have criticized this proposal because of its heavy burden on the trust fund and modest benefits to drivers (about $1.98 per car per week based on federal road and fuel use statistics),[1] and a recent report by the Congressional Research Service questions whether all of the temporarily suspended taxes would be passed on to the motorist at a later date.[2] While enactment of the legislation granting such a "holiday" appears doubtful, the candidates' proposal should serve as a foundation for a comprehensive policy discussion about the many flaws inherent in the laws that mandate the federal fuel tax and allocate its revenues among the states and among competing uses, including some that have nothing to do with surface transportation.
Chief among these flaws in the administration of the fuel tax revenues are the pervasive regional inequities in the way federal highway spending is distributed to the 50 states, the District of Columbia, and the five territories. In fiscal year (FY) 2006, $33.7 billion in taxes was collected for the highway component of the trust fund, and a total of $38 billion was returned to the states and territories according to a statutory formula that determines how much each state receives.[3]
As annual U.S. Department of Transportation data reveal, many "donor" states -- notably Texas, California, Georgia, and Florida -- are shortchanged by the trust fund. In contrast, other states -- notably New York, Alaska, and Connecticut -- and the District of Columbia receive far more from the trust fund than they put into it. As Congress and the President begin to develop legislative proposals to replace the current authorization of the federal highway program (the Safe, Accountable, Flexible, Efficient Transportation Equity Act: A Legacy for Users, or SAFETEA-LU) when it expires in 2009, putting an end to these regional inequities should be a high priority. Indeed, elected officials from the donor states should withhold their support from any policy that does not make them whole by the next fiscal year.
Wealthy States Benefit the Most
While trust fund revenues reflect actual tax payments made by motorists in each state, state-by-state spending allocations from the trust fund are determined by a mathematical formula that attempts to determine some measure of "need" according to the several quantitative measures included in the formula such as miles of road and number of licensed drivers, among others. In fact, the system embodies a number of inexplicable inequities that serve to transfer billions of dollars from the southern and the Great Lakes states to the northeastern states, the mountain states, and Alaska.
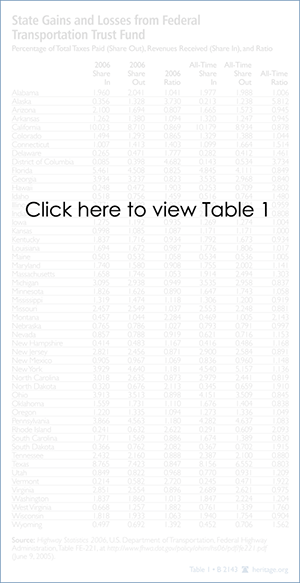
Table 1 presents Department of Transportation data[4] on the extent to which each of the 50 states has gained or lost from the federal program by comparing its share of the tax revenues paid into the trust fund to the share of trust fund spending that it has received. The first three columns provide equity information for FY 2006, the most recent year available and the first full year under SAFETEA-LU, and the second set of three columns provide equity information for all trust fund spending since the program's inception in 1956.
The first column in each set shows the share of the tax revenues that the motorists in each state paid into the trust fund in 2006, and the second column shows the share that each state received in trust fund spending obligations that year. Column three provides a ratio of the two (share-out divided by share-in); any state scoring less than 1 is a loser (paying in a greater share than it gets back), and any state scoring over 1 is a "winner" because motorists in other states are subsidizing its road building.
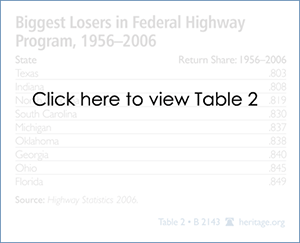
Texas was one of the biggest losers in 2006 because its motorists provided the trust fund with 8.8 percent of its revenues while receiving only 7.4 percent of spending in return. In effect, as column three notes, Texas received only an 84.7 percent payback on its investment share. Texas is also one of the biggest losers over the 50-year history of the program, receiving only an 80.3 percent share since the program's inception. Table 2 ranks the all-time nine biggest losers in the federal highway program.
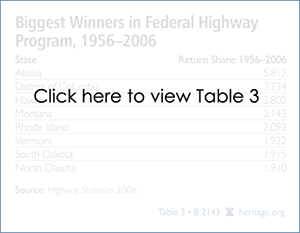
With the exception of Oklahoma, the poor performance for these states continued into 2006, as Table 1 reveals. For every loser providing a subsidy to other states, there are more winners receiving these interstate subsidies. Table 3 lists the top eight winners in the federal highway trust fund misallocations.
What Table 3 reveals is that over the past 50 years, the motorists of Alaska have received nearly six times more from the federal highway trust fund than they paid into it. Apparent from Table 1 is the exceptionally regressive nature of the misallocation of federal trust fund money. Note, for example, that the poorer southern states are subsidizing the much more prosperous northeastern states. Emblematic of this peculiar federal policy is the fact that over the past 50 years, the motorists in the poorest state in the union, Mississippi (0.919 trust fund return), subsidized those in the richest, Connecticut (1.514 trust fund return).5
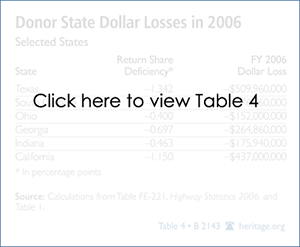
In terms of dollars and cents, the inequity can be quite costly to the states on the losing end of the flawed allocation system. Table 4 offers a few examples drawn from the 30 donor states in 2006 to illustrate how much less these states received in federal highway spending because of the inequitable nature of the federal highway formula. Column two is the percentage point difference between the share paid in and the share returned to the state from the trust fund (from Table 1), while column three presents the additional funds that each state would have received in 2006 had the state's return share equaled its share of gas tax revenues flowing into the trust fund.
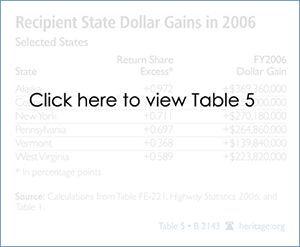
In contrast to these losing states -- all of which have been losers since 1956 -- there are 28 winners in 2006. Table 5 provides examples of the extra money that several states received in 2006 because of the inequities in the system.[5]
Not surprisingly, given all of the publicity about the infamous "bridges to nowhere," Alaska is in a class by itself in terms of excess benefits received from the highway trust fund. In 2006, Alaska's drivers paid $120.1 million in fuel taxes and received a staggering $505.4 million from the trust fund, thereby earning the distinction of achieving the most egregious inequity in the system.
Another troubling observation from Tables 4 and 5 is that the current system effectively required that Texas drivers (2004 median household income of $41,645) transfer $510 million of their federal fuel tax revenues to drivers in Connecticut ($56,617), Alaska ($52,141), and other recipient states during FY 2006.
Another perverse consequence of the donor- recipient misallocation is that most of the states on the losing end are experiencing above-average rates of population (and motorist) growth and thus have a greater need for more roads. By contrast, many of those on the winning end are generally experiencing slower-than-average population growth and thus need fewer new roads.
Between 2000 and 2006, the U.S. population as a whole grew by 6.3 percent, while donor state Texas had a 12.9 percent population increase, South Carolina had a 7.7 percent increase, and Georgia had a whopping 14.4 percent increase. Among the winning states, Connecticut's population grew by just 2.9 percent between 2000 and 2006, New York's by 2.1 percent, Pennsylvania's by 1.3 percent, and West Virginia's by only 0.5 percent. Comparing federal highway spending to a state's total population in 2006 reveals that each citizen of Alaska received benefits equal to $754, while each citizen of Texas received only $120.
Rectifying the Pervasive Inequities
As the last three columns of Table 1 illustrate, the state-by-state inequities have been a long-standing problem, and the donor states have periodically attempted to organize in an effort to correct the problem. Perhaps the most notable effort was the one undertaken between 1996 and 1998 as Congress was developing the highway reauthorization bill (passed in 1998) that became known as TEA-21. In advance of the 1998 reauthorization process, more than 20 states -- many in the South and West -- formed a coalition called STEP 21 and lobbied for a fairer system. In response, Congress made what can best be described as cosmetic changes in the bill. As the 2006 data presented in Tables 1, 2, and 4 reveal, these "changes" were largely ineffective in restoring any semblance of equity.
In the years preceding the enactment of the next reauthorization bill in 2005 (SAFETEA-LU), a similar coalition was formed. However, it was not as well organized and accomplished little.
What this pattern of failure reveals is that efforts to work within the system and modify the existing program have little to show for themselves despite halfhearted attempts to make the law fairer. While resistance from those Members of Congress whose states benefit unfairly from the program are one reason that these inequities persist, elected officials in most donor states have been timid in their efforts to seek meaningful reform and have been content to settle for a few trifling earmarks that add no additional money to their unfair formula allocations.
As an alternative to the failed work-within-the-system approach, some Members of Congress have proposed that the federal highway program be ended and that the responsibility -- as well as the right -- to collect the current 18.3-cents-per-gallon federal fuel tax be restored to the states in a process known as "turn back." With the original goals of the program fulfilled in the early 1980s with completion of the interstate highway system, the program has since become a vast spoils system of which Alaska's bridges to nowhere are only one of more than 7,000 earmark examples. Indeed, as a result of the poorly conceived reauthorization in 2005 (SAFETEA-LU), roads traveled by the typical motorists will receive only about 60 percent of the federal fuel tax revenues that these hapless motorists must pay into the system.[6]
Legislation to turn back the federal highway program to the states was first introduced by then-Senator Connie Mack (R-FL) and Representative John Kasich (R-OH) in 1996 during the congressional debate leading up to TEA-21. Since then, several other members of the House and Senate -- most recently Senator Jim DeMint (R-SC) -- have reintroduced modified versions of this bill. None of these bills has gone very far because of the reluctance of the congressional delegations from, and government officials in, the shortchanged states to push the legislation.
Recognizing that Congress might be reluctant to abandon a federal program that affords Members so many earmarking opportunities, an alternative would be to keep the program in its current form but allow states to opt out in return for an agreement to meet certain performance standards, including the maintenance and enhancement of those segments of the interstate highway system that are located within their borders. Beyond that, opt-out states would be free to pursue transportation objectives in the best interest of their citizens, while states that chose to stay in the program would continue to have the benefit of guidance from the Department of Transportation and from Congress.[7]
Conclusion
Although the current law does not expire until September 2009, all of the interested trade associations and lobbyists representing the enterprises and institutions that benefit from the tax are lobbying Congress for new schemes to raise taxes and tolls on motorists in order to fund privileged and influential constituencies. These tax-using constituencies and their lobbyists were the driving force in the development of the last reauthorization bill.
However, a well-organized reform movement could deter their counterproductive intentions during the upcoming reauthorization. Specifically, in order to end these inequities:
- Elected officials representing donor states should refuse to support any transportation policy that does not end the inequitable distribution of fuel tax revenues within one year;
- Officials at the U.S. Department of Transportation should highlight this issue as one of several key problem areas in need of the next Administration's attention; and
- Members of Congress representing donor states should support a "turn back" policy that allows each state to keep its own federal fuel taxes.
Ronald D. Utt, Ph.D., is Herbert and Joyce Morgan Senior Research Fellow in the Thomas A. Roe Institute for Economic Policy Studies at The Heritage Foundation.

