Given the political and media discussion of deficits and taxes, Americans might reasonably assume that deep tax cuts are causing today's deficits and, more important, will cause huge long-term deficits. While it is widely understood that spending on retirement programs will increase as the baby boomers retire, it is also commonly believed that the Bush tax cuts mean falling revenues in the future.
Nothing could be further from the truth. The Bush tax policies will only slightly moderate the sharp rise in the tax burden that began in the late 1990s. According to the mid-session review issued by the Office of Management and Budget, tax revenues are consuming 18.3 percent of gross domestic product (GDP), which is also the average tax burden for the past 50 years. According to long-run estimates by the Congressional Budget Office (CBO), federal tax revenues will climb to record levels even if the Bush tax cuts are made permanent and the growing impact of the alternative minimum tax (AMT) is curtailed.[1]
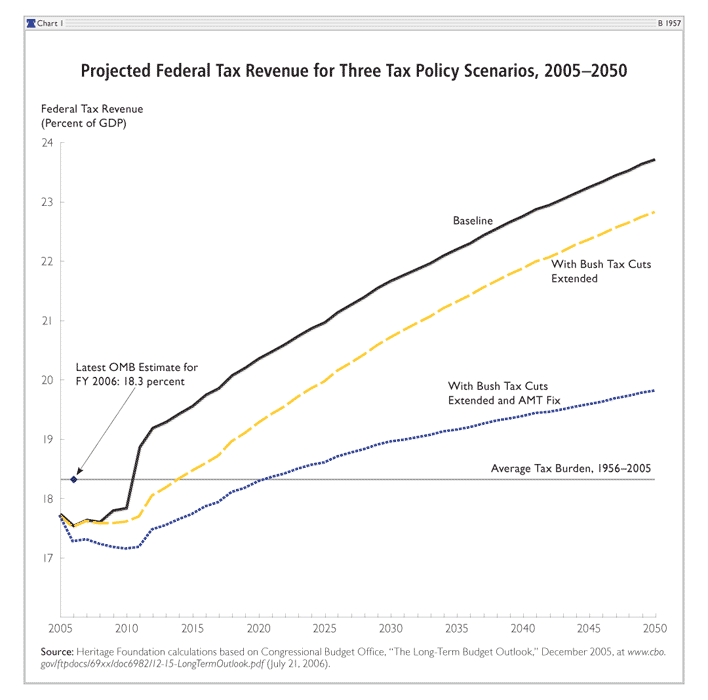
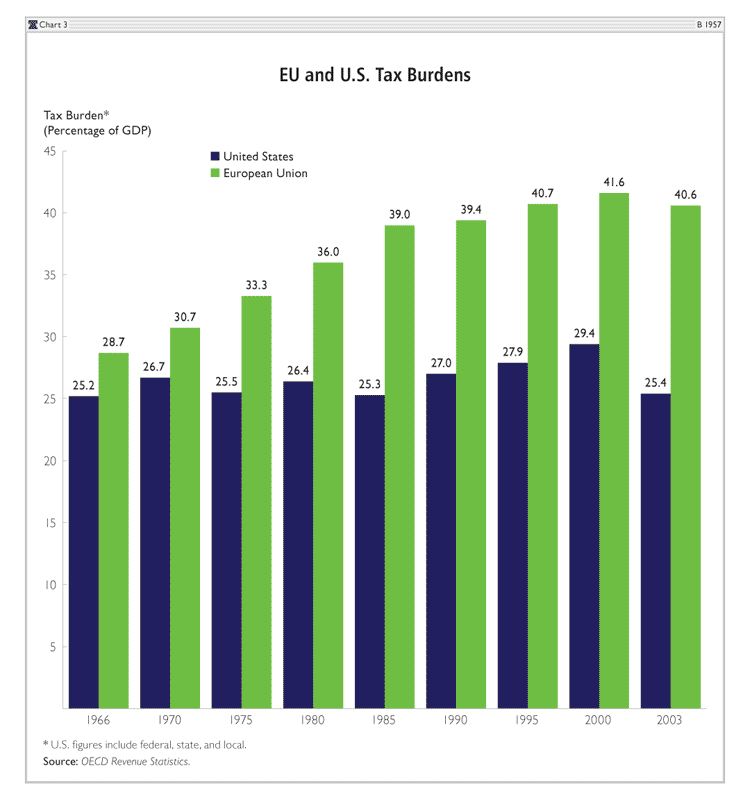
According to the CBO's long-run forecast in December 2005, federal taxes under current law will rise from 18.3 percent of GDP to nearly 19 percent within five years and reach almost 24 percent of GDP by 2050. This means that the federal tax burden on Americans, as a proportion of income, will increase by almost one-fourth. When state and local taxes are included, the U.S. tax burden will be comparable to the burden in today's slow-growth Europe.
This scenario assumes that the Bush tax cuts are not made permanent and that Congress does not mitigate the impact of the AMT. Yet even making the Bush tax cuts permanent would shave only 1 percentage point off of this projected steep rise in taxes.
The Deteriorating Fiscal Situation
Chart 1 shows the various scenarios for tax revenues.[2] In every case, long-run tax revenues are far higher than the 50-year average. Even if Congress enacts a major reform of the AMT on top of making the Bush tax cuts permanent, taxes will still exceed the historical average within a few years and continue to rise thereafter.[3]
Moreover, if recent CBO estimates are any guide, the CBO may be underestimating the long-run tax burden. In December 2005, the CBO projected federal tax receipts for 2006 at 17.5 percent of GDP, but because of surging revenues unanticipated by the CBO, tax collections for 2006 are currently on track to equal the 50-year average of 18.3 percent.
A rising tax burden has important implications for the debate over America's fiscal and economic future. For instance, these numbers refute claims that Congress permanently reduced the tax burden by lowering tax rates in recent years. In fact, Congress moderated the rise in that burden only slightly. Moreover, the swelling tax receipts demonstrate that rate reductions stimulate growth and generate offsetting revenues, which is sometimes known as a supply-side or Laffer Curve effect.[4]
The CBO numbers also show that long-run tax collections are expected to be much higher than the 50-year average. Taxes are rising, not falling, and the Bush tax changes have left the rate of increase in the tax burden largely unaffected.
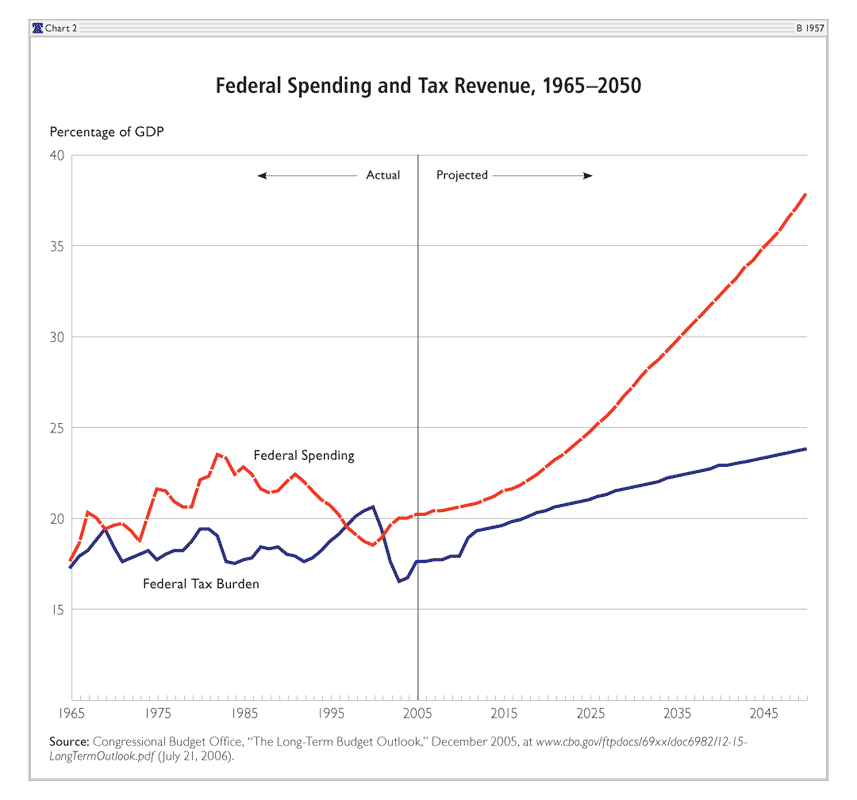
The problem is that future spending is projected to increase at an even more rapid rate, chiefly because of sharply escalating retirement spending, especially on health. As Chart 2 shows, the rise in spending, not any drop in the burden of taxation, accounts for the deteriorating fiscal situation.
A rising tax burden may well cheer those who focus only on budget spreadsheets, but it should cause grave concern among those who focus on economic growth, capital formation, jobs, and income. A rising burden of taxation means that Americans will no longer enjoy the relatively low tax burden that has been a key to America's economic growth, low unemployment, and prosperity. (See Chart 3.)
The Rising Tax Burden
The CBO projection that the tax burden will climb by almost 6 percentage points of GDP by 2050 is based on additional revenues coming from three different sources. Approximately one-third of the revenue comes from underlying economic growth. Nearly one-half of the revenue comes from the growing coverage of the AMT, and about one-sixth of the money would be generated by the repeal of the Bush tax cuts, which will happen automatically unless Congress makes them permanent. (See Chart 1.)
Revenues from Growth. The CBO estimates assume unexceptional levels of growth, averaging about 2 percent annually after adjusting for inflation, but even this modest growth rate is sufficient to generate additional revenue. Moreover, this growth means that the tax burden will rise as a percentage of GDP as revenues increase faster than the economy.
This happens because, as inflation-adjusted incomes rise, an increased share of the population winds up paying higher marginal tax rates. As the Congressional Budget Office explains:
The growth of income will both increase the amount of income taxed at the highest rates and decrease the amount of earned income tax credits claimed on low-income tax returns.… The growth of GDP and its effects on the rates at which income is taxed will increase that share by 2 percentage points by 2050 compared with the share that would result if individual income tax receipts remained steady relative to GDP. Most of that 2 percentage-point increase is commonly referred to as "real bracket creep" as an analogy to the bracket creep that used to occur as a result of inflation before the tax system was indexed.[5]
Revenues from the AMT. The biggest source of new tax revenue is the AMT. This is a "parallel" tax system that kicks in when taxpayers reach a certain income and have itemized deductions and other tax preferences under the regular tax code. (The AMT requires taxpayers to calculate their tax liabilities twice, once using the regular system and the other time using the AMT, and pay the IRS the larger of the two amounts.) With each passing year, a greater number of taxpayers will have a higher AMT liability since the AMT exemption amounts are not indexed for inflation. Indeed, the AMT exemption amounts- currently $42,500 for single taxpayers and $62,550 for joint returns-will be reduced in 2007 to $33,750 for single taxpayers and $45,000 for joint filers.[6]
As incomes rise over time, whether because of inflation or real-income growth, this will cause an increasing number of taxpayers and a growing share of taxable income to fall into the AMT trap. To the extent that incomes rise because of inflation, higher AMT liabilities are a tax increase on the same "real" income. To the extent that real incomes are rising, higher AMT liabilities are a form of "real bracket creep."
In either case, the government gets more money. As the Congressional Budget Office explains:
The AMT is not indexed for inflation; therefore, sustained inflation causes it to affect more taxpayers (as nominal income rises over time) and to claim an ever-larger share of GDP.… [B]y 2050, the effect of inflation on the AMT under current law will make receipts as a share of GDP about 2 percentage points higher than they would be if the AMT was indexed.[7]
Revenues from Repealing the Bush Tax Cuts. Notwithstanding the occasional hyperbole of both supporters and critics, the Bush tax cuts actually play only a minor role in long-run revenue projections-amounting to less than 1 percent of GDP.[8] If the Bush tax cuts were permanently extended, revenues in 2050 would still consume 22.80 percent of GDP, according to the CBO.
However, if the tax cuts are allowed to expire, revenues will rise to 23.68 percent of GDP. As the Congressional Budget Office explains:
The expiration of EGTRRA and JGTRRA [the Bush tax cuts of 2001 and 2003] contributes a bit more than 1 percentage point of the higher receipts-to-GDP ratio in 2015, declining to a bit less than 1 percentage point in 2050.[9]
A Growing Tax Burden Even with Tax Cuts and Adjusted AMT
Most Americans, and probably even most policymakers, do not realize that the future tax burden is projected to increase. Even fewer people realize that the tax burden will jump by as much as one-fourth if current law is left unchanged. As indicated, receipts are projected to rise, whether measured in nominal terms, in real (inflation-adjusted) terms, or as a share of GDP. Indeed, the tax burden is set to rise even if the Bush tax cuts are made permanent and the AMT is reformed to keep it from affecting more taxpayers or more income.
Chart 1 shows both the historical tax burden and the tax burden if the Bush tax cuts are made permanent and the AMT is fixed.[10] As mentioned above, the CBO chart understates the growth of tax revenue, and 2006 tax receipts are already close to the long-run average.
The CBO's Shaky Assumption About Growth
The CBO's assumption about future economic growth should deepen the concerns of policymakers who worry that the projected rise in the tax burden could jeopardize America's economic future. Specifically, a shortcoming of the CBO's long-run analysis is its assumption that policy choices do not affect GDP growth.
In other words, the CBO assumes that growth is an exogenous variable, meaning that the CBO assumes that real GDP will grow by about 2 percent annually, whether the tax burden remains at 18.3 percent of GDP or increases to 24 percent. The CBO also assumes that changes in marginal tax rates on productive behavior will not affect GDP growth.
This is a deeply flawed assumption. Higher tax rates on work, saving, investment, and risk-taking affect both economic performance and tax avoidance behavior. A more realistic future projection would incorporate "dynamic analysis" to adjust growth predictions for changes in the tax burden. Similar analysis could be done to measure the economic cost of rising entitlement expenditures. While there is debate about the degree of this effect, this type of adjustment would tend to reduce projections of future GDP growth and anticipated tax revenue.
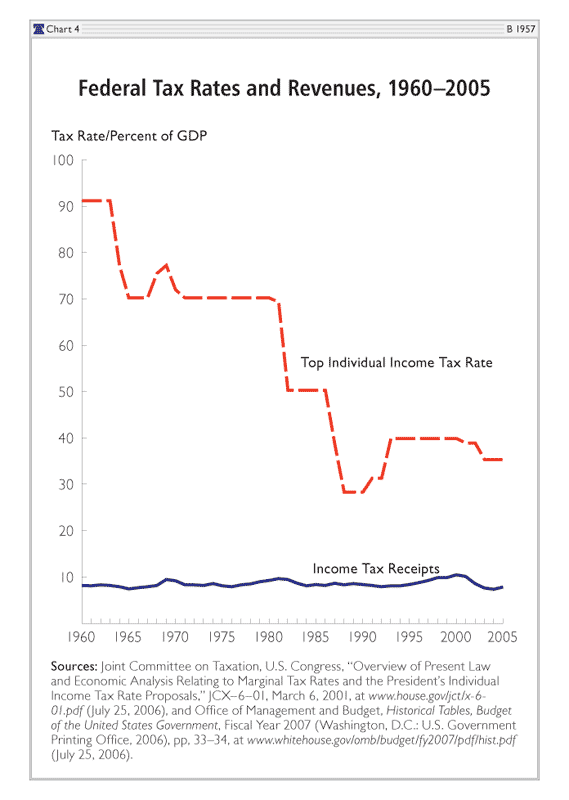
Economists differ on precisely what would happen to tax revenues as a share of GDP if rising tax rates impeded growth, but history certainly indicates that higher tax rates do not necessarily translate into higher tax revenues. Chart 4 shows that income tax rates have varied widely since the 1960s, yet income tax revenues have generally been stable at less than 10 percent of GDP.
Consequently, policymakers who assume that a rising tax burden would help close the gap between revenue and spending may end up with the worst of all worlds. Allowing the tax cuts to expire-and perhaps raising other taxes to boost revenue further-could lead to less-than-expected increases in tax revenue combined with less-than-expected economic growth.
The Real Crisis: Spending
There is a fiscal policy crisis, but it has little to do with revenues (or deficits). The real problem is the growing burden of federal spending. In the past five years, federal outlays have jumped from 18.5 percent of GDP to 20.6 percent of GDP. Regardless of how it is financed, federal spending transfers resources from the private sector of the economy to the government sector-which is why, using a broad definition, the size of government may be the best measure of the tax burden. When resources are transferred in this way, political factors rather than economic considerations increasingly shape the decisions influencing the allocation of labor and capital. The result is slower economic growth.[11]
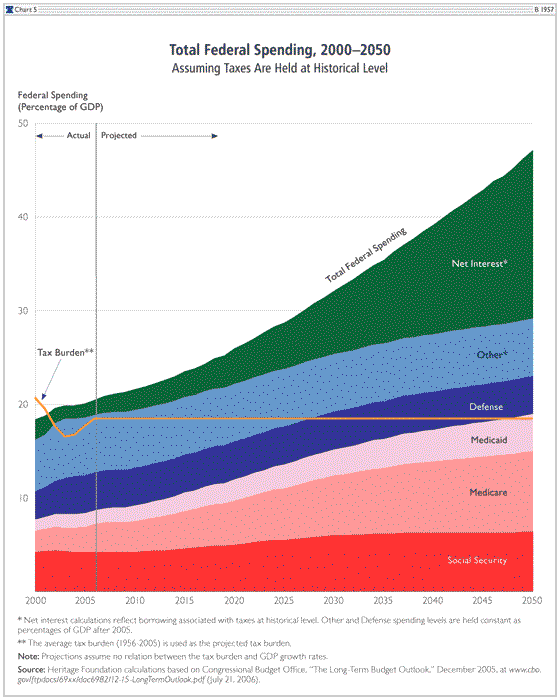
However, the recent rise in spending is just the calm before the storm. The CBO estimates that entitlement spending on Medicaid, Medicare, and Social Security, if left unchecked, will more than double from 8 percent of GDP to over 19 percent by 2050. Depending on assumptions about revenues, interest rates, and other spending, entitlement spending could push total federal spending to nearly 50 percent of GDP by 2050, compared with just over 20 percent today. (See Chart 5).
Even that disturbing projection could be a significant underestimate, because it assumes that a growing burden of government will not affect economic performance, just as the CBO assumes that higher tax burdens have no impact on growth. The CBO simply assumes long-term growth of 2 percent annually, even if the burden of government doubles.
However, Europe's stagnant welfare states offer disturbing evidence that the CBO's assumption is misplaced. Higher levels of government spending are associated with slower economic growth, regardless of whether that spending is financed with taxes or debt. This means that the CBO's long-run estimates are in all likelihood overly optimistic. If they are, and if Congress takes no significant action on entitlements, government spending could, under some assumptions, exceed 50 percent of GDP.
Conclusion
America's tax burden is rising and is projected to climb considerably above its historical average, even if the Bush tax cuts are made permanent and the AMT is fixed. Simply stated, America's long-run fiscal problems are not the result of a falling tax burden. As a percentage of GDP, that burden is set to rise to record levels. The fiscal problem and the threat to the economy come instead from rapidly escalating federal spending.
The rising projected tax burden will not reduce the economic consequences of surging spending, but it could exacerbate the economic damage. A rising tax burden will directly discourage investment and work, but an indirect effect will likely make the spending problem worse. Sometimes referred to as the "feed the beast" hypothesis, the worry is that rising revenues will relieve pressure on lawmakers to confront entitlements and reduce their resistance to other spending demands.
Some suggest, albeit unwisely, raising taxes even faster than they are projected to rise in an effort to catch up with out-of-control spending. However, the wise course is to tackle the explosion of entitlement spending and continue to enact tax reforms and reductions to hold the long-term tax burden at the historical level. That moderate tax burden has been one of the most important keys to America's economic success.
Daniel J. Mitchell, Ph.D. , is McKenna Senior Research Fellow in the Thomas A. Roe Institute for Economic Policy Studies and Stuart M. Butler, Ph.D., is Vice President for Domestic and Economic Policy Studies at The Heritage Foundation.


