Abstract: Those who think they are safe from the looming Obama tax hikes because they are not “rich” are in for a rude awakening if the Obama tax plan goes into effect. Economic growth affects everyone—whether directly or indirectly. All people’s microeconomic decisions contribute to the macroeconomic picture. When business owners hire fewer employees, the economy as a whole suffers, not only those who otherwise would have had jobs. Senior citizens are hurt the most by the imminent tax increases because retired people rely disproportionately on dividend payments for their income. Economists in The Heritage Foundation’s Center for Data Analysis explain why the Obama plan is bad for all Americans.
President Barack Obama has argued that the wealthiest Americans should take on a greater tax burden, and has promised that his tax increases would not affect those earning below $250,000 per year ($200,000 for single filers). The recent recession painfully demonstrated that in a complex, interdependent economy, this isolated effect on one group is not possible.
The effects of macroeconomic growth (or lack thereof) influence everyone in the economy. All people’s microeconomic decisions contribute to the macroeconomic picture. When business owners purchase fewer machines or hire fewer workers, the growth of the overall economy suffers. This limits the wage increases people can expect, as well as their opportunities for creating savings that fuel future investments.
Middle-income households that receive income in the form of dividends or capital gains will see direct tax increases if the Obama tax hikes pass. Even more troublesome, under the Obama tax increase, investment spending would decrease, making economic recovery more difficult. Many households, including lower-income households, would face a worsened job market, lower wages, and lower returns on their savings (investment income).
Dynamic Analysis: Obama Tax Hikes Hurt Middle Class
When tax increases reduce economic growth or create incentives for taxpayers to evade taxes, they bring in less revenue than a static (purely accounting) projection would predict. The economy is a complex system where productive resources are used by millions of people and turned into the goods and services people need and want. In a market system, where people specialize and trade, anything that affects the way people use resources and purchase goods and services will have a system-wide effect. This happens as the direct effects of changing incentives cause people to make different allocation decisions. A chain reaction ensues that causes others to make different buying and selling decisions, which causes still others to change their behavior and so on (whether they realize it directly or indirectly through higher prices or tighter budget constraints).
When upper-income taxpayers have to pay higher taxes,[1] they often avoid some of their new tax burden by reducing investment income, which leads to lower job creation. The chain reaction results in fewer opportunities and smaller salaries for lower-income workers.[2] Through lower wages or decreased job duties, reduction in job creation affects even those lower-income workers who are currently employed.
While higher taxes affect everyone, not everyone throughout the economy is affected evenly. The uneven distributional changes can be analyzed using the Center for Data Analysis Individual Income Tax Model and the IHS/Global Insight Macroeconomic Model. The dynamic effects on individual income tax filers are estimated under different policy scenarios: Current Policy (all tax cuts extended) and the Obama/Congressional Plan (tax cuts expire for upper-income filers).
This is completed in three steps by first modeling the tax policies using the traditional static (microeconomic) method, obtaining dynamic macroeconomic results from a simulation of the policy using a structural model of the U.S. economy, and then translating the dynamic forecasts of the macroeconomy under the different policies back to the microsimulation model in order to estimate what micro changes most likely led to the macro effects. For example, Obama’s proposal results in lower disposable income relative to a current policy (full extension) baseline. A lower aggregate means individuals in the economy have lower disposable income. By changing the microsimulation model’s baseline target for aggregate disposable income to the Obama Plan target, the model can show how individual filers’ incomes will change.[3]
The dynamic microsimulation gives a more accurate picture of the effect of the proposal that households in the different income quintiles will experience. A static analysis, which only estimates direct changes in tax burden, misses the indirect economic effects. Statically, a household filing jointly with no dependents earning an adjusted gross income (AGI) of about $130,000 in 2014 has an average tax increase of $1,440. But when the dynamic effects due to lower productivity are taken into account, wages and other income shows the real income loss to be $2,700 for this filer. In other words, the dynamic effects of the policy on the worker’s earnings are nearly as large as the direct tax increase. These indirect effects cannot be ignored.
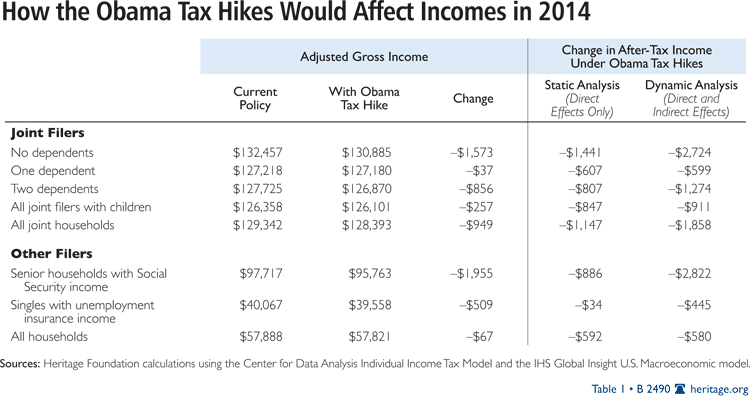
Dynamic analysis gives policymakers a much better estimate of a policy’s true economic costs and benefits. The tax increases on the rich have far-reaching consequences and create greater economic cost than the benefit of a small increase in tax revenues. They affect households in every income group and every demographic. The Center for Data Analysis modeling shows that even single filers with unemployment insurance would be hurt by the Obama tax hikes. With an average AGI of about $40,000, the average direct tax burden on this group is only about $30 (most likely due to increased taxes on small dividend holdings) but dynamic modeling shows their real burden is about $450 when indirect effects, such as those on the job market and asset markets, are taken into account.
The dynamic analysis also shows the interaction with the tax code and how a household changes tax brackets. If a policy leads a household to higher wages or investment income, the tax filers may be pushed into higher tax brackets; conversely, if a household loses income due to a growth-reducing policy the actual after-tax income loss may be lower because the tax filers fell into lower income brackets or became eligible for new tax credits. This may explain why some households with dependents lost less after-tax income dynamically than the tax increase alone would have indicated, although most were significantly worse off.
Particular Burden on Seniors
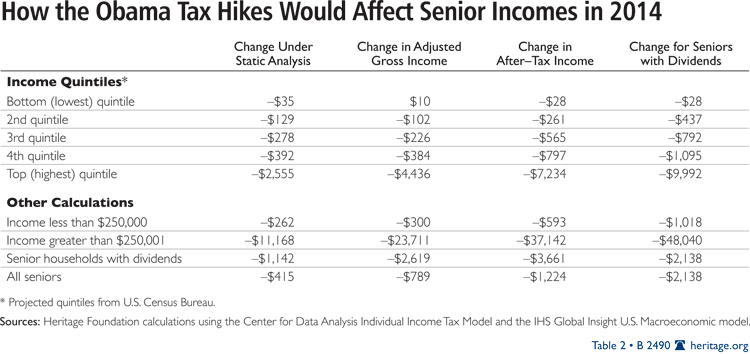
Seniors, no matter their income category, will be hurt the worst by the Obama tax hike. This is in part due to their reliance on capital gains and dividend income in their pensions. The tax increase on dividend and capital gains income will hurt seniors in at least two ways. First, it reduces their income from these sources as that income is taxed away; second, as these taxes reduce investment and economic growth, their taxable gains and dividends are lowered. This will leave seniors with an average of $1,200 less per year retirement income, and seniors who hold dividends will, on average, be left with $2,138 less per year. Households in which there is at least one senior, and which hold dividends, will lose $3,660.
Seniors in every income class will be hurt. Seniors in the bottom quintile may not be hit very hard;[4] but in the second quintile, once the effects of (slower) economic growth are taken into account, these low-income seniors would face a loss of $260 per year. In the third quintile the tax increase for seniors would be $278, but once dynamic effects are included the loss would be $565. Seniors with dividends in this quintile (50 percent of seniors in the third quintile have dividend income[5]) would be hit especially hard. Once dynamic effects are incorporated, total income losses would be $792. In the fourth quintile, the total income loss would be over $1,000 for those with dividends, and almost $800 overall for seniors. For all seniors filing with less than $250,000 reported income, the after-tax income loss would be over $1,000 for those with dividends (almost $600 overall), about half in direct taxes and half in dynamic losses.
The indirect effects of the Obama tax plan on seniors is only one example of how growth-reducing policies can hurt the very people the policy is aimed at helping. Lower-income workers and the unemployed are further examples. The most vulnerable members of society are often hurt the worst by well-intentioned anti-poverty policies. Those with limited resources have less ability to adjust to changing economic conditions, leaving them more burdened by the effects of a slower economy. The pernicious feedback of having less take-home pay further constrains their ability to adjust and find new sources of income by investing in new skills, relocation, or starting a new business.
Redistributing crumbs of a smaller economic pie to these groups only perpetuates the negative feedback loops. The many strings attached to qualifying for government funds is costly for already budget-constrained individuals. Often, they must miss work to wait in lines or fill out paperwork, reducing their ability to earn income and increasing their dependency on government funds.
Conclusion
This analysis shows that the economic harm of raising taxes on investment, small businesses, and upper-income filers affects households of all types. An economy with fewer employment opportunities results in lower wages and lost consumption and savings. Households across the income spectrum are left with lower disposable income. The attempt to raise additional revenues by raising taxes on the productive sectors of the economy, particularly during a period of recovery, harms the very citizens the revenue would be used to aid with social welfare programs.
—Guinevere Nell is Research Programmer and Karen A. Campbell, Ph.D., is Policy Analyst in Macroeconomics in the Center for Data Analysis at The Heritage Foundation.
Appendix
Methodology
Changes to the individual income tax code were simulated using the Center for Data Analysis (CDA) Individual Income Tax Model in order to estimate effects on tax revenue and the distribution of the resulting tax burden and to compare these effects to current policy estimates.
The CDA tax model simulates the effect of tax law changes on a representative sample of taxpayers based on IRS Statistics of Income (SOI) taxpayer microdata. Data for these taxpayers are extrapolated or “aged” to reflect detailed taxpayer characteristics through 2016. The data are aged for consistency with the Congressional Budget Office (CBO) baseline forecast in order to produce effective and marginal tax rate estimates with which to forecast dynamic effects of the changes in tax burden.
Two simulations were run for comparison: (1) current policy extended forward through 2016, and (2) the proposed tax increase on upper-income filers by the reversal of the 2001 and 2003 reduced top marginal rates. The tax increase includes a return of the 39.6 percent, 36 percent, and 28 percent brackets for a total of six brackets (10 percent, 15 percent, 25 percent, 28 percent, 36 percent, and 39.6 percent); the treatment of dividends as regular income, subject to those six brackets; a return of the 20 percent capital gains bracket; and the return of the personal exemption phase-out (PEP) and limits on itemized deductions (Pease).
All policy changes in the second simulation were run together as a single simulation to allow interactions between them. This simulation was then compared with the first current policy simulation (baseline).
Both simulations included recent policy changes such as: the new Making Work Pay credit; scheduled “patches” and changes in the alternative minimum tax (AMT) and education credits (Hope, Lifetime Learning, and the American Opportunity tax credit); and tax increases that accompany the recently passed health care bill. The Medicare Hospital Insurance tax is increased by 0.9 percentage point and applied to capital gains income for those with incomes above $250,000 (joint filers) or $200,000 (all others), and itemized deductions for out-of-pocket medical expenses are limited to expenses above 10 percent of AGI. The current threshold is 7.5 percent.
For each simulation, average effective tax, marginal effective tax rates, and revenue were calculated for use in the macroeconomic model. Tax burdens for demographic groups were determined based on the simulated filing status and taxpayer information.
To estimate the demographic distribution of the dynamic effects of the tax policy, the revenue and tax rates from the Individual Income Tax Model were used to calibrate the IHS/Global Insight model (GI). The dynamic results from the GI model were then used as aging targets in the Individual Income Tax Model.
CDA uses the microsimulation model to estimate the revenue effects and average and marginal effective tax rates of the proposed change in tax policy.
CDA uses the GI model to estimate the dynamic revenue effects of the same policy change. Estimated changes in federal tax revenues and marginal tax rates from the microsimulation model are used as inputs into a simulation with the GI model.[6]
The macroeconomic simulation produces an alternative forecast to GI’s Current Policy baseline forecast.[7] The Obama plan alternative forecast shows the dynamic effects of the proposed policy on GDP, prices, interest rates, employment, and personal and corporate incomes, among many other variables.
CDA analysts then used the relevant macroeconomic forecasted variables as new targets in the microsimulation model. This is accomplished using procedures similar to those developed for baseline calibration.[8] For instance, National Income and Product Account (NIPA) components of the GI model forecast of individual and business income along with price level variables, aggregate economic variables like GDP, and some NIPA budget variables from the alternative forecast are used to estimate target values for non-taxable income and gross tax return income on individual income tax returns. These targets are used in the aging process of the microsimulation to update individual and business incomes so that they are consistent with the macroeconomic model’s alternative forecast for the components of NIPA personal income.
Finally, a new simulation is run using these new aging targets, producing new revenue estimates and a new distribution of the tax burden as well as changes to individual and business income variables that reflect the dynamic effects of the proposed tax policy.
This method is a viable way to estimate the distribution of the dynamic effects of the macrosimulation because it is reasonable to assume, for the purposes of estimation in an economic forecast, the stability of certain macroeconomic variables. For example, because the share of total average income to each quintile is relatively stable over time,[9] the aggregate income target can be distributed to individual filers such that the historical quintile shares of total average income are preserved.