Three years after the 2017 Tax Cuts and Jobs Act (TCJA),REF there are clear indications that the law succeeded at allowing new business investment, creating jobs, raising wages, and increasing the size of the economy.
The TCJA’s business tax cuts have been maligned as contrary to the interests of workers.REF In reality, the corporate tax cut supports job and wage growth. Key economic indicators and pre-tax-reform economic projections show clearly that the tax cuts worked as intended with significant benefits for working Americans. These gains were undermined by trade uncertainty, costly tariffs, and in 2020, the COVID-19 pandemic.
Disentangling the effects of lower taxes, simultaneous regulatory reform, increased trade costs, growing government debt, and the COVID-19 economic shock makes any assessment of the TCJA a challenging task. However, properly assessing the 2017 tax cuts’ economic history is crucial for lawmakers who will consider whether to raise taxes in the coming years.
A key campaign pledge of candidate Joe Biden and congressional Democrats is to increase the corporate income tax and roll back parts of the individual tax cuts.REF Much of the 2017 law is also temporary. The first significant provision to expire is full expensing for business investments—one of the most important pro-growth features of the tax cuts. It begins to phase out in 2023. These proposed and automatic tax increases could make the economic recovery from the pandemic more challenging.
This Backgrounder primarily disentangles the positive effect of the TCJA from the inherited underlying economic trends and negative effects of trade uncertainty and tariffs. The link between tax changes and investment, labor markets, and economic growth have been thoroughly studied. In the vast majority of empirical investigations, tax increases hurt economic growth.REF The reverse is also true; tax cuts can help to boost economic outcomes. The TCJA was no different. In 2018, business investment increased more than was predicted, the labor market improved, resulting in annual wages of more than $1,400 above trend, and overall measures of the economy outpaced government forecasts.
What Did the Tax Cuts Do?
In December 2017, Congress passed a $1.5 trillion tax cut to spur business investment, support the long-running post-financial-crisis economic expansion, and simplify taxpaying.REF The primary permanent component of the TCJA is the 21 percent corporate income tax rate. The law lowered the federal rate from 35 percent, which had made America one of the highest corporate-income-tax countries in the world.REF The lower rate was paired with business expensing, allowing businesses to write off the full cost of investments through the end of 2022. These two provisions were the primary driving force behind projections of increased economic growth.
In a neoclassical production function model of the economy, the amount of labor (workers) and capital (tools, equipment, and buildings) determine economic output (gross domestic product (GDP)). Tax reform is generally modeled as increasing GDP by increasing the stock of capital by lowering tax rates on businesses or investment income and increasing labor supply by lowering marginal income tax rates. Permanent changes in the tax code only temporarily increase the rate of growth of new investments in capital, which increases the rate of growth of GDP. Once a new “steady state” for the economy is reached, the economy returns to its previous trend but at a higher level. This model predicts that tax cuts will temporarily increase growth rates for capital investment and output, leaving a permanently larger capital stock and economy.
As the capital stock increases, so does the capital-to-labor ratio. The additional investment allows workers to be more productive by working with more tools and more efficient tools. As worker productivity increases, wages rise to compensate for the additional output per hour of work. Although this is generally modeled as a longer-run effect, forward-looking businesses can revise their labor market expectations and accelerate projected benefits to labor. In a tight labor market, such as the one from 2017 through 2019, one should expect some earnings increases to be realized more quickly as companies compete for scarce talent, and labor exercises bargaining power to increase its share of current and expected future productivity increases.REF
Using different versions of this model, a diverse and bipartisan group of researchers calculated that the lower after-tax cost of new capital investments would increase the country’s capital stock and boost GDP by between 0.3 percent and 2.1 percent between 2018 and 2027.REF The forecasts varied in their magnitude, depending on other assumptions in the models, but almost all agreed on the positive direction of the reforms.REF
Since then, others have reviewed the historical record of the reform and come to different conclusions. Former Congressional Budget Office (CBO) Director Douglas Holtz-Eakin looked at preliminary data to show “promising shifts in top-line economic growth, business investment, and wage growth.”REFA Congressional Research Service (CRS) report reached the opposite conclusion, showing tepid growth and investment trends.REF In a response to the CRS analysis, Kyle Pomerleau explains that the evidence for the report’s “conclusions is not particularly strong.”REF Each of these early investigations, including this one, suffer from a lack of long-run data to more definitively adjudicate economic effects, which now may never be available due to the COVID-19 economic disruptions.
Tax changes have historically been linked to corresponding changes in GDP. Karel Mertens and Morten Ravn find that personal income tax cuts boost real GDP per capita by 2.5 times the size of the tax cut in the third quarter after the policy change, and that cutting the corporate tax boosts growth over a more extended period of time.REF The link between tax increases and slower GDP growth is also robust. William McBride concludes that “nearly every empirical study of taxes and economic growth published in a peer-reviewed academic journal finds that tax increases harm economic growth.”REF In another literature review, Valerie Ramey shows that a majority of academic estimates indicate that tax increases reduce GDP by two or three times the increase in revenue.REF
The TCJA also made significant changes to individual income taxes. The law reduced federal income tax rates, almost doubled the standard deduction, doubled the child tax credit, repealed the personal and dependent exemptions, and capped the deduction for state and local taxes (SALT), among many other changes.REF In every income group, Americans benefited from lower effective tax rates, receiving an estimated average tax cut of $1,400 in 2018.REF Average effective tax rates declined by 9.3 percent (1.4 percentage points).REF
Each of these changes for individual taxpayers expires at the end of 2025. In 2026, taxes will automatically increase for most Americans. The TCJA cut taxes for about 80 percent of Americans and only increased taxes for 4.8 percent.REF While the tax cuts were expected to increase the incentive to work by allowing Americans to keep a larger share of their earnings, the individual tax changes were only projected to increase labor supply by 0.3 percent, compared to a much larger increase to the capital stock (4.5 percent for equipment and 9.4 percent for structures).REF
Other Economic Events
The TCJA was not the only significant policy change affecting the economy during this time. The election of Donald Trump and a Republican Congress in 2016 represented a substantial shift in federal policy toward business activity and work. Contributing to positive economic trends was the Administration’s immediate re-orientation of the regulatory state to decrease new restrictions and mandates flowing from federal agencies.REF As discussed above, the tax cuts passed at the end of 2017 were a second positive inflection point.
But then the President embarked on an aggressive and destabilizing trade agenda that resulted in tariffs that increased the cost of business inputs and consumer products.REF Measures of trade uncertainty steadily increased through 2018, peaking in the third quarter of 2019. As uncertainty around the future of U.S. trade policy receded, actual tariffs and other restrictions took their place, increasing the cost of international trade.
Moreover, Congress increased discretionary spending caps in 2018 and 2019.REF Instead of coupling the tax cuts with spending reforms to ensure fiscal stability, Congress increased spending caps by $618 billion in the years following the tax cuts.REF Congress similarly allowed mandatory spending programs to continue their unchecked growth, causing unsustainable budget deficits to continue their expansion. Unsustainable, growing budget deficits and debt can cut into GDP growth by forcing future tax increases to cover ballooning costs and crowd out private savings and investment.REF
Non-policy-related trends and events are equally important. The positive economic trends of the decade-long recovery from the Great Recession would have continued for an unknowable amount of time. Separating ongoing trends from changes in key economic variables is important for assessing the effects of the TCJA. The historical record was also truncated by the COVID-19 health and economic crises in the first quarter of 2020, making any long-run assessment of policy changes that much more challenging. The debate over each of these effects and trends will play out over decades in academic journals. The early evidence, presented below, on investment, the labor market, and GDP growth is consistent with a long-running academic consensus that tax cuts lead to better economic outcomes.
Did the Tax Cuts Boost Investment?
A critical economic prediction following the TCJA’s corporate income tax cut and expansion of full business expensing was increased investment.REF Skeptics point to slow growth of fixed investment in 2019 to argue that business investment is not very responsive to tax changes.REF However, following the tax cuts, business investment increased more than government scorekeepers predicted.
A definitive investigation of the tax cut’s effect on investment and other economic indicators requires an impossible-to-construct, counterfactual world in which tax cuts are the only policy change. One way to try to strip away confounding variables and approximate a counterfactual world is to examine credible economic forecasts produced before and after the law passed.
The CBO, Congress’s nonpartisan scorekeeper, published 10-year economic forecasts in June 2017 and April 2018—six months before and four months after the tax cuts became law. Chart 1 shows those CBO forecasts for real year-over-year non-residential business fixed investment (a measure of nonresidential structures, equipment, and software purchases).REF In line with a lower-bound consensus reading of the economics literature, the CBO projected a significant and sustained increase in investment growth.
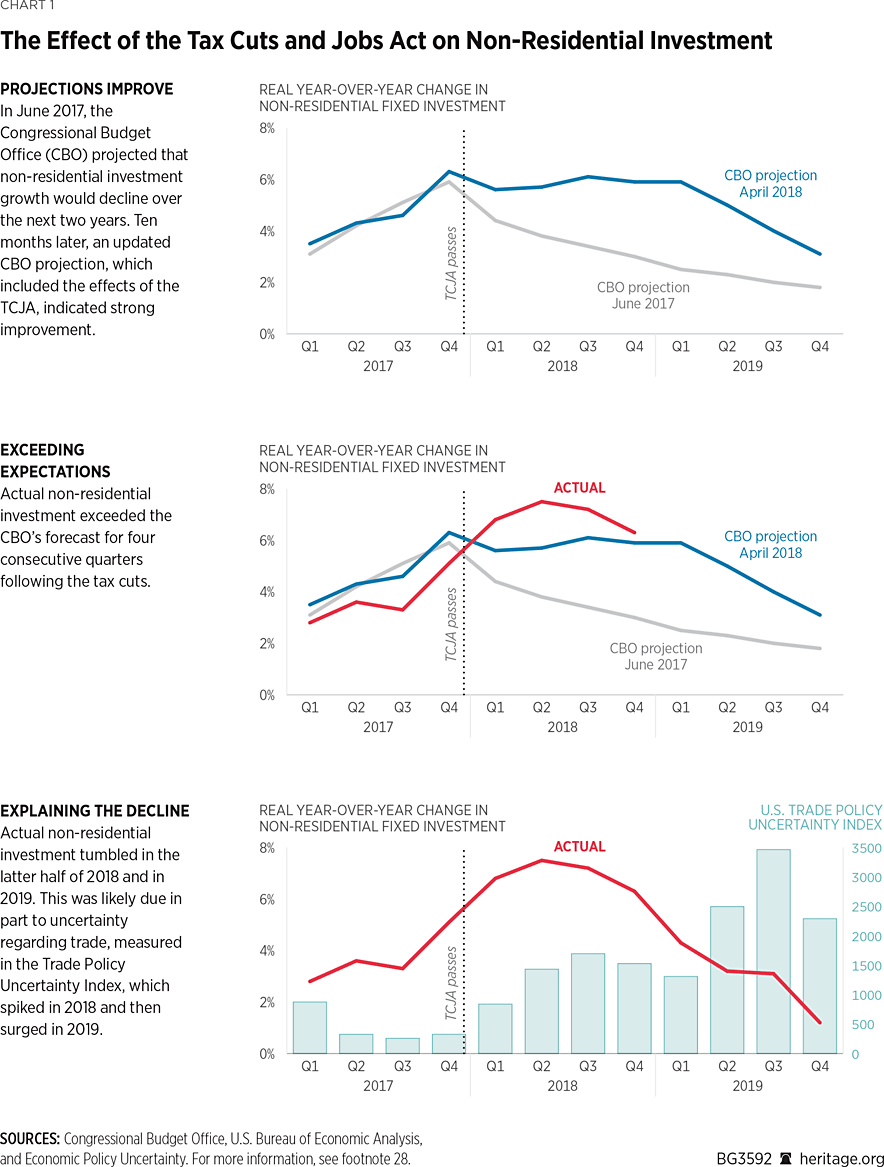
Panel two of Chart 1 adds actual investment growth to the CBO projections. Non-residential fixed investment exceeded the CBO’s forecast for four consecutive quarters following the tax cuts.REF Investment growth increased substantially above the post-TCJA forecast. But then investment growth, while remaining positive through the end of 2019, fell off rather dramatically. Panel three of Chart 1 helps to explain.
The third panel of Chart 1 adds a quarterly measure of the Trade Uncertainty Index, which “reflects the frequency of articles in American newspapers that discuss policy-related economic uncertainty and also contain one or more references to trade policy.”REF Measured trade uncertainty increased substantially through 2018, peaking in the third quarter of 2019. In the fourth quarter of 2019, investment growth fell below the CBO’s pre-TCJA June 2017 forecast. Despite trade tensions, the level of non-residential business fixed investment remained above the CBO’s pre-TCJA forecast through the fourth quarter of 2019.
Growth rates are not the only way to measure investment trends, and any analysis should distinguish investment growth rates from investment levels. Cutting taxes should only temporarily increase the growth rate of investment until a higher total capital stock level is reached. As shown in Chart 1, the CBO projected an initial boost in the growth rate of new investment, gradually falling back to the previous trend. The temporary growth rate increase leaves behind a permanently higher level of total investment.
While the Trade Uncertainty Index is not a perfect measure, it captures the view of forward-looking businesses that must price the future risk of higher costs into their investment decisions.REF In many cases, the threatened tariffs were enacted and followed by retaliatory levies from reciprocating countries. As the Trade Uncertainty Index decreased in the second half of 2019, actual tariffs took its place.REF Other factors also depressed investment in 2019. In its January 2020 economic outlook, the CBO notes that the slowdown in business investment “was due, in part, to the suspension of deliveries of the Boeing 737 MAX aircraft, rising business uncertainty about future trade policies, and reduced drilling activity.”REF
Large budget deficits and fiscal instability can also undercut the expected investment response to current-year tax cuts. Absent offsetting spending cuts, large and growing budget deficits imply future tax increases, which undercut the otherwise expected economic benefit of tax cuts.REF Smart, forward-looking investors must factor in all future tax rates to their assumed after-tax return on a new investment.
Other measures of investment and business activity in 2017 and 2018 also show significant positive shifts from previous trends:
- A measure of new manufacturers’ orders of non-defense and non-aircraft capital goods reversed a more than two-year decline in January 2017. The new orders continued to increase, spiking sharply at the beginning of 2018, and then plateauing as trade tensions ramped up later in the year.REF
- Measures of small business optimism, small business plans to make new capital expenditures, and small businesses reporting that “now is a good time to expand,” all saw spikes in early 2017 and early 2018 in the National Federation of Independent Business’s “Small Business Economic Trends” survey.REF
- In 2018, the U.S. venture capital industry—which includes investments in some of the most innovative start-up firms in the country—saw a $78 billion increase in assets under management, the largest single-year jump reported. First-time funds and new fundraising also spiked in 2018.REF
- In the first quarter of 2018, new business applications increased by almost 5 percent, a significant jump to an all-time high, only to be surpassed in the following months. Year-over-year changes in applications also show prominent spikes in early 2017 and the first three quarters of 2018.REF
Did the Tax Cuts Help Workers?
The strong pre-COVID-19 labor market was the product of two forces: (1) continued economic recovery from the 2008 financial crisis, and (2) tax and regulatory changes enacted in 2017.
Between October 2010 and February 2020, the U.S. experienced the longest consecutive streak of net job gains in recorded history.REF At the end of 2018, there were 7.5 million open jobs, which was an unprecedented 1.4 million more than the number of unemployed workers.REF During this time, the unemployment rate consistently dropped until reaching a 50-year low of 3.5 percent.REF In such tight labor markets, employers have to raise wages to retain and attract the best talent and encourage the long-term unemployed to return to the labor force. The strong labor market likely would have continued without the 2017 tax cuts, but policy changes accelerated positive trends, expanding employment opportunities and increasing wages.
Chart 2 shows that the number of job openings in the U.S. averaged just under 6 million in 2016, followed by a slight increase to above 6 million in the second half of 2017. In 2018, there was a significant and sustained increase in job availability, jumping by more than one million open jobs in the year following the tax cut. The 2019 plateau and then decline in available jobs corresponds to increasing trade tensions. (See Chart 1.) Similarly, a moving average of monthly net jobs created shows a sustained decline in net new positions from 2015 through 2016, an increasing trend beginning with strong job gains in early 2018, and then declining average net-employment gains in early 2019.REF
One study estimated that the U.S. short-term tariffs of 25 percent on certain Chinese imports could reduce jobs by more than 900,000—close to the decline in job openings during 2019.REF Other trade actions, such as additional duties on washing machines, solar panels, steel and aluminum, and certain European Union imports, cost additional jobs, undercutting the measured gains from the TCJA.REF
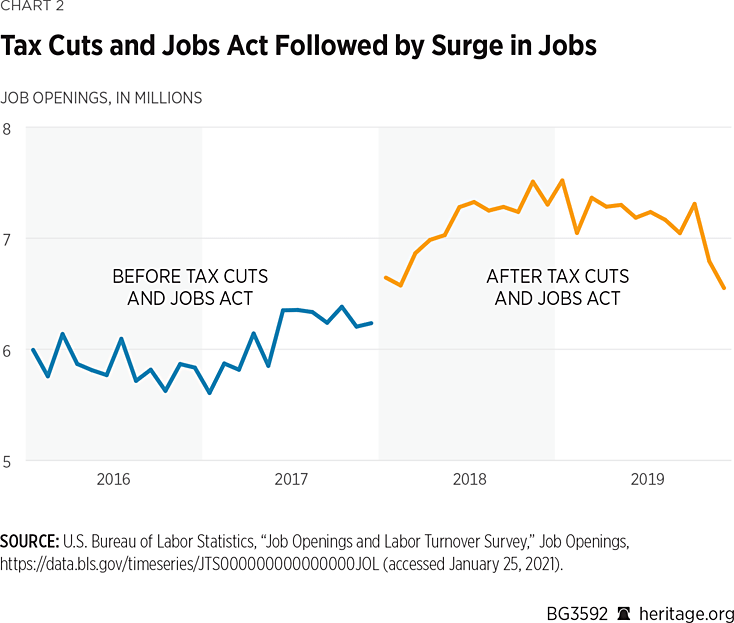
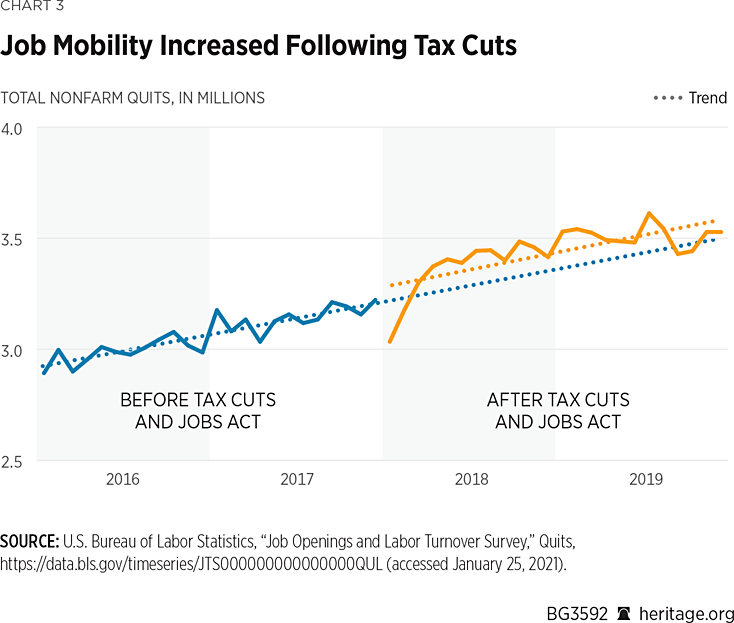
Chart 3 shows the quits rate, a measure of the number of people who voluntarily leave their jobs for better opportunities. A rising quits rate is a sign that workers are confident in the labor market and expect to find improved working arrangements. While the quits rate was rising before and after the TCJA, about 83,000 more people voluntarily left their jobs each month at the end of 2019 compared to the pre-reform trend.REF
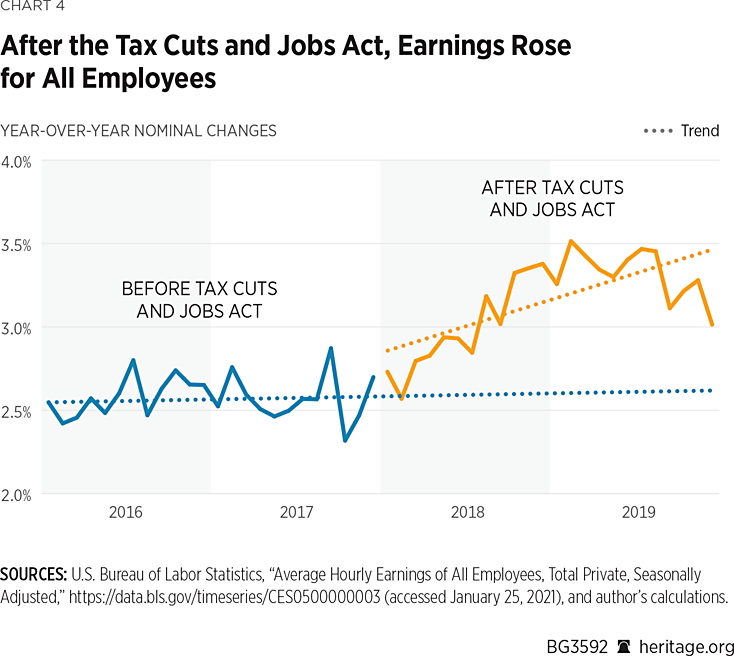
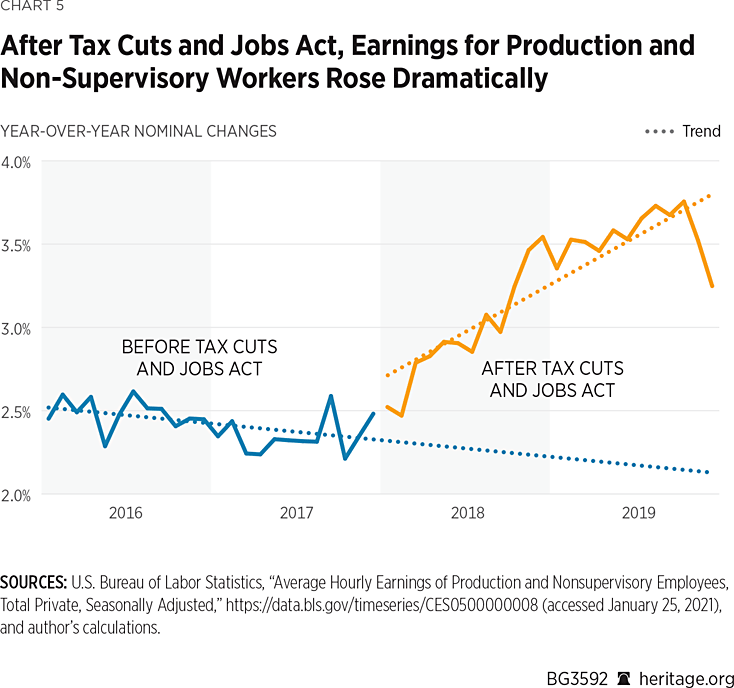
Charts 4 and 5 show elevated nominal wage growth in the years after the tax cuts. The beginning of 2018 was marked by a significant increase in the growth rate for average hourly earnings and earnings for production workers and nonsupervisory workers. Chart 4 shows that in the two years before the tax cuts, year-over-year earnings growth for all workers hovered around 2.5 percent. In the following two years, wage growth averaged above 3 percent and peaked above 3.5 percent. For production workers and nonsupervisory workers, Chart 5 shows that wage growth declined slowly through 2016 and 2017, averaging 2.4 percent. Following the tax cuts, wage growth for these workers increased to 3.8 percent by October 2019.
Faster earnings growth, even if temporary, leaves workers with higher overall wage levels and makes them better off for years to come. If one assumes that workers’ earnings would have continued to grow in line with their lower pre-TCJA trend, the wage gains experienced in 2018 and 2019 mean that workers are wealthier now than they would have been had the old trend continued.REF In March 2020, the average production and nonsupervisory worker received $1,406 in above-trend annualized earnings. For all workers, the average benefit is $1,336 in above-trend earnings.
Other measures of benefits accruing to workers in 2017, 2018, and 2019 also show significant positive shifts from previous trends:
- After a two-year slide in real wage growth, inflation-adjusted wages rebounded in the summer of 2018. Beginning in the fall of 2015, real year-over-year wage growth steadily declined through February 2017, when real wage growth leveled off around half a percent. In August 2018, real average hourly earnings growth for all private employees picked up again. Real wage growth did not quite reach the same highs experienced in 2015 as the economy finished rebounding from the Great Recession.REF
- The Bureau of Labor Statistics’ Employment Cost Index, a measure of total employee compensation that includes non-wage benefits, such as health insurance, increased consistently through 2017 and 2018.REF
- Data from the Census Bureau show that real household income reached an all-time high in 2019, growing by $4,400 (a 6.8 percent one-year increase). Between 2017 and 2019, income inequality declined as income growth among lower-income households outpaced that of higher-income households. The income gains were largest for minority households.REF
- More than 645 companies explicitly announced bonuses or increased retirement contributions as a result of the TCJA, benefiting more than 6 million workers.REF A separate analysis found that firms with the largest expected tax savings were more likely to announce bonuses and increase investment.REF
- A Mercer analysis found that the percentage of private companies offering paid family leave grew by 15 percentage points, from 25 percent in 2015 to 40 percent in 2018.REF The group PL+US (Paid Leave for the United States) noted in 2018 that the “wave of expanded paid leave policies is a tectonic shift from just two short years ago.”REF
Did the Tax Cuts Boost GDP?
Measured output increased significantly above 2017 expectations. While it is challenging to disentangle all the reasons for the stronger-than-predicted economy, it is likely that tax and regulatory changes tell part of the story.
In its Budget and Economic Outlook, the CBO presents estimates of the U.S. economy’s potential GDP, projected estimates of actual GDP, and the output gap—the difference between the two measures. Measures of potential GDP represent the economy’s estimated maximum sustainable output when the labor market is in a long-run equilibrium. The economy can produce more than the potential for short periods of time when unemployment is very low, but must eventually fall back to (or below) the sustainable trend.
In June 2017, the summer before the TCJA was signed into law, the CBO projected that actual GDP would be below potential through 2017, rise slightly above potential in 2018, and then fall back below full capacity in the following years.
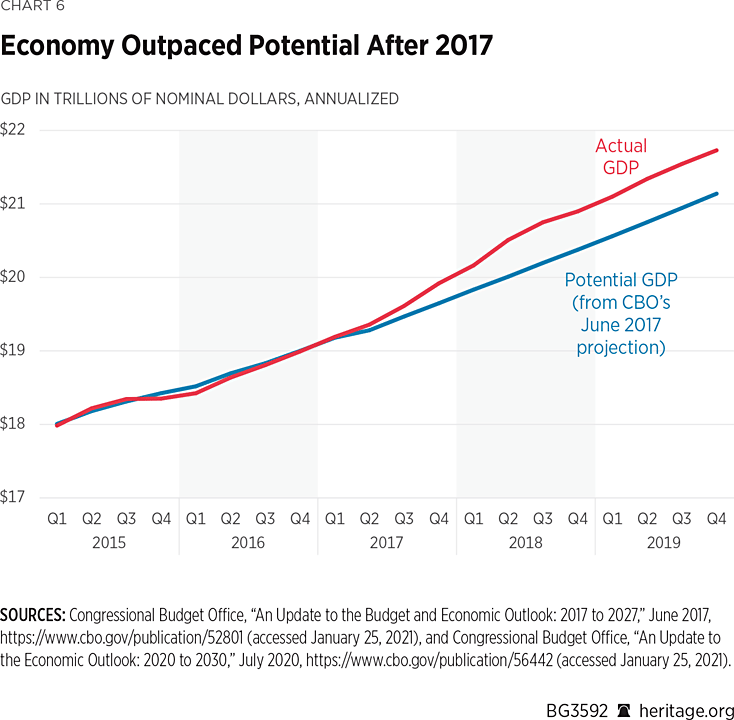
Chart 6 shows the CBO’s June 2017 measure of annualized potential GDP against actual measured GDP in nominal dollars.REF Quarterly GDP growth jumped in the third and fourth quarters of 2017, and peaked again in the second quarter of 2018 (shown as level increases in Chart 6). Consistent with other trends, these two jumps and the sustained higher output level correspond to regulatory changes implemented by the Trump Administration and then the tax cuts at the end of 2017.
Changes in projected government spending could theoretically also affect these measures of GDP, however, this does not seem likely in reality. Comparing the CBO’s June 2017 outlay projections to actual historical data shows that total non-interest outlays were lower than forecast in both 2017 and 2018, and only exceeded projections in 2019 by $57 billion.REF
The CBO’s post-TCJA April 2018 economic update projected nominal GDP would rise above the measure of potential GDP through the second quarter of 2022.REF In 2018, actual measured GDP well surpassed the CBO projections. In the second and third quarters of 2018, annualized nominal GDP was about $290 billion higher than the CBO’s most optimistic projections. Following a similar dynamic as investment trends in Chart 1, GDP growth slowed in the final quarter of 2018 as trade tensions continued to build. At the end of 2019, the level of actual GDP remained above the CBO’s post-TCJA projections, but the difference between projections and reality narrowed significantly coincidently with rising trade tensions at the end of 2018 and into 2019.
Conclusion
Understanding the Tax Cuts and Jobs Act’s economic history is crucial for lawmakers wrestling with growing deficits and an expiring tax code. Rigorous statistical analysis, with more data, might be able to tease out additional effects, but the available data show that the tax cuts were followed by increased investment, a stronger labor market benefiting workers, and a larger-than-predicted economy. It appears that trade uncertainty and costly tariffs cut into these gains.
The history of the TCJA should lead policymakers who are intent on raising the corporate income tax rate, or repealing parts of the individual tax cuts, to question their convictions. The tax cuts worked as intended. The structural reforms that encouraged higher levels of business investment do not go away in a pandemic or because of bad trade policy. Because of lower business tax rates and favorable tax treatment for new investment, firms that are investing are still investing a bit more than they would have otherwise. To protect the gains made by the TCJA and allow the post-pandemic economy to recover fully, Congress should:REF
- Maintain the 21 percent corporate income tax rate and make full business expensing permanent;
- Make the expiring individual tax cuts included in the TCJA permanent for Americans at all income levels;
- Reduce spending growth to bring outlays in line with revenue; and
- Calm trade uncertainty, reduce tariffs, and eliminate other restrictions on trade.
In the coming months and years, Congress will need to preserve the economic gains from the TCJA. Beginning in 2023, the most pro-growth reform—full expensing—begins to phase out, and three years later the lower tax rates for small businesses and individuals expire. Reversing the tax cuts would cost jobs, slow down wage growth, and shrink domestic investment.
Adam N. Michel, PhD, is Senior Analyst for Fiscal Policy in the Grover M. Hermann Center for the Federal Budget, of the Institute for Economic Freedom, at The Heritage Foundation.


