Abstract: Year after year, The Heritage Foundation’s Index of Dependence on Government documents the ever-growing number of federal aid programs and the ever-growing number of Americans who rely on government subsidies for their existence. The number of Americans who now pay no taxes has passed 35 percent. The International Monetary Fund predicts financial devastation for the U.S. by 2015 unless drastic cuts are made in the deficit immediately, and Congress has lost control of the national budget. An impending tipping point for the structure of American government and civil society is tangible. Following are preliminary estimates for the upcoming 2010 Index of Dependence on Government that all Americans should heed.
The Heritage Foundation has published the Index of Dependence on Government for eight consecutive years. For each of these eight years, the Index has signaled troubling and rapid increases in the growth of dependence-creating federal programs; and for each of these eight years, Heritage has warned of the threat that rapid growth in government dependence poses for the United States’ republican form of government, as well as for the broader civil society.
Preliminary estimates for the 2010 Index dramatically underscore the concerns of years past. According to preliminary estimates by The Heritage Foundation’s Center for Data Analysis (CDA):
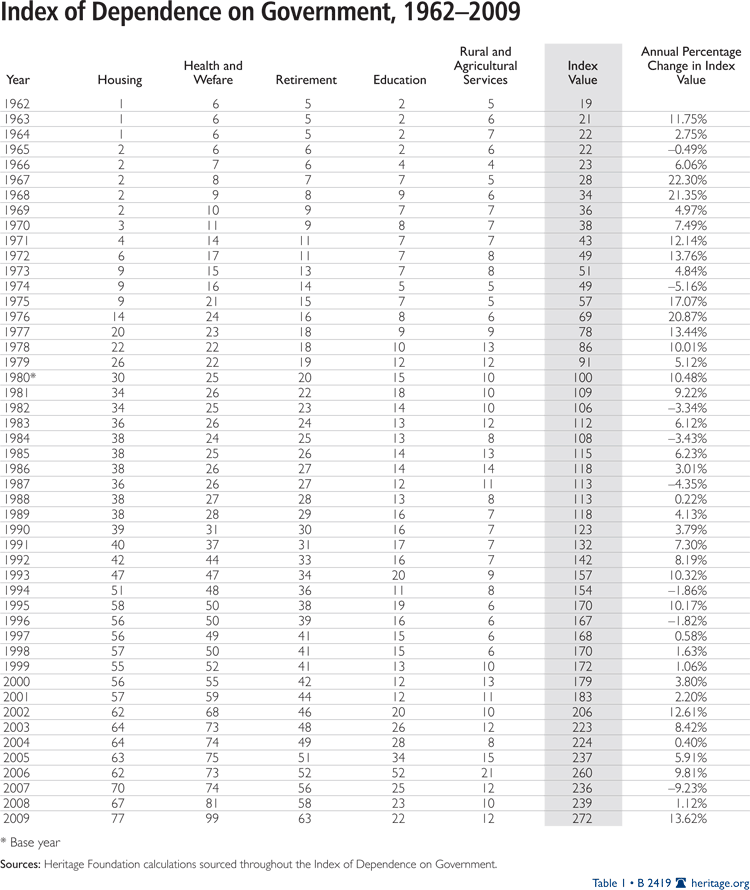
1. Americans’ dependence on government grew by 13.6 percent in 2009.
2. The Index’s dependence variables that grew the most over that past year are:
- Health and Welfare at 22 percent,
- Rural and Agricultural Services at 20 percent, and
- Housing at 15 percent.[1]
3. The increase over 2009 means that the Index has grown by 49 percent since 2001.
4. Americans’ dependence on the government was 14 times greater in 2009 than it was in 1962.
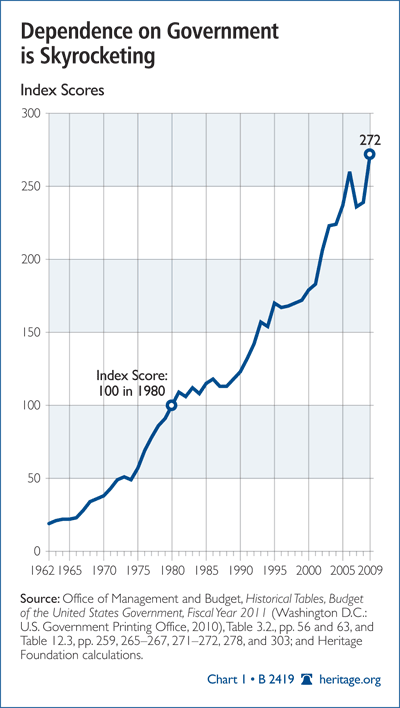
The increase in the Index of Dependence on Government during 2009 is the greatest single-year percentage change since 1976. It covers data through the end of 2009, which was a momentous year across a wide horizon of public policies. Even seasoned Washington insiders, however, might be surprised to learn just how noteworthy that year was.
Not only did the federal government effectively take over half of the U.S. economy and expand public-sector debt by more than all previous governments combined, but it also oversaw the largest single-year expansion in total government debt in U.S. history. Much of that growth in new debt can be traced to dependence-creating government programs.
U.S. spending and debt have now become of concern to the International Monetary Fund (IMF). On May 14 of this year, the IMF ranked the U.S. second among the countries that must reduce their structural deficit (caused in part by spending on dependence-creating government programs) or risk financial calamity. The IMF predicts that U.S. public-sector debt will equal 100 percent of gross domestic product (GDP) by 2015 unless immediate action is taken to cut the deficits by an amount equal to 12 percent of GDP. Even woeful Greece needs to cut its deficits only by 9 percent of its national output.
The federal government’s budget is not quite as fiscally sick as California’s, but it may not be long before President Barack Obama calls for cuts in pensions, salaries, welfare programs, and infrastructure spending as Governor Arnold Schwarzenegger is already doing in the Golden State.
How are debt and dependence on government connected? What can Americans do to avoid the embarrassments of California and Greece? In order to answer these questions, one must focus on dependence-creating government programs.
To be clear: Every person will be dependent on others many times during his or her life, and there is nothing wrong with that. People spend most of their childhoods utterly dependent on their parents, and many people will rely on caregivers during their last years. Dependence on family, neighbors, fellow members of community groups, and—yes—local government is the normal, everyday stuff of life.
When people receive aid from someone in their social circle, they are given an opportunity to repay that aid someday in a similar way. Mutual aid is the glue that binds communities together; it gives strength to families and the greater civil society. Most Americans know instinctively that creating strong communities and families is a matter of caring for each other.
When the federal government provides aid, that aid also binds the dependent person to the aid giver. This aid, however, is anything but mutual. No one expects the dependent person one day to give similar aid to the federal government. And government aid certainly does not strengthen communities and families: If Americans have learned anything about the federal welfare system, it is how effectively it undermines family structure and hollows out communities.
Worse, dependence-creating programs quickly morph into political assets that policymakers all too readily embrace. Voters tend to support politicians and political parties that give them higher incomes or subsidies for the essentials of life; but no matter how well-meaning policymakers might have been when they created government aid programs like Medicare, unemployment insurance, and subsidized housing, these same programs quickly grow beyond their mission and turn into a mechanism that creates and sustains a never-ending cycle of dependence—and entitlement thinking.
The more people there are that depend on government subsidies for much or all of their existence, the smaller the percentage of tax-paying citizens who finance those subsidies. Combined with Congress’s loss of control over the national budget, an impending tipping point is becoming increasingly likely. The Tax Foundation reported recently that the percentage of tax returns filed that required no taxes to be paid in 2008 passed 35 percent.[2] Even more of a wake-up call, the Tax Policy Center says that the percentage of all taxpaying units—single, married filing jointly, head of household, married filing separately—who paid no taxes in 2009 is close to 47 percent.[3]
Additionally, Gene Steuerle of the Urban Institute reports in the latest edition of his Index of Fiscal Democracy that the percentage of current federal revenues not already spent by previous Congresses has fallen to zero.[4] In other words, Americans’ elected representatives are essentially working for past voters.
America’s current challenges are shared by other countries around the world. Greece, Italy, Portugal, France, Spain, Britain, Japan, and a host of other countries that dramatically expanded health, retirement, housing, food, and education programs during good economic times provide glaring examples. These one-time assets are now dragging down those economies. Today, each has either fallen into a financial emergency or is dangerously close to doing so, principally because spending on these programs cannot be cut back without enormous political pain. After all, aid recipients vote too.
That is why the IMF is so concerned—and why every American should be as well. The problems that European governments have in reforming their dependence-creating programs can be viewed by Americans as a movie trailer for the problems the United States is likely to face soon unless dramatic steps are taken to rein in the growth of dependence-creating programs.
Rather than continue along the path to financial ruin, the tens of thousands of community groups and millions of families across America should once again take on more responsibility for aiding those in need. Private institutions and individuals do their work more efficiently than government and at less cost. There is also a greater likelihood that people in trouble today will get back on their feet faster with the help of neighbors and loved ones than with bureaucrats.
Not only would that assuage the concerns of the IMF, but stronger families and communities assure a stronger economy and nation in the future.
How the Index of Dependence on Government Is Constructed
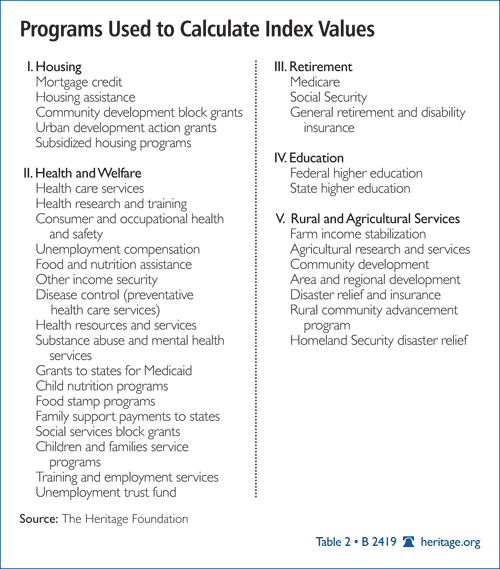
After identifying the government programs that contribute to dependence, the Center for Data Analysis further examined data from the annual budgets of the U.S. government to identify the components that contributed to variability. Temporary programs and relatively small programs are not included. The remaining expenditures were summed up on an annual basis for each of the five major categories listed in Table 2.[5] The program titles are those used by the Office of Management and Budget.
CDA analysts collected data for fiscal year 1962 through FY 2009. Deflators centered on 2005 were employed to adjust for inflation.
Indices in general are intended to provide insight into phenomena that are so detailed or complicated that simplification is required for obtaining anything other than a rudimentary understanding. The Consumer Price Index (CPI) of the Bureau of Labor Statistics, for instance, is a series based on an arbitrarily selected “basket of goods” that the bureau surveys periodically for price changes. The components of this basket are weighted to reflect their relative importance to overall price change. Energy prices are weighted as more important than clothing prices. Multiplying the weight times the price produces a weighted price for each element of the CPI, and the total of the weighted prices produces the CPI score.
The Index of Dependence on Government generally works the same way. The raw (or unweighted) value for each program (i.e., the yearly expenditures for that program) is multiplied by its weight. The total of the weighted values is the Index value for that year.
The Index is calculated using the following weights:
- Housing: 30 percent;
- Health and Welfare: 25 percent;
- Retirement: 20 percent;
- Education: 15 percent; and
- Rural and Agricultural Services: 10 percent.
The weights are “centered” on the year 1980. This means that the total of the weighted values for the Index components will equal 100 for 1980, which gives the Index a reference year from which all other Index values can be evaluated.
The 2010 Index of Dependence on Government will appear later this year, and its message will be more serious than ever.
—William W. Beach is Director of the Center for Data Analysis, and Patrick Tyrrell is a Research Coordinator in the Center for Data Analysis, at The Heritage Foundation.