Originating in late 2019 in Wuhan, China, COVID-19, commonly known as the coronavirus, has quickly spread throughout the world.REF The first known case of COVID-19 on American soil occurred in Washington State in January of this year.REF Since then, COVID-19 has spread quickly to all 50 states, with epicenters in Washington State, New York, New Jersey, and California. Altogether, the virus has infected more than 2 million people and claimed more than 130,000 lives worldwide.REF
On March 12, 2020, the World Health Organization (WHO) deemed COVID-19 to be a pandemic.REF The following day, President Donald Trump declared a state of emergency, allowing federal funding for emergency relief through FEMA to be appropriated for relief pertaining to the virus.REF Additionally, the Administration has issued stay-at-home guidelines, recently extending them through at least the end of April, recommending that all Americans avoid gatherings of more than 10, and urging older people to stay at home.REF Many states nationwide have declared states of emergency over the outbreak and, as of this writing, over 40 state governors have issued stay-at-home orders.REF
An important question for developing a defense against COVID-19 is how far the virus will spread and how many lives it will claim. Unfortunately, it is impossible to know this answer with certainty, so public officials have to rely on projections that tend to vary a great deal. A recent study from Imperial College in London suggested that the virus could kill more than 2.1 million people here in the United States.REF A study from the U.S. Centers for Disease Control and Prevention (CDC) indicated that between 160 million and 210 million Americans could contract COVID-19 and that between 200,000 and 1.7 million lives could be lost. Other models, such as those used by the Council on Foreign Relations and Harvard’s School of Public Health, have also predicted a wide range of differing outcomes.REF
A main reason for this wide range of predicted results is that all models are grounded in user-specified assumptions. In many cases, model results are highly sensitive to different assumptions. In a recent White House Coronavirus Task Force meeting, Dr. Anthony Fauci voiced concerns about the epidemiological models used to forecast COVID-19:
Models are good, but models often generate the kind of anxious question that you asked, [which] is: “How bad could this possibly get?” And as I’ve said many, many times, a model is as good as the assumptions that you put into the model. And very often, many of these assumptions are based on a complexity of issues that aren’t necessarily the same, as Dr. [Deborah] Birx said, from one country to the other.REF
In other words, differences in projections do not just simply result from using different models; the same model can provide vastly different results depending on the assumptions used. This Backgrounder uses one common type of model to explore the sensitivity of model-based epidemiological forecasts of COVID-19 to different assumptions. We do so by making use of a publicly available epidemiological model that has been released for modeling outcomes pertaining to COVID-19.REF
Modeling COVID-19 Spread
The model used in this Backgrounder is a compartmental epidemiological model, structured around the idea of the classic susceptible, exposed, infected, and resistant (SEIR) model.REF Full details of the model are described in the appendix. This Backgrounder explores differences in forecasts as a result of changes to assumptions in the model.
The model requires a number of basic assumptions about the virus, including specification of the number of individuals initially infected, the virus’s incubation period, duration of various forms of the infection, length of hospital stay, and time from admission to a hospital’s intensive care unit (ICU) to death in the hospital’s ICU. We began our simulations on the morning of April 13, 2020, and assumed 557,590 people were initially infected and 22,109 dead, in accordance the John’s Hopkins Coronavirus Tracker.REF We assumed an incubation period of 5.1 days, which has been indicated by medical researchers to be the median incubation period of the virus with a range of two to 14 days.REF We assumed a duration of mild infections for 14 days as has been suggested to be the case by the WHO.REF Further, depending on the simulation, we assumed that either 81.5 or 84.2 percent of the cases were mild and that 13.8 percent were severe, assumptions in line with data from a study of the outbreak in China.REF Finally, we assumed that the duration of the typical hospital stay was approximately 10 days, and that patients who would succumb to the illness would do so after 7.5 days in the hospital’s ICU, which are assumptions also in line with the recent medical literature.REF
We performed a variety of simulations, keeping the above parameters fixed while altering additional assumptions regarding mortality rates, asymptomatic cases, transmission rates, and the percentage of symptomatic cases that warrant ICU admission. The next three sections of this Backgrounder discuss the sensitivity of the model to these additional assumptions. The main outputs of the model presented here are the projected number of cases (which the model classifies as varying degrees of severity) and fatalities due to the disease.REF
Our results are not intended to be predictions. They are merely illustrations of the wide range of results that these models produce when users make reasonable changes to just some of the many assumptions that the models require.
Intensive Care Unit Mortality Rate for Critical Cases
As it is still largely unknown how many patients will die due to a particular illness, epidemiological models require assumptions about mortality rates. This SEIR model specifically assumes that deaths occur in the hospital’s ICU and requires that the user specify a mortality rate for patients admitted to the ICU. Holding all other variables mentioned above constant, we used the model to simulate the coronavirus disease spread through August 1, 2020, under a variety of ICU mortality rates.REF In these simulations, we assumed that 13.8 percent of the symptomatic COVID-19 cases were severe, and 2 percent of the cases were critical.REF We view this assumption as a reasonable representation of the current state of affairs where people, particularly high-risk individuals, are aware of the dangers of the disease and adhere to social distancing guidelines. Our results regarding death due to COVID-19 are illustrated in Chart 1.
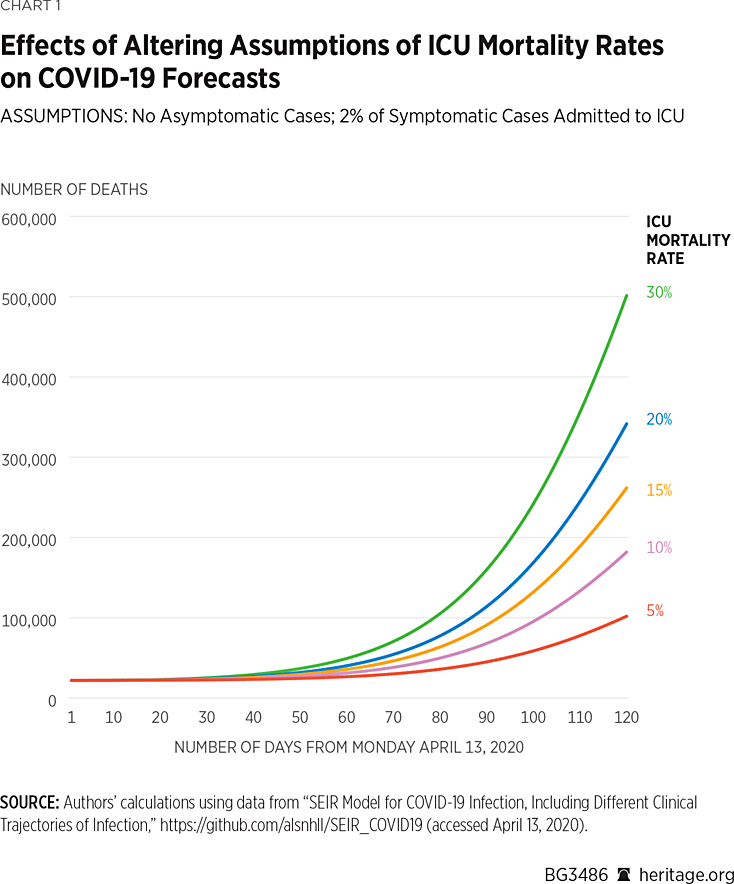
Under all five scenarios, the model projects that by August 1, 2020, approximately 42 percent of the population will have been infected with, or have recovered from, COVID-19.REF As Chart 1 illustrates, under a 5 percent mortality rate, the model finds there will be approximately 77,800 deaths due to COVID-19 by August 1. However, assuming a 15 percent mortality rate, the model finds that there will be approximately 190,000 deaths over this time period. In the most extreme scenario modeled, under a 30 percent mortality rate, the model finds that there will be approximately 357,000 deaths by August 1. Altogether, these simulations make it apparent that assumptions about ICU mortality rates can vastly affect projections of deaths due to COVID-19 made by the model.REF
Moreover, these results are sensitive to the percentage of critical cases themselves. Chart 2 contains results assuming a higher percentage of critical cases (4.7 percent) as was indicated to be the case in China by the Chinese Center for Disease Control and Prevention.REF
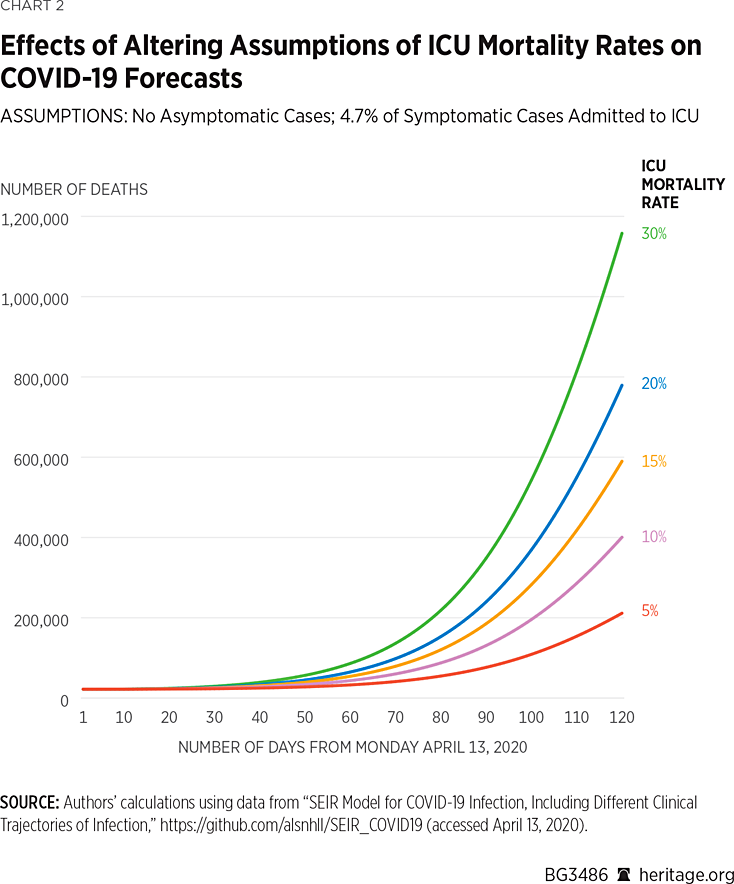
These simulations find that under this 4.7 percent mortality rate, there will be approximately 154,100 deaths due to COVID-19 by August 1.REF Assuming a 15 percent mortality rate, the model finds that there will be approximately 418,000 deaths over this time period, and assuming a 30 percent mortality rate, the model finds that there will be approximately 814,000 deaths by that time. All five simulations find that 42 percent of the overall population will have been infected or have recovered from the disease by August 1, 2020.
As one would expect, higher a priori assumed mortality rates result in more fatalities. Regarding COVID-19 specifically, higher mortality rates have been observed in older and chronically ill patients.REF Although the model is not able to explicitly assign age-specific mortality rates, a primary implication of these results is quite clear—if critical cases consist of younger and healthier patients, then lower ICU mortality rates will almost surely be observed, thus lowering the number of projected deaths from COVID-19.
Asymptomatic Cases
The previous series of simulations of mortality rates both specifically assumed that there are no asymptomatic cases of COVID-19 at present in the population. Although precise data on asymptomatic cases of COVID-19 are scarce, there is a significant amount of evidence suggesting that asymptomatic cases may indeed be present in the general population. In particular, a number of people not exhibiting symptoms have tested positive including Senator Rand Paul (R–KY).REF A “mass-test” of passengers aboard the Diamond Cruise ship also found that over half of the passengers who tested positive were not exhibiting symptoms.REF
Consequently, we ran a variety of simulations allowing asymptomatic COVID-19 cases to be present with varying prevalence. Our first set of simulations, depicted in Charts 3 and 4, are based on the assumption that 2 percent of symptomatic cases warrant ICU admission. These simulations also assume a mortality rate of 15 percent among patients admitted to the ICU, the mid-level assumption of our previous simulations.
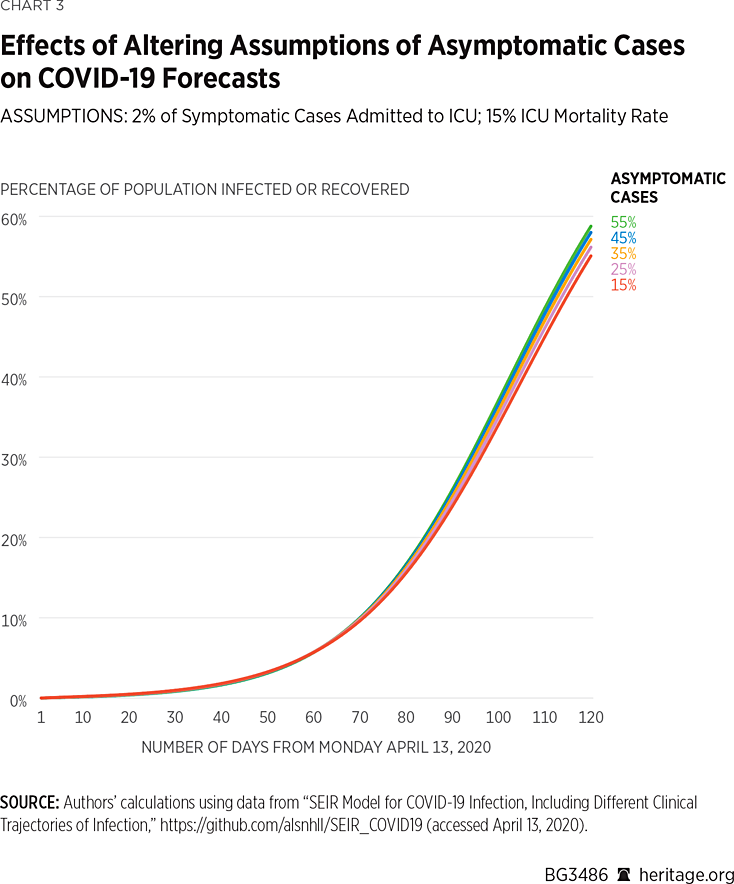
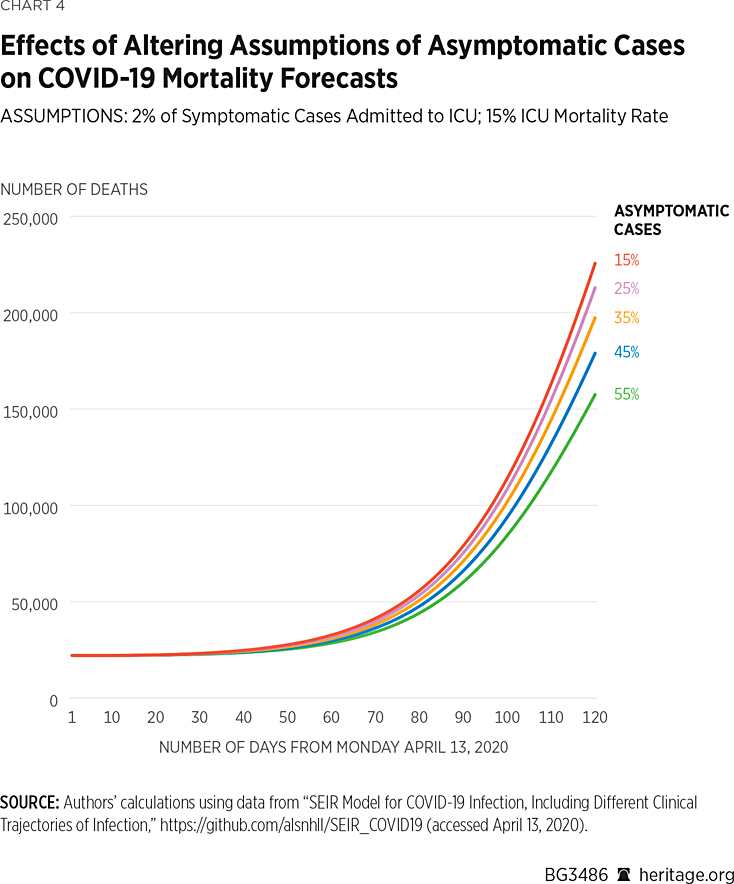
As Charts 3 and 4 illustrate, changes to assumptions about the prevalence of asymptomatic cases can vastly affect projections about infection rates and mortality. For example, under the assumption that 15 percent of the population with COVID-19 does not exhibit symptoms, the model projects that there will be approximately 164,000 deaths by August 1 of this year, and that 45 percent of the American population will have been infected, or recovered from, the virus. Assuming a more than doubled asymptomatic case rate of 35 percent, the model finds that there will approximately be 145,000 deaths by August 1 of this year, and that 47 percent of the American population will have been infected or have recovered. Under the highest assumption of asymptomatic cases (55 percent of all COVID-19 positive cases), the model finds that approximately 118,000 Americans will die from the virus, and that 49 percent of the population will have been infected or have recovered.
Using the same assumptions, but again altering the mortality rate within the ICU to 4.7 percent, we find the following results depicted in Charts 5 and 6:
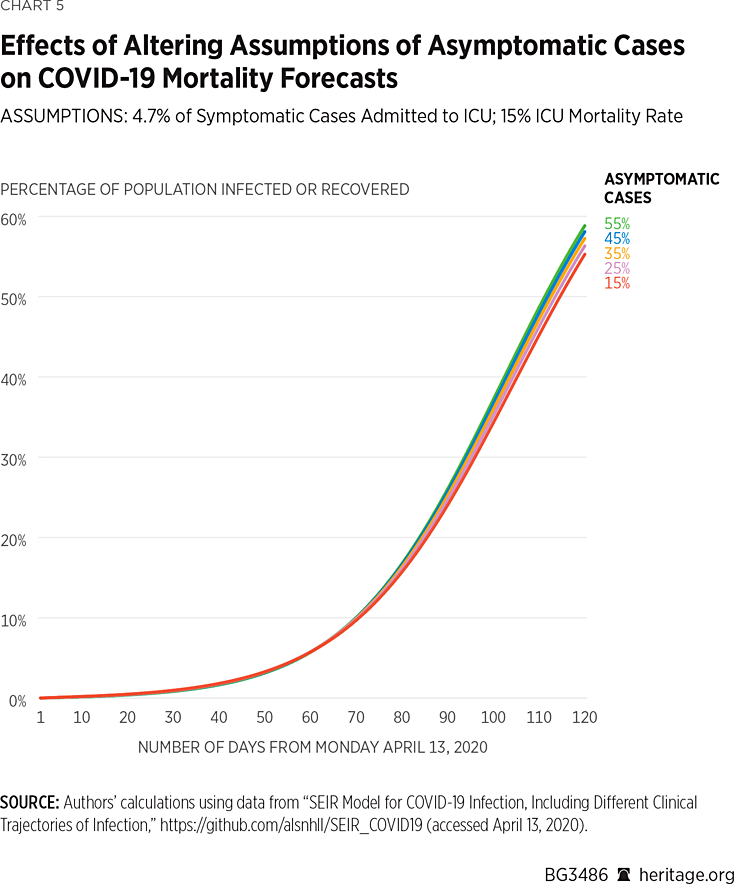
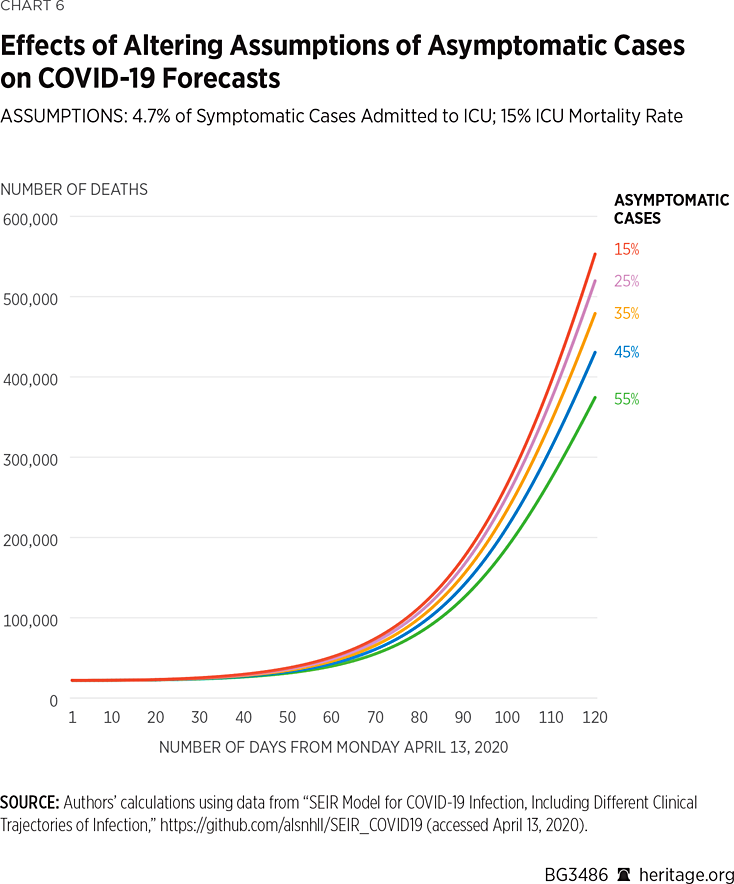
As illustrated in Charts 5 and 6, when 15 percent of the COVID-19 cases are asymptomatic, the model projects that there will be approximately 394,000 deaths by August 1 of this year, and that 45 percent of the American population will have been infected by, or have recovered from, the virus. Under the assumption that 35 percent of the COVID-19 cases are asymptomatic, the model projects that there will be approximately 345,000 deaths by August 1 of this year and that 47 percent of the American population will have been infected by, or have recovered from, the virus. Lastly, assuming that 55 percent of all COVID-19 positive cases are asymptomatic, the model finds that approximately 274,000 Americans will succumb to the virus, and 49 percent of the population will have been infected or recovered.
Overall, these simulation results make it apparent that it is fundamentally important to understand the asymptomatic prevalence of COVID-19 in order to be able to accurately predict disease spread and overall mortality. The main takeaway from both sets of results, however, is that the model projects a very wide range of COVID-19 deaths using a reasonable range of assumptions for asymptomatic cases.
Transmission Rates
Not all communicable diseases have the same level of contagiousness. As a result, yet another fundamental assumption made in epidemiological models involves the specification of how contagious the disease being modeled actually is. A statistic known as the basic reproductive number R0, defined as the expected number of cases resulting from one case in a population where all individuals are susceptible to infection, quantifies the level of communicability of an illness. Different diseases vary in their basic reproductive number. For example, Middle East Respiratory Syndrome (MERS) is known to have a R0 value ranging from 0.3 to 0.8, pertussis is known to have an R0 value of approximately 5.5, and measles has been claimed to have an R0 value ranging from 12 to 18.REF There is a wide range of estimates of R0 for COVID-19, currently ranging from 1.4 to 3.8.REF
As with any disease, assumptions about R0 are actually based on more fundamental assumptions about the transmission rates of the different degrees of infections (asymptomatic, mild, severe, and critical infections). Severe and critical infections can be assumed to be reasonably well contained as such cases involve hospitalization and are therefore isolated from the general population. Nevertheless, as a number of health care workers have contracted COVID-19 from such patients, the transmission rate under such circumstances is still non-zero.REF Mild cases, on the other hand, do not involve hospitalization and we therefore assumed that they are more capable of being transmitted than the severe and critical cases that are isolated within hospital settings. Although COVID-19 patients with mild symptoms are advised to isolate themselves at home, they may not successfully do so, especially from their own families.
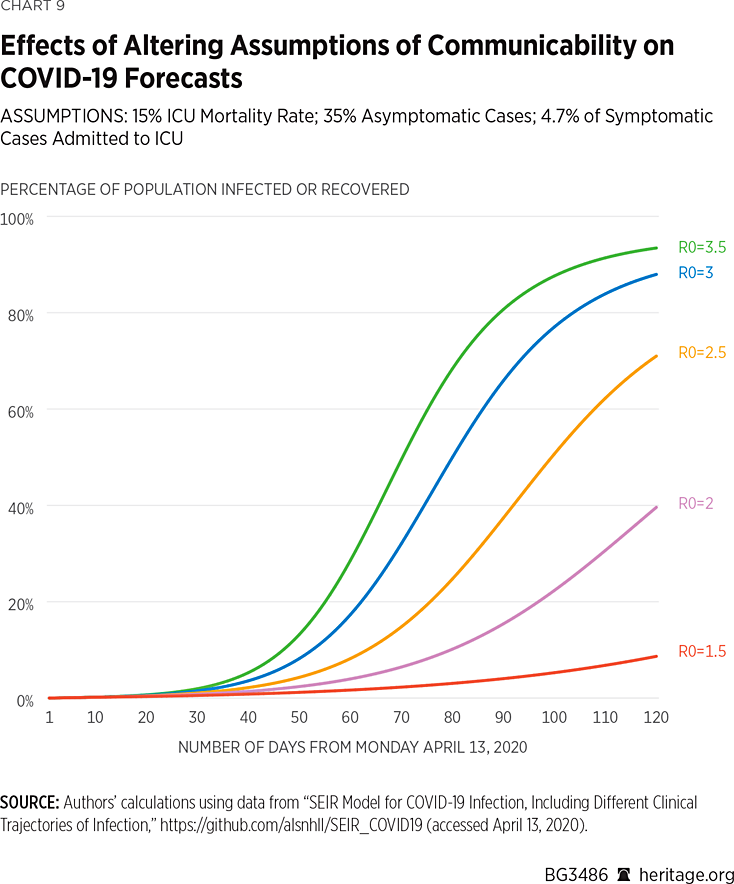
We therefore assumed that infections involving hospitalization are well-isolated and thus have low, but non-zero, transmission rates. On the other hand, we varied transmission rates amongst patients exhibiting mild symptoms to yield estimates of R0 within the recommended range of basic reproductive numbers for COVID-19. For this set of simulations, presented in Charts 7 and 8, we also kept mortality rates in the ICU at 15 percent, and the percentage of asymptomatic cases fixed at 35 percent, the mid-level assumptions made in our prior simulations.
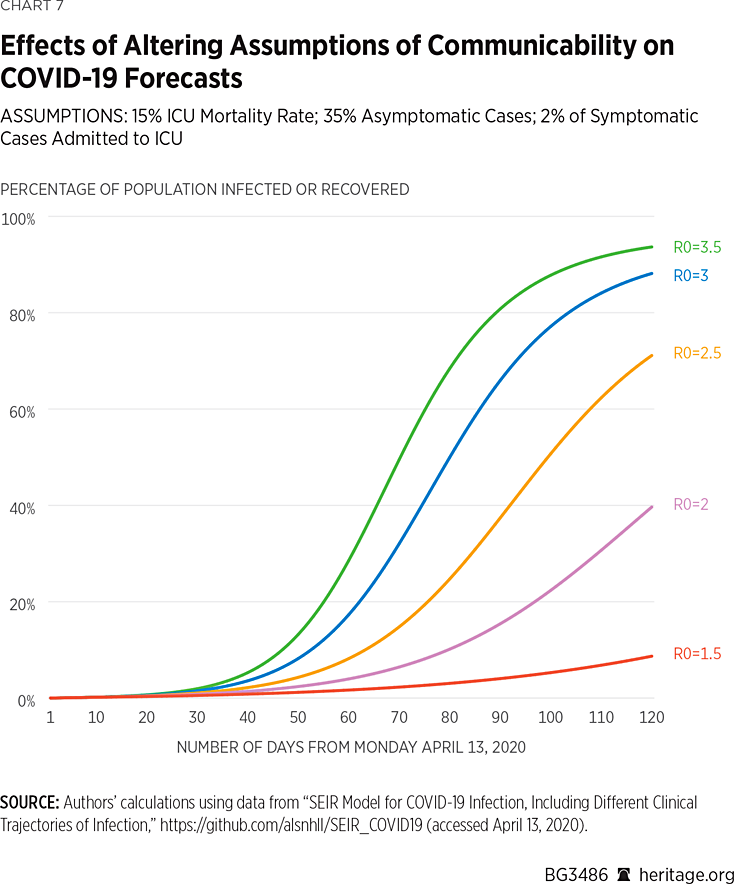
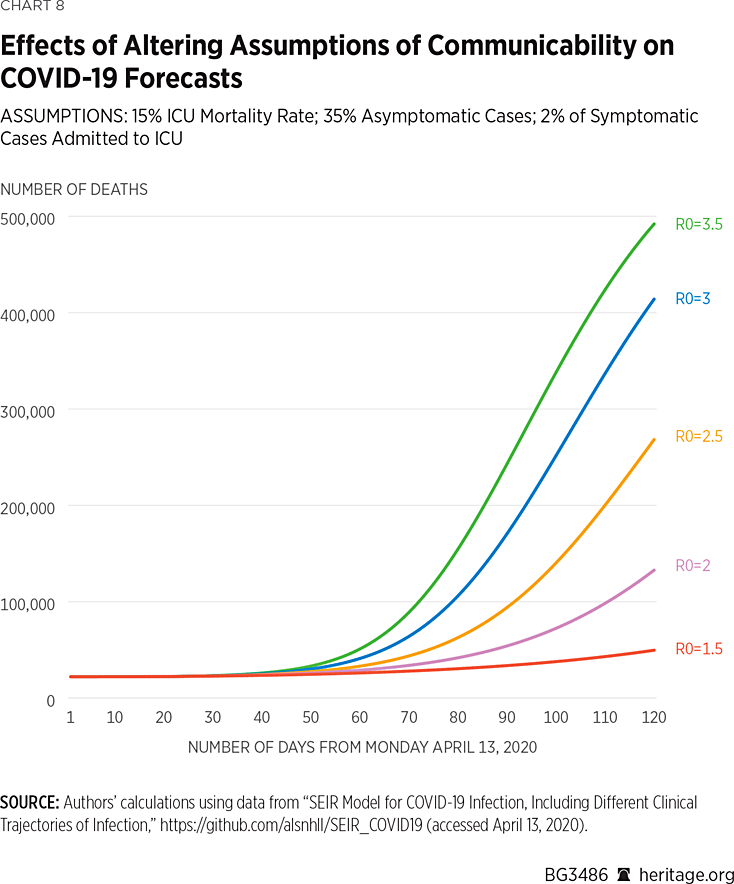
As is apparent in Charts 7 and 8, lower levels of communicability result in reduced projections of spread and mortality of the illness. What is particularly striking about these results, however, is the vast disparity in forecast results over what are considered commonly accepted estimates of R0 for COVID-19. These results range from approximately 44,000 dead and 7 percent infected under an assumption of R0=1.5, to 424,000 dead and 92 percent infected under an assumption of R0=3.5. Of course, current measures, such as quarantining, isolation, and social distancing, can contribute to reducing R0 for a given period, and thus reduce infection rates as well as deaths nationwide.
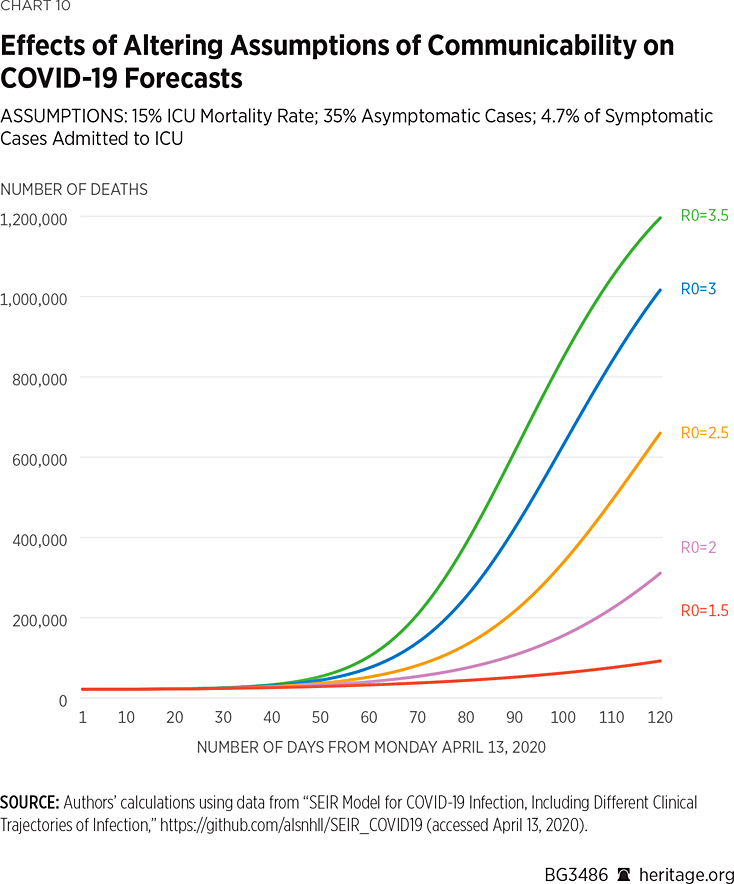
Charts 9 and 10 present another set of simulations based on the assumption that 4.7 percent of COVID-19 symptomatic cases warrant ICU admission. Again, the results vary dramatically, from 76,000 dead and 7 percent infected or recovered, assuming an R0 value of 1.5, to 1.05 million dead and 92 percent infected or recovered, under an assumed R0 value of 3.5.
Altogether, our simulations demonstrate that COVID-19 forecasts are highly sensitive to basic modeling assumptions. More fundamentally, it is also not surprising that some researchers, such as those at Imperial College, have forecast such high levels of mortality using other epidemiological models.REF Under assumptions of no disease mitigation, such results can easily be obtained by many of these models. Given the level of seriousness with which the American people have been treating the spread of COVID-19, however, forecasts toward the lower end of our range are certainly realistic. In fact, some modelers have begun to revise their numbers downward in light of consistently changing information warranting updates to assumptions.REF
Moreover, there are many other assumptions that can be incorporated into these models as well, including assumptions about seasonality, pre-symptomatic infections, and length of hospital stay. The model sensitivity shown in this Backgrounder is not unique to epidemiological models alone, and has been demonstrated in Heritage Foundation analysts’ research to also be the case for models used in other policy areas as well.REF Although statistical models can be very useful tools in public policy, they are only as accurate as the assumptions from which they are composed. It is therefore imperative to determine the most accurate assumptions in order to be able to generate credible COVID-19 forecasts. Policymakers cannot use models to make well-informed decisions without fully understanding both the sensitivity of these models to changes in key assumptions as well as the uncertainty associated with estimates based on such assumptions themselves.
Another aspect that may make these modeling exercises even more challenging, which we discuss in the following section, are the vast differences in how the virus is attacking different areas of the country.
State-Level and County-Level Heterogeneity
All 50 states and their various localities are inherently unique in nature, displaying a wide variation in all sorts of characteristics. For example, New York City is significantly denser and has an inherently different economy from other areas of New York State, as well as other parts of the country, such as rural Virginia.
These differences can significantly affect how people interact with each other, and consequently can lead to variation in COVID-19’s ability to spread in different areas. Map 1 illustrates the extent to which COVID-19 is present on a county by county basis.REF For example, as of April 12, 2020, New York State has 188,694 COVID-19 cases, New Jersey has 60,576 cases, and Massachusetts has 25,102 cases. Together, these states encompass over 50 percent of the entire country’s positive cases. These states, along with California, Illinois, Florida, Pennsylvania, and Washington, constitute over two-thirds of the existing cases in the country.
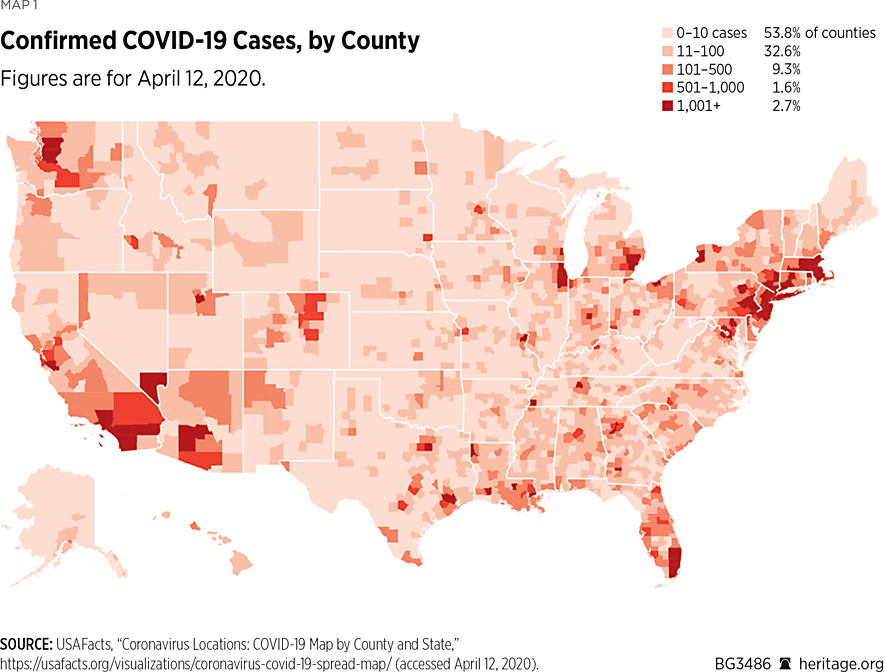
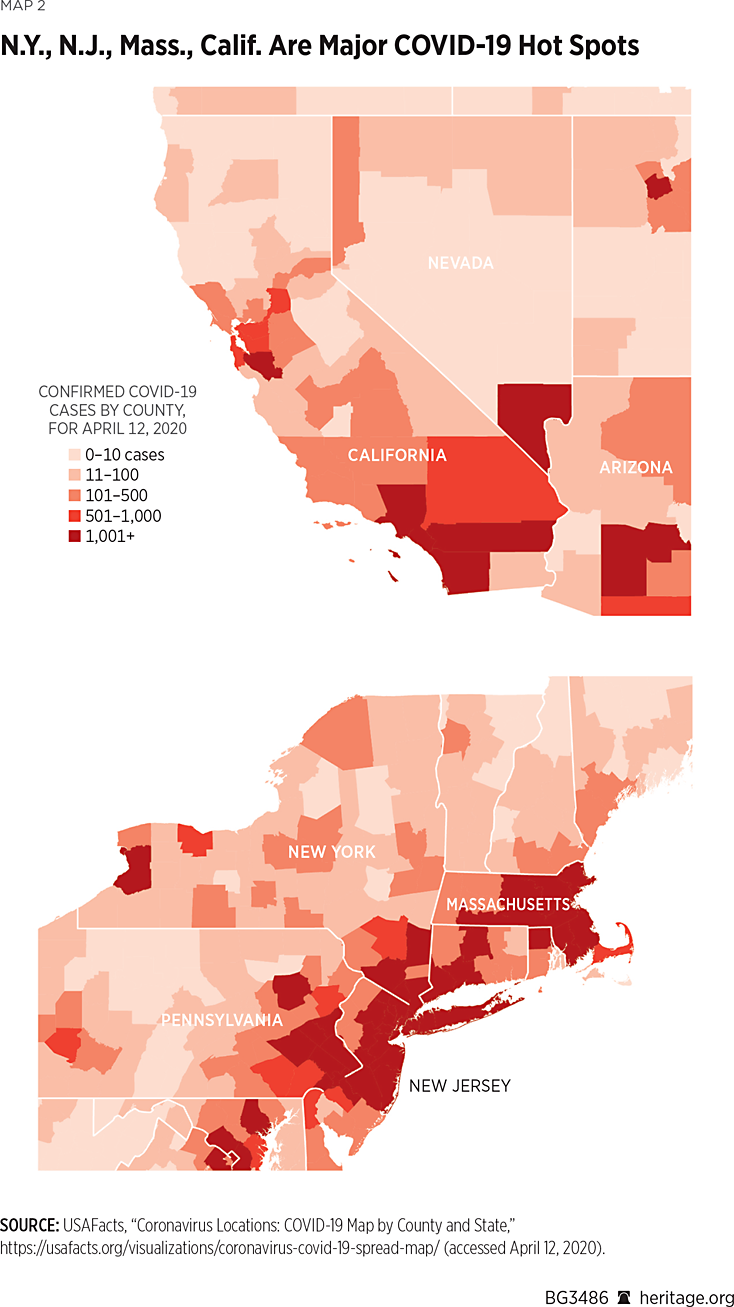
However, a closer look at the state of New York finds that over 14,000 of the state’s cases are in New York County alone. Adding nearby King County, Bronx County, Nassau County, Queens County, Westchester County, and Suffolk County to New York County’s caseload finds that over 80 percent of New York State’s cases are specifically in one of those seven counties, all in the New York City area. Similar phenomena occur in other areas of the country, including California, Washington State, and Michigan. These data strongly suggest that governors should implement specific policies that are tailored to meet the needs of their state.
Policy Implications
In order to address the ongoing pandemic, policymakers should:
- Require epidemiological models used for guiding policy to be publicly available. It is fundamentally important for the public to be able to look over these models themselves as members of the public have found mistakes in government models in the past.REF Researchers at Imperial College as well as at the CDC have not provided the public with their models. All epidemiological models used by lawmakers for making policy recommendations about COVID-19 measures should be made public, with users having the ability to adjust assumptions made in the models. The government should make as much of the underlying information available as is responsible in light of public health and national security concerns.
- Be cautious when using epidemiological models. Elected officials at all levels of government should be wary of model projections. As has been demonstrated in this Backgrounder, epidemiological forecasts are highly dependent on assumptions. As little is currently known about COVID-19, it is difficult to generate accurate forecasts. If policymakers are to use model-based forecasts for guiding policy decisions, they should present a range of forecasts under a variety of clearly stated and tenable assumptions. Furthermore, they should continually update these assumptions as warranted, and generate new forecasts as more knowledge about the virus becomes available.
- Encourage randomized testing for COVID. As discussed earlier, COVID-19 testing has been largely limited to those who are exhibiting symptoms. Sadly, this policy precludes asymptomatic people from knowing whether they have the virus. Consequently, the lack of testing of asymptomatic cases prevents researchers from understanding the prevalence and spread of COVID-19 throughout the country because it biases data toward only those people exhibiting symptoms. As our modeling has demonstrated, data on all people infected, even those not showing symptoms, is vital for generating accurate forecasts and developing a full understanding of the disease.
- The small town of Vo, Italy, made tremendous strides in understanding and containing the virus by testing all of the town’s inhabitants.REF Although testing entire towns throughout America may be difficult, testing voluntary random samples of the American population could be particularly useful. In particular, medical researchers studying COVID-19, along with the American public, would benefit tremendously from randomized COVID-19 testing representative both of particular localities as well as the American population in general. The White House Coronavirus Task Force should discuss randomized testing with private entities involved in the efforts, such as LabCorp, Quest, and major health insurance companies.
- Make testing more widespread. The prevalence of COVID-19 testing has improved significantly in the United States but is still not sufficient. The U.S. Food and Drug Administration (FDA), for example, has recently granted emergency use authorization (EUA) for a number of tests, including a saliva test to deliver COVID-19 results.REF Regardless, the United States is considerably behind the curve in testing compared to other countries. In particular, as of April 13, 2020, the United States has conducted fewer tests on a per capita basis than Estonia, Iceland, Norway, Switzerland, and South Korea.REF Currently, the FDA does not grant reciprocal approval for tests approved in other countries, and foreign tests must go through the FDA approval process from scratch. Policymakers, perhaps either through congressional legislation or via EUA through the FDA, could ameliorate the shortage of test kits here in America by permitting reciprocal authorization for certain tests in use in other countries.REF In fact, South Korea has had a surplus of test kits, in part due to less-burdensome health care regulations that were reformed due to the MERS outbreak five years ago. Fortunately, the Trump Administration has begun the process of importing these test kits here at home.REF Policymakers would do well to consider options from other countries as well.
- Give state governments the flexibility to deal with events as they unfold. Government has a legitimate role in protecting its people from a public health hazard, such as a pandemic. State governors, in conjunction with local leaders and neighboring states, and the support of federal officials, should decide which policies are best for them. As the data show, various counties across the U.S. are dealing with different COVID-19 circumstances, and one national model, or even one state model, is unlikely to provide adequate guidance. Federal, state, and local officials should be able to consider multiple options, such as testing strategies designed to contain the outbreak in their regions. If those efforts are successful in containing the spread of the virus, they could help to inform future efforts.
Conclusion
COVID-19 is a pandemic unlike anything that Americans have seen in their lifetimes. As is the case in any field, statistical models used to forecast outcomes regarding the virus can be useful tools but are also extremely sensitive to assumptions. It is important to garner as much knowledge about the virus as possible to be able to make the most accurate assumptions. As viruses spread locally, state and local governments should decide what the best policies are to curb the spread of the virus. With the right policies in place, Americans will be well on their way to fighting and defeating this very dangerous enemy.
Kevin D. Dayaratna, PhD, is Principal Statistician, Data Scientist, and Research Fellow in, and Norbert J. Michel, PhD, is Director of, the Center for Data Analysis, of the Institute for Economic Freedom, at The Heritage Foundation.
Appendix
Our analysis is based on a compartmental epidemiological model to quantify the propagation and progression of COVID-19. Some details of the model are described here.REF
The model used in this study is a compartmental epidemiological model structured in the form of a SEIR (susceptible, exposed, infected, and resistant) model to forecast the spread and progression of various illnesses, including COVID-19. Individuals are capable of transmitting the infection at any stage, although they have different rates of doing so, which are specified a priori by the user. Susceptible (S) individuals who become infected begin in an exposed class (E) and are initially asymptomatic and not able to transmit the virus. Upon leaving the exposed class, a particular fraction f of individuals develops an asymptomatic form of the infection (class I0) and the remaining 1-f of individuals develop a symptomatic form of the infection (class I1). Asymptomatic infections are assumed to not progress to more severe forms of the infection and have their own unique recovery rate γ0. These individuals may of course transmit the virus at a specified rate β0.
There is also the possibility that individuals who have been exposed to the virus and have yet to have symptoms may still be able to pass on the virus. As a result, E is decomposed into two separate classes, E0 (without symptoms/transmission) and E1 (no symptoms yet can transmit). The rate of leaving class E0 and E1 are a0 and a1, respectively.
Infected individuals begin exhibiting symptoms with a mild infection and are classified in group I1. These individuals may either recover from this initial infection at rate γ1 or subsequently move on to having a severe form of the infection I2, at rate p1. This severe infection either results in recovery at a rate of γ2 or moves on to a critical stage I3 at rate p2. Those with critical infections will either recover at rate γ3 or succumb to the illness at rate µ and are grouped in class D. Those who recover are classified in group (R) and are assumed to be immune to the virus going forward.
Mathematically, one can describe the model as follows:
$$\frac{dS}{dt}=-(\beta_eE_1+\beta_0I_0+\beta_1I_1+\beta_2I_2+\beta_3I_3)S\\$$$$\frac{dE_0}{dt}=-(\beta_eE_1+\beta_0I_0+\beta_1I_1+\beta_2I_2+\beta_3I_3)S-a_0E_0\\$$$$\frac{dE_1}{dt}=a_0E_0-a_1E\\$$$$\frac{dI_o}{dt}=fa_1E_1-\gamma_0I_0\\$$$$\frac{dI_1}{dt}=(1-f)a_1E_1-(\gamma_1+p_1)I_1\\$$$$\frac{dI_2}{dt}=p_1I_1-(\gamma_2+p_2)I_2\\$$$$\frac{dI_3}{dt}=p_2I_2-(\gamma_3+µ)I_3$$$$\frac{dR}{dt}={\sum\nolimits^3}_{i=0}\gamma_iI_i$$$$\frac{dD}{dt}=µI_3$$
Variables
- S—Individuals susceptible to the illness
- Ej—Exposed individuals; infected but not yet infectious or symptomatic (where j=0 or 1; j=0 represents uninfected individuals, j=1 represents individuals infected without symptoms and can thus transmit the infection)
- E—All exposed individuals
- Ii—Infected individuals belonging to class I (where i=1, 2, or 3; i=1 represents a mild infection, i=2 represents a severe infection, and i=3 represents a critical infection)
- R—Individuals that have recovered from the disease and considered immune.
- D—individuals who die of the illness
Parameters
- βi —the rate at which infected individuals in class Ii contact and infect exposed individuals
- f – fraction of asymptomatic individuals
- aj —rate of progression from the exposed to infected class
- γi—rate at which infected individuals in class i recover from disease and become immune
- pi—rate at which infected individuals in class Ii progress to class Ii+1
- µ —mortality rate for individuals in critical care
Other assumptions to be made in the model are below. Specification of some of these parameters are well-established based on evolving knowledge about the disease; however, some are still unclear:REF
Incubation period: The time from infection until the patient exhibits symptoms.
Duration of mild infections: Most COVID-19 cases are mild situations that require resting at home and do not require hospitalization. This parameter specifies the number of days that a COVID-19 positive patient needs to rest at home before recovering.
Percentage of severe infections: This parameter specifies the percentage of COVID-19 cases that are serious enough to warrant hospitalization.
Percentage of critical infections: This parameter specifies the percentage of COVID-19 cases that not only involve hospitalization but also involve treatment within a hospital’s ICU.
Probability of death: Of the critical infections, this parameter specifies the fraction of COVID-19 positive cases in the ICU that will result in death.
Duration of hospital stay: This parameter specifies the length of the hospital stay, from admission to discharge.
Duration of critical infection until death: This parameter specifies the number of days a patient who does not recover spends in the ICU.
Fraction of asymptomatic cases: This parameter specifies the fraction of infections that are asymptomatic.
Pre-symptomatic infectious period: This parameter specifies the time upon infection before the patient begins exhibiting symptoms.
Duration of asymptomatic infection: This parameter represents the amount of time that an asymptomatic COVID-19 patient remains infected.
Transmission rate for asymptomatic infections: This parameter specifies the rate at which COVID-19 cases without symptoms transmit the disease to others.
Transmission rate for mild infections: This parameter specifies the rate at which COVID-19 cases with a mild infection transmit the disease to others.
Transmission rate for severe infections: This parameter specifies the rate at which those with a severe infection transmit the disease to others.
Transmission rate for critical infections: This parameter specifies the rate at which those with a critical infection transmit the disease to others.


