The proof is in the pudding. The ratings issued by any college rating system should correspond to outcomes related to the purposes of higher education. Some college rating systems are based largely on inputs, like the average SAT scores of incoming students, but do not consider post-graduation outcomes. Other college rating systems are built exclusively around the economic success of graduates, and do not factor in the full range of outcomes, including living a good life and personal well-being. Of course, successful universities and colleges should equip students with the skills needed to prosper in the workforce, but education, in general, and higher education, in particular, can and should do much more.
In its essence, education is a process of shaping character. The Heritage Foundation’s Center for Education Policy wanted to know if graduates of the schools it rated in Heritage’s “Choosing College with Confidence” guideREF are prepared to lead a life committed to family, faith, and values, and demonstrate the virtues on which a healthy society depends, as well as one filled with economic and personal success.
The ratings in “Choosing College with Confidence” are built around this broader understanding of higher education. To validate that the ratings correspond to the diverse outcomes expected of successful colleges and universities, Heritage commissioned College Pulse to administer a survey to more than 7,000 current and former students at the 987 institutions rated in the college guide to measure a variety of outcomes.
The results, collected independently from the process of rating the colleges, confirm that colleges rated green (“great option”) have significantly better outcomes than those rated yellow (“worth considering”) or red (“not recommended”). In particular, the current and former students at green universities had better outcomes related to family, faith, and community. They exhibited stronger moral judgment. They demonstrated higher levels of political tolerance and lower levels of antisemitism. And they reported greater personal well-being. In short, Heritage is right to recommend the green colleges and universities because the students who are attracted to and formed by those institutions are more likely to develop into the kinds of adults that higher education is intended to produce.
Family, Faith, and Community
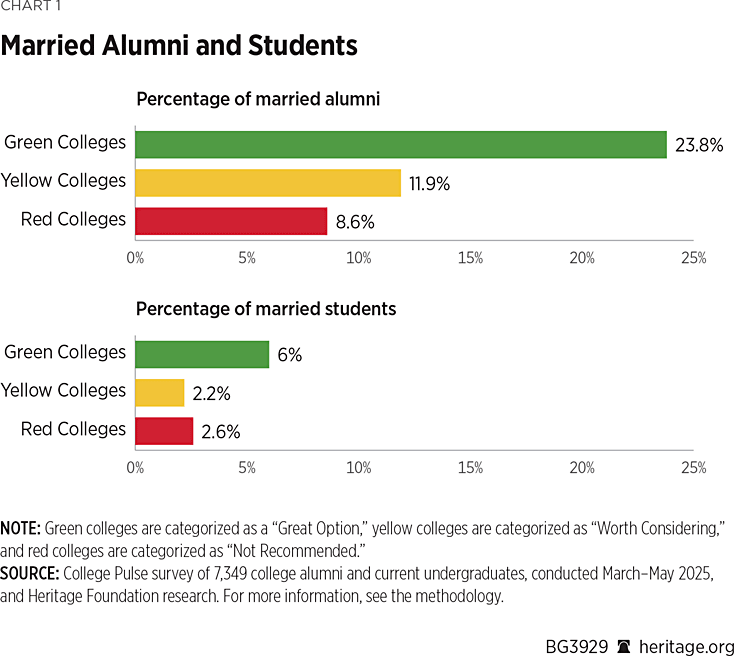
The most striking differences between the current and former students at colleges that The Heritage Foundation recommends and those that it does not endorse is how they approach family, faith, and community. Since 97.4 percent of the people surveyed graduated college after 2020, most of the respondents are not yet married. Nevertheless, among alumni of green colleges, 23.8 percent report that they are married, compared to 11.9 percent for the graduates of yellow colleges and 8.6 percent for red colleges. Even among currently enrolled students, more are married among those at green colleges (6.0 percent) relative to yellow (2.2 percent) or red colleges (2.6 percent).
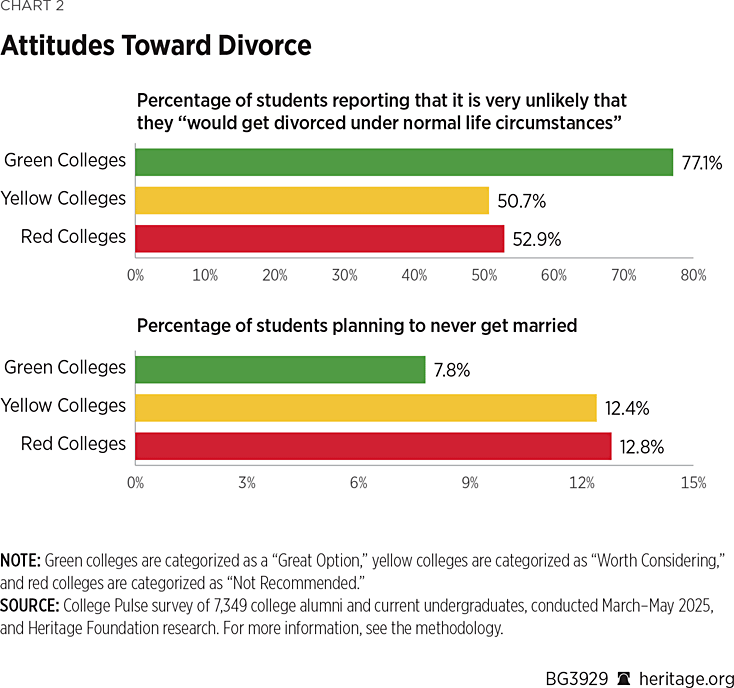
Current or former students at red colleges (12.8 percent) and yellow colleges (12.4 percent) were much more likely to say that they never plan to get married than those of green colleges (7.8 percent). Divorce also seemed to be a stronger possibility in the future for current and former students of red and yellow schools than those of green schools. More than three-quarters (77.1 percent) of green respondents said that it was very unlikely that they “would get divorced under normal life circumstances,” while barely half of both yellow (50.7 percent) and red (52.9 percent) respondents considered this prospect to be very unlikely.
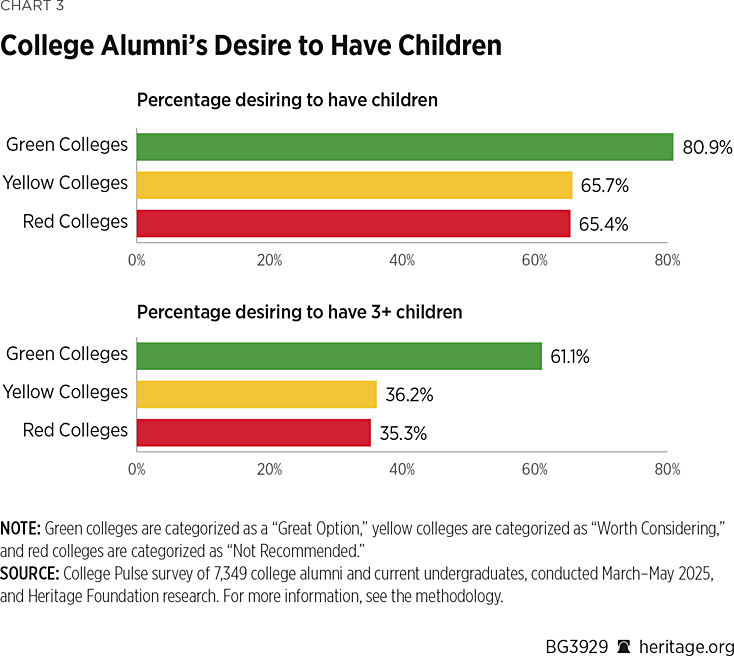
Current and former students at green colleges are much more enthusiastic about having children, with 80.9 percent saying that they have or plan to have children compared to 65.7 percent among yellow college respondents and 65.4 percent among red college respondents. Green college students and alumni also hope to have larger families. Of those who have or plan to have children, 61.1 percent of green college respondents would like three or more children, compared to 36.2 percent for yellow colleges and 35.3 percent for red colleges.
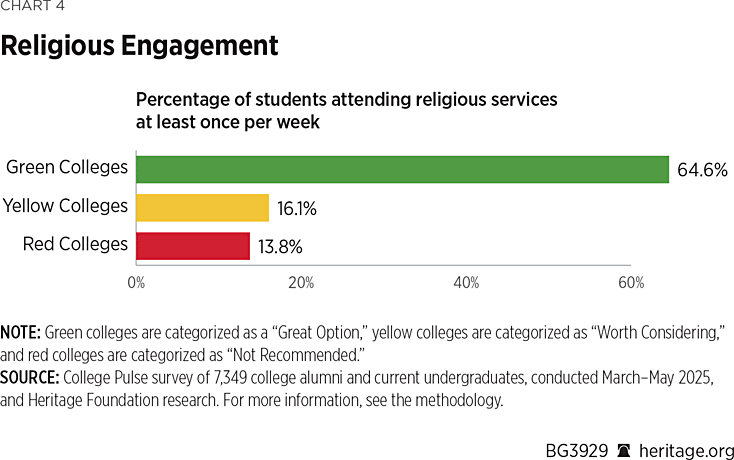
In addition to being more committed to family, green college students and alumni are more devoted to their faith and community than those associated with yellow or red colleges. Among green college respondents, 64.6 percent attend religious services at least once per week compared to 16.1 percent for yellow colleges and 13.8 percent for red colleges. Almost a third (33.2 percent) of current or former students at green colleges volunteer for charitable organizations in their community at least several times a month, while only 22.9 percent of yellow and 21.3 percent of red college respondents are similarly engaged with community charities.
Moral Character
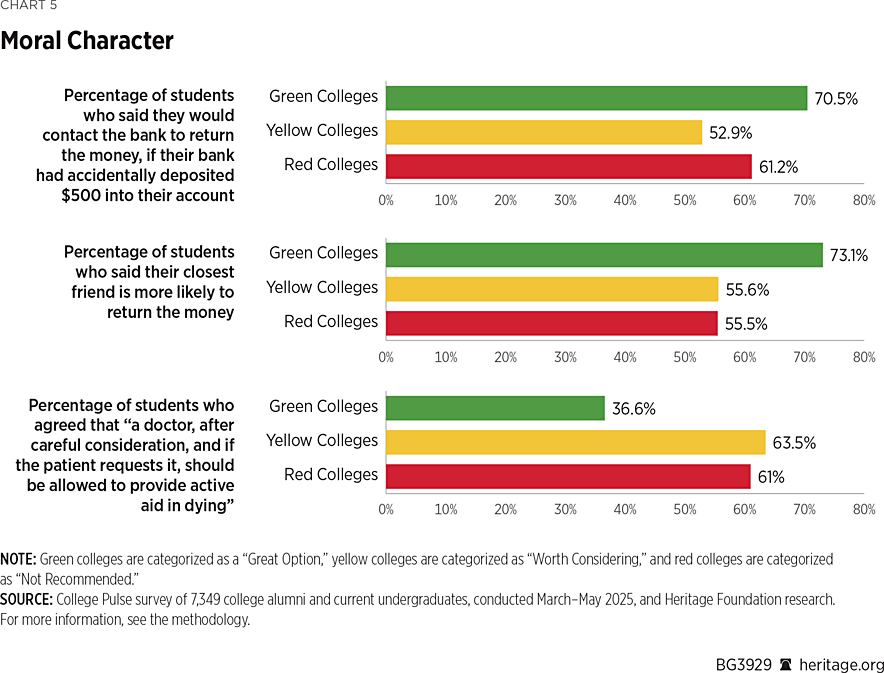
To measure aspects of moral character that may differ among colleges classified as green, yellow, or red institutions, three items were included in the survey. The first item presents respondents with a scenario in which their bank has accidentally deposited $500 into their account, asking them what they would do. Among the current and former students at green colleges, 70.5 percent say they would contact the bank to return the money. Only 52.9 percent of the yellow college respondents and 61.2 percent of the red college respondents said they would return the money.
In the second item, the same scenario was presented, except that respondents were asked to imagine what their closest friend would do if the money was mistakenly deposited into his or her account. Interestingly, the green college respondents thought that their closest friend would be even more likely to return the money (73.1 percent) than they believed they would do so themselves (70.5 percent). Current and former students at green colleges appear to subject themselves to tougher moral scrutiny than they do their friends.
By contrast, respondents in red colleges thought that their friends were less likely to return the money than they are, 55.5 percent versus 61.2 percent. Unless these current and former red college students, in fact, have worse-behaving friends, it appears that they imagine themselves to be more morally upright than their closest friends.
In a third measure of moral character, the survey asked about doctor-assisted suicide. The current and former students of green colleges seemed to value life more strongly: Only 36.6 percent agreed that “a doctor after careful consideration and if the patient requests it should be allowed to provide active aid in dying.” For yellow colleges 63.5 percent, and for red colleges 61.0 percent agreed with that statement.
These measures only capture a portion of moral character, but the results clearly indicate that green college respondents are prepared to act with honesty and integrity and are more committed to a culture that affirms these virtues and the intrinsic value of life.
Free Expression on Campus
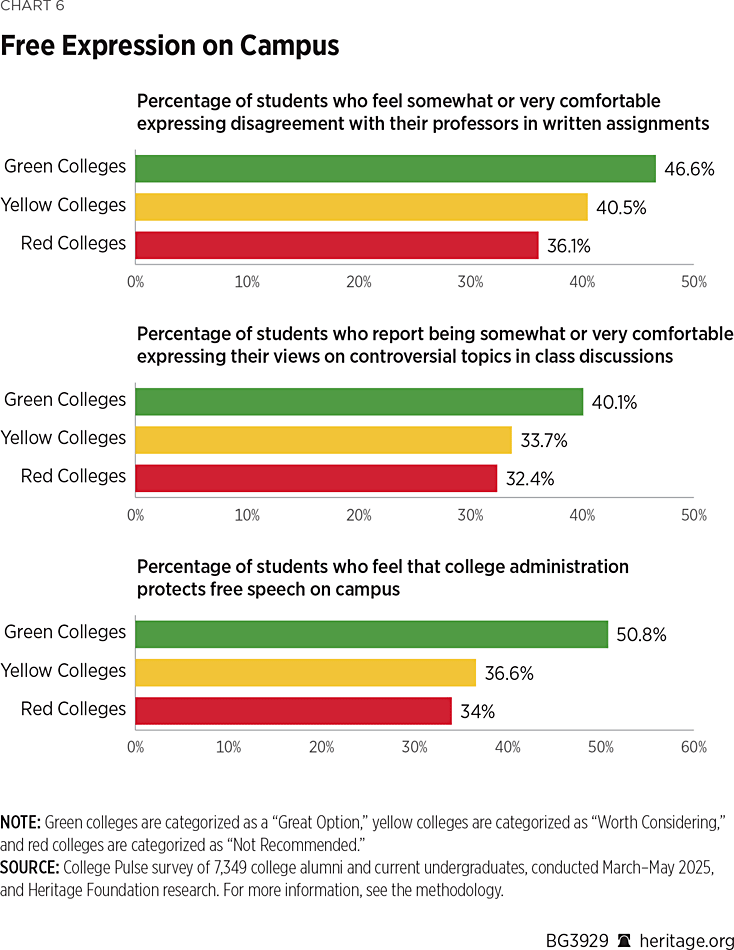
Even while they are still in college, the students at green colleges are already becoming more comfortable engaging in free expression. Among the students currently enrolled in green colleges 46.6 percent report feeling somewhat or very comfortable expressing disagreement with their professors in written assignments, and 40.1 percent report being somewhat or very comfortable expressing their views on controversial topics in class discussion.
For students attending yellow colleges only 40.5 percent say they feel somewhat or very comfortable disagreeing with their professors in written assignments and 33.7 percent expressing controversial views in class discussion. The rates are even lower for students at red colleges, with 36.1 percent saying they would be somewhat or very comfortable disagreeing with their professors in written assignments and 32.4 percent in class discussion.
When asked, “How clear is it to you that your college administration protects free speech on campus?” 50.8 percent of green college respondents say very or extremely clear, compared to 36.6 percent for yellow colleges and 34.0 percent for red colleges.
Political Tolerance
To measure political tolerance, the survey asked whether people who support different political causes should be allowed to run for public office or have their books available in the local public library. Politically tolerant respondents are defined as those who supported the rights of others to run for office and have their books available in libraries. Significantly, politically tolerant respondents were as likely to extend these rights to those who support causes they disfavor as to those whose causes they favor.
To avoid making respondents aware that their consistency in protecting political rights was being measured, half of the sample was randomly assigned to be asked questions about supporters of the National Rifle Association (NRA), and the other half was asked about supporters of diversity, equity, and inclusion (DEI) measures. If respondents in green, yellow, and red colleges were consistent in their support of political rights, the half that saw the questions about the NRA would answer similarly to the half that saw the questions about DEI, even though no respondent saw both sets of questions.
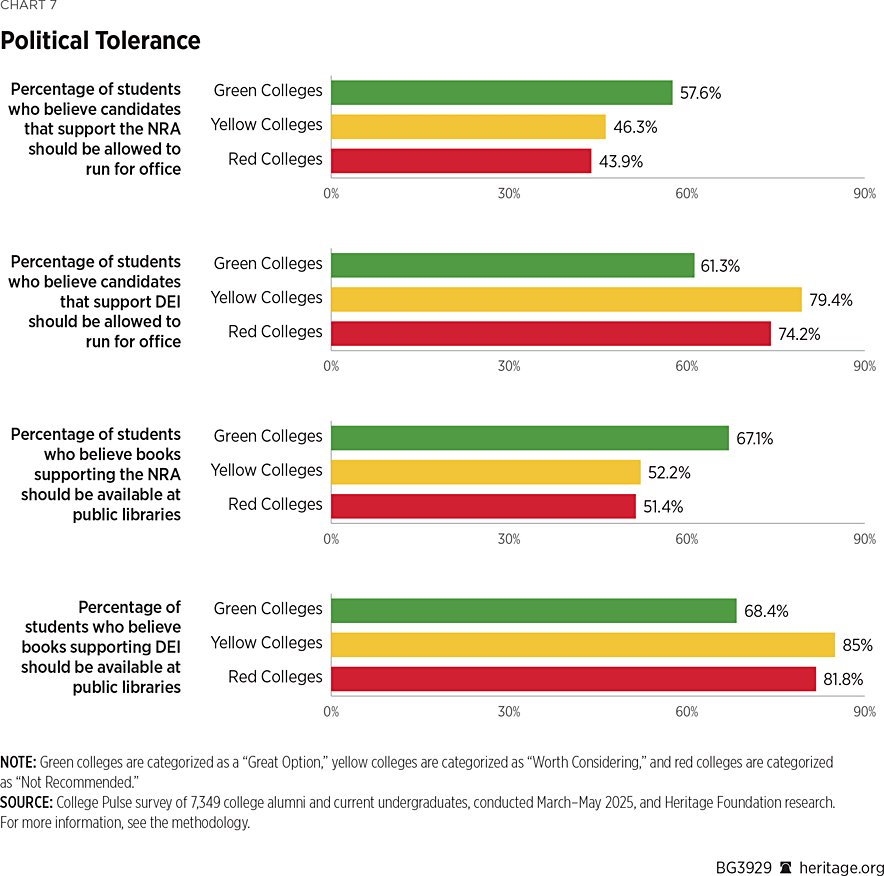
On average, respondents at green, yellow, and red colleges did not significantly differ from each other in expressing reservations about allowing people to hold public office or local libraries offering their books. But the current and former students of green colleges are much more consistent in how they treat the supporters of different political causes. Among the green college respondents who saw the question about NRA supporters, 57.6 percent backed their right to run for public office. For the green college respondents who saw the question about DEI supporters, 61.3 percent backed their right to run for office.
Yellow and red college respondents, however, treated the political rights of these two groups very differently. Of those who saw the question about supporters of the NRA, only 46.3 percent of yellow respondents and 43.9 percent of red respondents believed that they should be allowed to run for public office. When it came to DEI supporters, however, 79.4 percent of yellow respondents and 74.2 percent of red respondents would allow them to run for public office. The students and alumni of yellow and red colleges appear much more likely to extend political rights to the supporters of some views than to those who support other views.
The same patterns hold true for whether NRA and DEI supporters should have books in the local library. Green college respondents were equally likely to agree that books supporting the NRA (67.1 percent) should be available in the local public library as books supporting DEI (68.4 percent). Barely half of yellow (52.2 percent) and red college (51.4 percent) respondents said that books advocating NRA principles should be available in the local public library. But when asked about books advocating DEI, 85.0 percent of yellow and 81.8 percent of red college respondents believed those books should be available in the local public library.
Antisemitism
The application of a double-standard unfavorable to Jews is a defining feature of antisemitism. To measure this, respondents were randomly assigned to see nearly identical scenarios either involving Jews or members of another group. No individual saw both scenarios, so no one would be aware that their relative treatment of Jews was being measured. But if green, yellow, or red college respondents would, on average, treat Jews worse than they would treat members of another group in a similar scenario, it is reasonable to conclude that they have hostility toward Jews.
In one set of scenarios, a third of the respondents were asked: “Many citizens of the United States feel a particular attachment to Israel for historical and cultural reasons. Do you think this attachment to another country creates a conflict of interest?” Another third was asked the same question, with Mexico substituted for Israel. And another third was asked the same question without naming a country. If respondents have no particular hostility toward Jews and Israel, the average answers would be roughly the same for all three versions of this scenario.
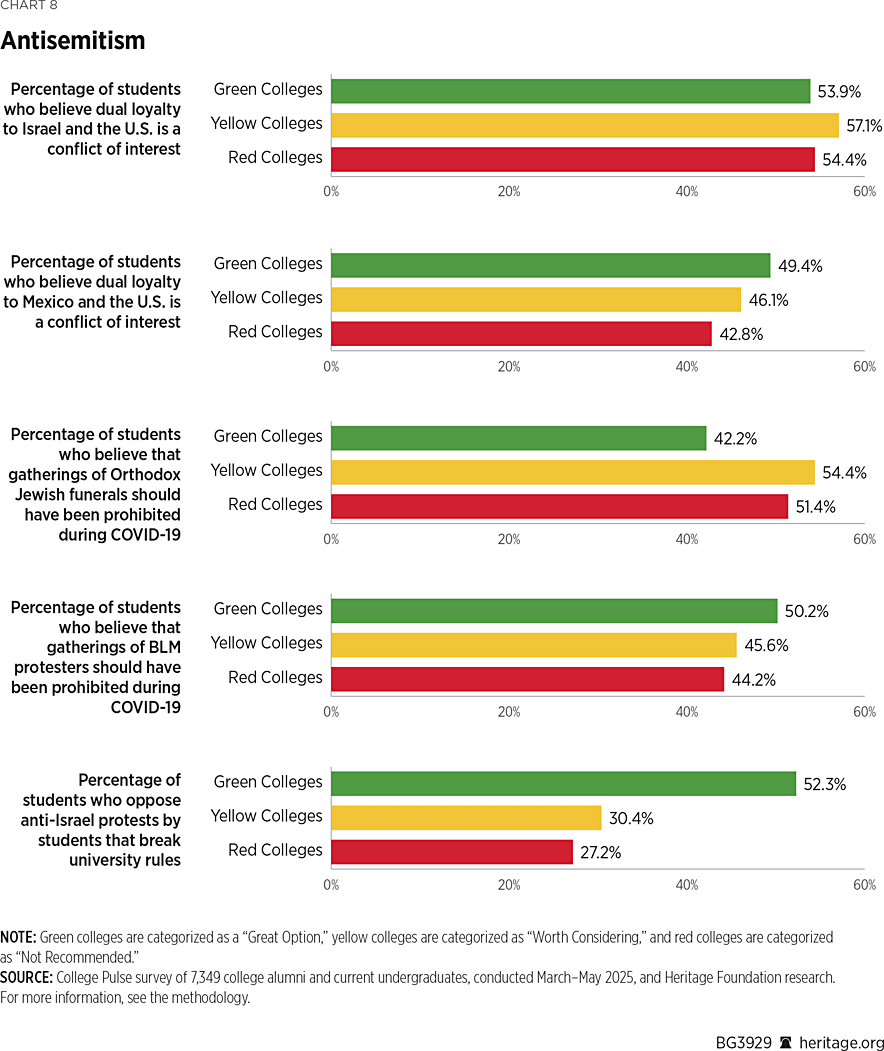
Students enrolled at green colleges responded similarly, on average, to all three. When “dual loyalty” concerns were raised about Israel, 53.9 percent believed that there was a conflict of interest. For Mexico, 49.4 percent said there was a conflict of interest. And for the generic scenario that did not name a country, 51.3 percent responded that “attachment to another country creates a conflict of interest.”
Among students at yellow and red colleges, however, an attachment to Israel is seen as far more troubling than an attachment to Mexico. For yellow college students, 57.1 percent believed that an attachment to Israel created a conflict of interest, while 46.1 percent thought that an attachment to Mexico created a conflict of interest. Among red college students, 54.4 percent viewed an attachment to Israel as a conflict of interest, while only 42.8 percent felt that way about an attachment to Mexico. Green college students treat connections to different countries roughly the same, while yellow and red college students treat a connection to Israel much more harshly than a connection to Mexico.
In another set of scenarios, respondents were asked about restrictions on public gatherings during the COVID-19 pandemic. In one version, some respondents were asked whether large groups of Orthodox Jews who gathered for funerals in New York during restrictions posed a threat to public health and should have been prevented. In another version, other respondents were asked whether protestors who gathered for demonstrations in support of Black Lives Matter (BLM) during those restrictions posed a threat to public health and should have been prevented.
Among current and former students at green colleges, 42.2 percent believed that gatherings of Orthodox Jews for funerals should have been prevented, but 50.2 percent said that BLM demonstrations should have been prevented. For yellow and red college respondents, the pattern of answers was the reverse: 54.4 percent of yellow and 51.4 percent of red college respondents believed that Orthodox Jewish gatherings should have been prevented, but only 45.6 and 44.2 percent, respectively thought BLM demonstrations should have been prevented. Yellow and red college respondents clearly view public gatherings of Jews less favorably than public gatherings of BLM protestors, while green college respondents show favor to Jewish over BLM gatherings.REF
Current and former students of green colleges also express opposition to student protests against Israel that break university rules. Of green college respondents, 52.3 percent disagreed that student protestors who violated university rules to occupy student buildings or build encampments to protest Israel were justified in their actions. Among yellow college respondents only 30.4 percent disagreed that these rule-breaking protests were justified and for red college respondents only 27.2 percent disagreed.
Personal Well-Being
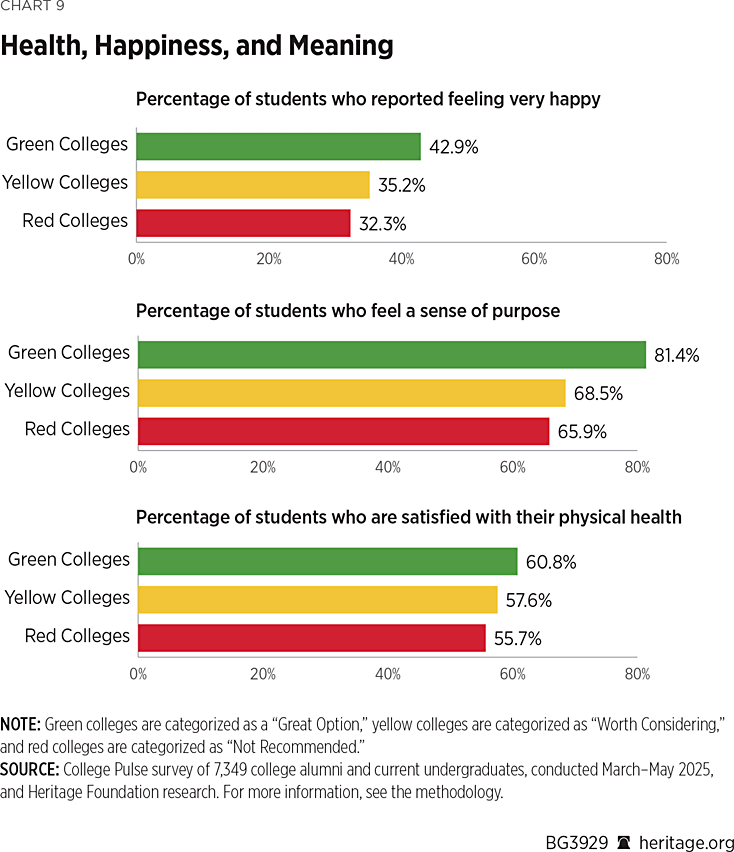
Successful higher education also increases its students’ personal well-being. The survey asked several questions to gauge this. For example, respondents were asked to rate how happy they are on a scale from one to 10, with 10 being extremely happy. Among green college respondents, 42.9 percent scored their happiness as an eight, nine, or 10—compared to 35.2 percent for yellow college respondents and 32.3 percent for red college respondents.
This contentment also extends to physical health, with 60.8 percent of current and former students at green colleges reporting that they were satisfied with their physical health, compared to 57.6 percent for yellow colleges and 55.7 percent for red colleges.
The survey also asked respondents to agree or disagree with the statement, “I feel like I have purpose in my life, my life has meaning.” Among current and former students of green colleges, 81.4 percent agreed, while 68.5 percent at yellow colleges and 65.9 percent at red colleges agreed.
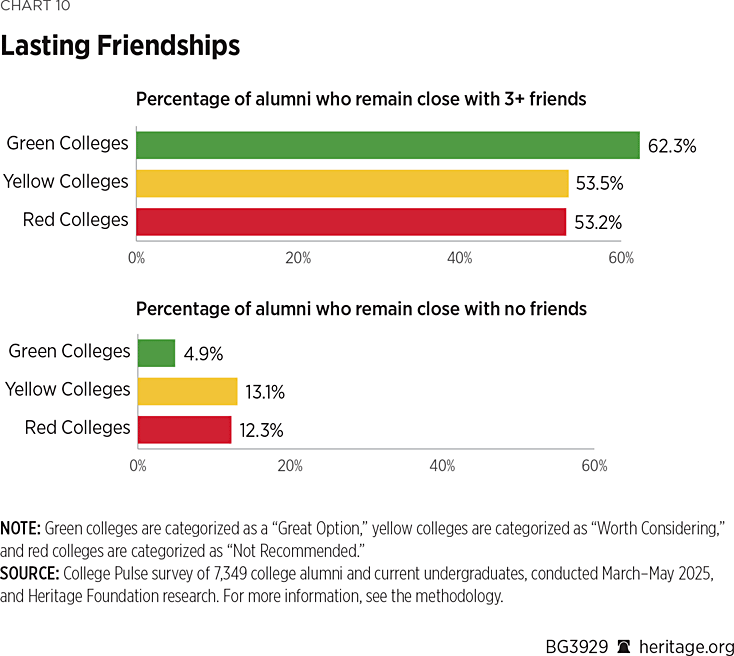
Higher education can also help students to form lasting friendships. When the alumni of green colleges were asked with how many of their college friends they remain close, 62.3 percent said at least three, and only 4.9 percent said none. For yellow college alumni, 53.5 percent said they remain close with at least three college friends and 13.1 percent said they were close with no friends from college. The answers were similar for red college alumni, with 53.2 percent reporting at least three close friends from college and 12.3 percent saying that they remained close to no friends from college.
Economic Success
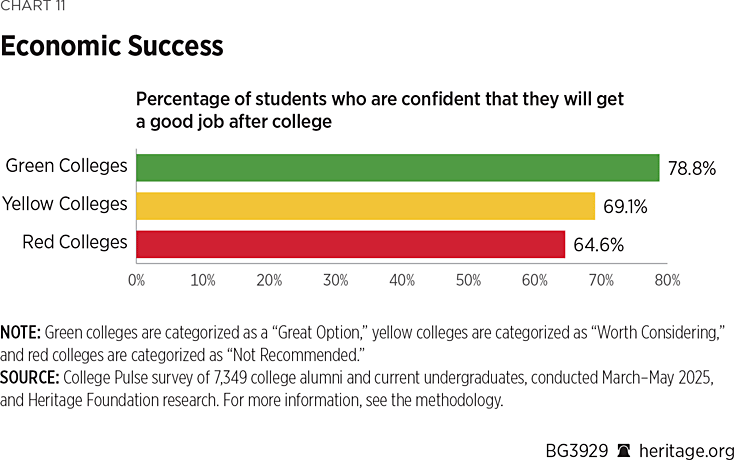
Of course, it is centrally important that higher education also equip students with the skills they need to find employment and be economically productive. Currently enrolled students were asked to rate from one to five their prospects for getting a good job after graduation, with five being the highest likelihood. Among students at green colleges 78.8 percent gave four or five as their response compared to 69.1 percent at yellow colleges and 64.6 percent at red colleges.
When respondents were asked whether they had ever received government assistance (excluding student loans or grants), 77.0 percent of current and former students of green colleges said they had not, compared to 73.6 percent for yellow colleges and 73.2 percent for red colleges.
Discussion
Many college guides provide the enrollment figures at certain schools or the grade point averages and average SAT scores of incoming students. Few guides, though, offer families and prospective students a picture of what the students who have recently attended a chosen school value deeply. For Heritage’s college guide, its authors wanted to know the following: Which students are attracted to and produced by universities that have an institutional commitment to free speech, a mission statement that prioritizes truth, and even a statement of faith?
People change as they grow and mature through different life experiences, but this survey demonstrates that the aspirations of the students who are attending or have recently graduated from universities that make the pursuit of truth a priority have values that comprise, in aggregate, the American dream. The students who graduate from green colleges want to get married and have children. They desire to show honesty and are more likely to see the best in others. They understand the moral inconsistencies inherent in DEI but are open to considering—or at least allowing for the discussion of—ideas with which they disagree.
Even if not all respondents fully live out these beliefs later in life, they are well on their way to creating civic communities and being authentically engaged in civic activities by having high standards for their current conduct. It is such behavior on which healthy communities are built, which, in turn, foster healthy cities, states, and nations.
Conversely, the graduates of the red institutions are evidence of the ideological conformity fostered at such schools. This conformity is demonstrated by an unwillingness to consider ideas they disagree with and an opposition or at least ambiguity to the habits and practices that create and nurture a stable society such as family formation. The risk in training young adults to believe such things or care little about the condition of those closest to them, living around them, even the country in which they live, is that schools are releasing self-centered, narrow-minded people into the primary sectors of life, such as workplaces. Obviously, not all graduates of a red school will behave in this way, but upon their completion of a degree, the goals of personal integrity, along with familial and social moral cohesion, are not likely to be a primary or even secondary focus.
“Choosing College with Confidence” is meant to help parents and students to choose a school at which a young adult can grow and find success—and it is also a project with a broader objective. The members of the Center for Education Policy hope that more students will choose schools that have a greater proportion of graduates interested in the good life, family, virtues that have stood the test of time, and freedom of expression. In turn, they hope that more schools will aspire to produce such graduates. Ultimately, they hope to play their part in contributing to the health of families, neighborhoods, cities, states, and the nation.
Jay P. Greene is Senior Research Fellow in the Center for Education Policy at The Heritage Foundation. Jonathan Butcher is Will Skillman Senior Research Fellow and Acting Director of the Center for Education Policy. Madison Marino Doan is a Policy Analyst in the Center for Education Policy.
Appendix: Methodology
Last year, The Heritage Foundation launched a new data visualization tool called “Choosing College with Confidence,” designed to help families and students across the country make more informed decisions about higher education. The site contains reviews of nearly 300 institutions and highlights colleges and universities that advance freedom, opportunity, and upward mobility, fostering free expression and open academic inquiry while also flagging those that fall short in terms of academic excellence, free expression, and ideological balance.
Each school received one of the three ratings:
“Great Option” (green light): These are institutions that provide a rigorous, well-rounded education with strong outcomes, including high graduation rates and competitive post-graduation earnings. They prioritize free expression and remain largely free of heavy DEI bureaucracies, appealing to families who value freedom, opportunity, and civil society.
“Worth Considering” (yellow light): These are institutions that host robust academic programs, such as American Council of Trustees and Alumni (ACTA)-designated “Hidden Gems” or “Oases of Excellence,” or are home to a Jack Miller Center Partner Program, that promote rigorous study, civic education, and the pursuit of truth. Although these institutions, on the whole, may not be as strong as the Great Option schools, they are distinguished by their robust programs and centers.
“Not Recommended” (red light): These are institutions that suppress diverse viewpoints and lack a strong core curriculum, thereby weakening the quality of a well-rounded education. Influenced by ideological agenda and DEI bureaucracies, they tend to restrict free expression, and sometimes offer poor returns on investment, with lower graduation rates and post-graduation earnings.
To evaluate each college and university, Center for Education Policy researchers developed a list of metrics.REF Those metrics include school climate; a curriculum review; return on investment; the four-year graduation rate; binary measures (such as whether the school has a bias reporting system, ethnic studies or gender studies departments, or requires diversity statements in hiring, whether DEI offices or related requirements have been eliminated, whether the school requires undergraduates to complete a DEI course to graduate, whether it accepts federal funding, such as student loans and grants for research, whether it accepts the Classic Learning Test for admission to the university, whether it requires a college admissions exam, whether it requires a U.S. history or civics course for graduation); the number of conservative versus liberal clubs; the yield rate; and the prevalence of DEI administrators.
Any college with a bias response team; gender studies department, major, or minor; mandatory DEI course for graduation; or required diversity statements in faculty hiring received an automatic “Not Recommended” rating. For colleges and universities added in 2025, Center for Education Policy researchers applied the same automatic criteria and also assigned schools an automatic “Not Recommended” rating if they received a “D” or “F” rating on their core curriculum requirements from the ACTA.
For colleges and universities not automatically classified, the education-policy team relied on a qualitative subjective review using data from the Foundation for Individual Rights and Expression’s (FIRE) free-speech survey, ACTA ratings, school-published information, and the broader metric set listed above.
The original list of nearly 300 colleges and universities was developed through outreach to state policy affiliates and state-level nonprofit think tanks affiliated with the State Policy Network (SPN, which serves as a network for conservative and libertarian think tanks focusing on state-level policy solutions), and by gathering insights from local partners on colleges and universities that align with traditional values. In 2025, the team expanded the database to include a total of 987 schools, adding approximately 15 per state, with a focus on institutions with the largest enrollments. Because some states had fewer than 15 institutions, the team added colleges from other states based on enrollment size to reach a total of 987 schools. The team excluded for-profit, fully online, two-year institutions, and schools with fewer than 100 students. Enrollment data was sourced from the U.S. Department of Education’s College Scorecard.REF
Based on its 2025 review, the education-policy team issued the following ratings: 139 colleges and universities received a “Great Option” (green light), 98 were rated “Worth Considering” (yellow light), and 750 were deemed “Not Recommended” (red light).
To complement the data, the team partnered with College Pulse, a research and analytics company specializing in college students, to conduct surveys among students at the institutions evaluated for the college guide. The sample of undergraduates and alumni was drawn from College Pulse’s American College Student Panel™, which includes over one million verified students and alumni representing more than 1,500 different colleges and universities in all 50 states and from verified panel partners.REF Heritage and College Pulse designed a questionnaire that was distributed to students over three months from March 2025 to May 2025. Students who participated and completed the survey received a small monetary gift. College Pulse received 7,349 responses, including 2,985 from alumni and 4,364 from current undergraduates. Of the 7,349 responses, 918 were from institutions that Heritage rated as “green,” 2,184 were from those rated “yellow,” and 4,247 were from those rated “red.” Of the list of 987 schools, College Pulse received responses from 570 schools, with the following distribution across classifications: red (412 universities), yellow (94 universities), and green (64 universities).REF
Note: The results of this survey do not control for potential confounding factors, such as self-selection, of those applying to each category of school, the selection of students with different characteristics by university admissions, or varying sites or locations of institutions, among other issues.


