Researchers have long debated the link between restricted abortion access and maternal mortality and morbidity. Studies have mostly been limited to analyses of middle- and low-income countries,REF but there have been a few studies that look at the effect abortion restrictions have on maternal mortality in the United States.REF Yet no studies to date have looked at the effect that expanding abortion access has on maternal morbidity in the U.S.
In this paper, we present evidence from a regression on data from South Carolina, New Jersey, and Arkansas that the emergency room (ER) visitation rate due to complications from induced abortion increased after the FDA removed the in-person dispensing requirement for mifepristone (also known as the “abortion pill”) (significant at the α = 0.05 level). The FDA’s policy change effectively expanded access to abortion by making it so that women no longer have to make an in-office visit to an abortion provider or have any in-person contact with the prescriber in order to obtain abortion pills.
Since women presenting at hospitals with abortion complications will sometimes hide attempted induced abortions as miscarriages, a regression was separately fit to the ER visitation rate due to miscarriages. There is evidence that after controlling for predictors of the natural miscarriage rate, the rate of ER visits due to reported miscarriages increased four years after the FDA’s policy change (significant at the α = 0.05 level).
Background
From the time when mifepristone was first approved by the U.S. Food and Drug Administration (FDA) until the COVID-19 pandemic, the FDA had, as a safeguard for public health, required the abortion pill be dispensed in-person, in the presence of the prescribing physician or licensed provider.
But on July 13, 2020, a U.S. federal court enjoined the FDA from enforcing the in-person dispensing requirement for mifepristone. The U.S. Supreme Court lifted this injunction six months later on January 12, 2021. In April 2021, after only four months, the FDA made public its intention to exercise enforcement discretion on the in-person dispensing requirement,REF and the FDA further informed the American College of Obstetricians and Gynecologists (ACOG) that in-person dispensing was no longer required.REF
In December 2021, the FDA made this change official agency policy when it modified its risk evaluation and mitigation strategy (REMS) for mifepristone by removing the requirement that the drug only be dispensed in-person by a qualified, licensed health care provider. The FDA at that time also further expanded access to the abortion pill by allowing retail pharmacies to dispense the pill with a prescription.
Some have suggested that the FDA’s removal of certain safety protocols for mifepristone such as the in-person dispensing requirement may increase the likelihood of abortion complications and maternal morbidity.REF Without the in-person dispensing requirement, women seeking abortion are no longer required to have in-person contact with the prescriber. This makes it difficult or impossible for prescribers of the pill to effectively screen women for possible underlying health risk factors and contraindications. Some contraindications of mifepristone are potentially life-threating such as ectopic pregnancy which can only be effectively screened for with an ultrasound. Mifepristone cannot be used to treat ectopic pregnancy.
To test the hypothesis that the removal of the in-person dispensing requirement increased the incidence of complications and maternal morbidity, we ran an analysis using linear regression to see if the emergency room visitation rate due to abortion complications increased after the FDA’s changes to the mifepristone REMS and removal of the in-person dispensing requirement.
Women presenting for medical treatment at a hospital for abortion complications do not always disclose the fact that they had attempted to have an induced abortion. In many parts of the United States, there is significant moral opposition and aversion to abortion. Since the Supreme Court’s decision in Dobbs v. Jackson Women’s Health Organization which overturned Roe v. Wade, several states have restricted abortion. Many women obtaining abortion may not want others, including health professionals, to know that they had an abortion. Additionally, some abortion providers have told their patients that if they experience abortion complications, they need not tell doctors that they had an abortion because their condition is indistinguishable from someone having a spontaneous miscarriage.REF Presumably, some abortion practitioners may have found this as a way to increase access to abortion or to possibly cover themselves for potentially costly malpractice litigation or bad publicity.
As a result, it is also informative to look at the trends in ER visits due to miscarriage when analyzing the effect of the FDA’s expansion of mifepristone access. An additional regression model was fit to test whether the ER visitation rate due to reported miscarriages increased after the FDA’s policy change.
Methods
Public access data on emergency room visits due to induced abortion complications were obtained for South Carolina for the years 2016–2023, for New Jersey for the years 2016–2022, and for Arkansas for the years 2019–2021. Only a few states have free public access data for ER visits, so reliable data could only be obtained for South Carolina, New Jersey, and Arkansas.
South Carolina began implementing a heartbeat law protecting unborn life on August 23, 2023. Because the policy was in effect for only one month for the 2023 ER visits data, the abortion restriction was assumed to have negligible effect on the total number of ER visits for that year. Arkansas began implementing an abortion restriction on June 24, 2022, so only data for the years 2019–2021 were used in the analysis due to the substantial suppression effect the state’s abortion law had on the number of abortions and, thus, abortion complications.
A linear regression model was fit to the rate of annual ER visits due to complications from induced abortion. A Poisson general linear model (GLM) and a negative binomial GLM were also tried to model the ER visitation rate, but the fit diagnostics were poor for the GLM models and were satisfactory for linear regression. The effect of the FDA’s policy change was captured by an indicator variable for the years after the policy change. The model included state-specific intercepts to account for state-specific variation.
$$\frac{y_{it}}{z_{it}} = \alpha_i + \beta_1 x_{it} + \epsilon_{it}$$
where yit is the count of ER visits due to complications from induced abortion in state i and in year t, zit is the number of abortions,
To model the effect the FDA’s policy change may have had on complications of induced abortion intentionally misreported as miscarriages, public access data on ER visits due to miscarriage were obtained for South Carolina for the years 2016–2023 and for the state of New Jersey for the years 2016–2022.
A linear regression model was fit to the rate of ER visits due to miscarriage per 1,000 live births over a two-state panel. Linear regression was fit to the ER visitation rate for miscarriages because neither a Poisson nor a negative binomial GLM displayed adequate fit but a linear regression model did. The effect of the FDA’s policy was modeled with an indicator variable for the years after the policy change as well as a coefficient modeling the change in trend post-implementation. The model included state-specific intercepts to account for state-specific variation.
Controls were included in the model for the percentage of total live births where the infant had a low birth weight (< 2,500 grams) and the percentage of births where the infant had at least one congenital anomaly. Without these controls, any changes in the ER visitation rate would be solely attributed to the FDA’s policy when in reality they could be attributable to changes in natural miscarriage risk factors. The inclusion of controls excludes the possibility that the ER visitation rate in the post-implementation period changed solely due to risk-factor frequency.
The model is
$$\frac{y_{it}}{b_{it}} = \alpha_i + \beta_1 x_{1it} + \beta_2 x_{2it} + \beta_3 x_{3it} + \beta_4 x_{4it} + \epsilon_{it}$$
where yit is the number of ER visits due to miscarriage for state i in year t, bit is the number of live births, αi is a state-specific intercept, x1 is the indicator for the post-implementation periods, x2 is the post-implementation time trend, x3 is the percentage low birth weight, x4 is the percentage congenital anomalies, and εit is some normally distributed random error with zero mean.
Data
Data for ER visits for both miscarriage and complications from induced abortion for South Carolina were obtained from the South Carolina Revenue and Fiscal Affairs Office.REF ER visits data for New Jersey were obtained from the Hospital Discharge Data Collection System (NJDDCS) from the New Jersey Department of Health.REF ER visits data for Arkansas were obtained from the Arkansas Department of Health.REF
Data on ER visits were restricted to women 15–44 years of age. For South Carolina, data were for fiscal years spanning from October of the previous calendar year to September of the calendar year. For both Arkansas and New Jersey, data were for the calendar year. An assumption was made that the bias in the estimates due to the differing periods for annual data was negligible.
Data on the percentage of births with low birth weight and with congenital anomaly were obtained from the National Vital Statistics System Natality dataset as provided through CDC Wonder.REF
The number of abortions for South Carolina from 2016–2021, for New Jersey from 2016–2020, and for Arkansas for 2019–2021 were as they were reported by the Centers for Disease Control and Prevention.REF Data for South Carolina for 2022–2023 were taken from periodic reports on abortion statistics published by the South Carolina Department of Health and Environmental Control.REF
For New Jersey, there were no reliable abortion incidence data available for 2021–2022 so an autoregressive integrated moving average (ARIMA) model was fit to the time series of the New Jersey abortion rate from 2010–2020. The best fitting ARIMA model was selected via a stepwise regression constrained such that the maximum number of autoregressive and moving-average coefficients could not exceed 5, integration could not be performed more than once, and the total number of ARIMA coefficients were constrained to be 5 or less. The model that minimized the small-sample corrected Akaike information criterion (AICc) had no ARIMA coefficients. A Box-Pierce test fit to the univariate time series found no evidence of serial correlation (Box-Pierce Chi-Squared statistic: 0.74, p-value = 0.39). As a result, the least biased estimate of the abortion rate for New Jersey in the years 2021–2022 was at the mean abortion rate for the years 2010–2020.
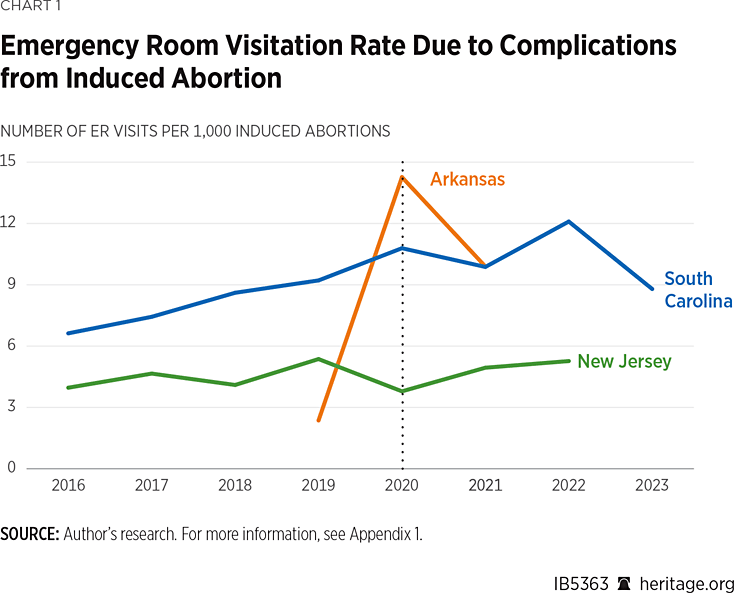
The rate of ER visits due to complications from induced abortion in South Carolina, New Jersey, and Arkansas are shown in Chart 1. The dashed vertical line shows the year the FDA stopped enforcing the in-person dispensing requirement for mifepristone. The ER visitation rate due to abortion appears to have risen in South Carolina and Arkansas after the FDA’s policy change while the trend for New Jersey seems less clear.
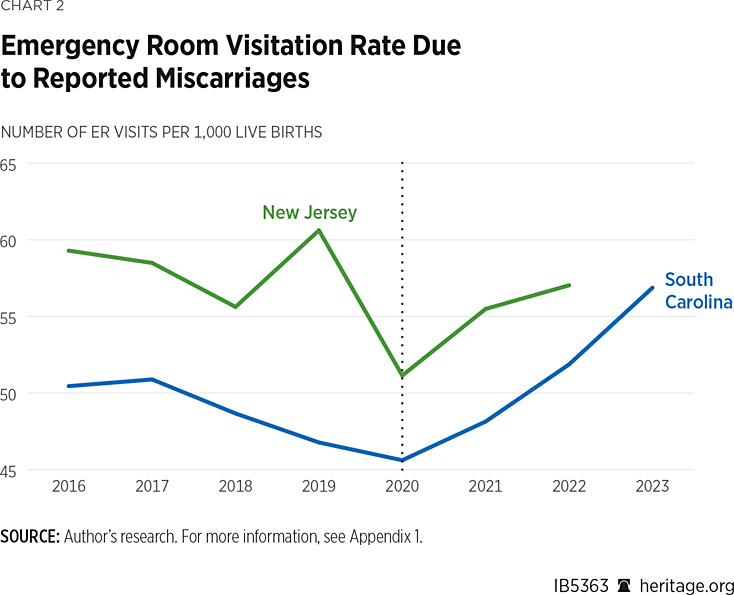
The rate of ER visits due to miscarriage in South Carolina and New Jersey are shown in Chart 2. In both states, there appears to be a sharp change in trend after the FDA’s policy change, but without modelling, it is not clear whether or not this is due to changes in risk factors for miscarriage such as low birth weight and the incidence of congenital anomalies.
Results
Based on the data available, there is significant evidence that the ER visitation rate due to complications from induced abortion increased after the FDA stopped enforcing the in-person dispensing requirement for mifepristone. The effect is significant at the α= 0.05 level.
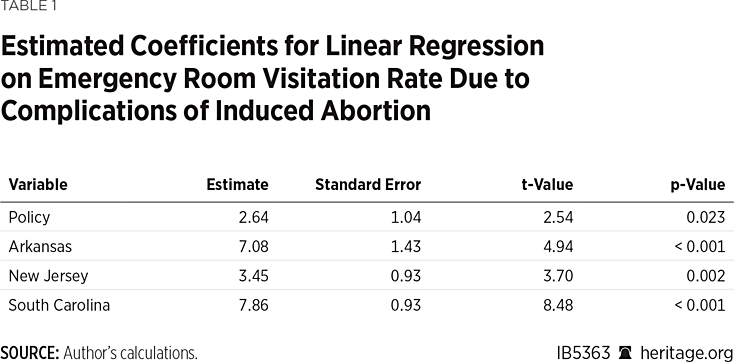
Table 1 shows the estimated coefficients from the regression model. The model predicts that there were on average 2.6 more ER visits from abortion complications for every 1,000 induced abortions after the FDA’s policy change (95% confidence interval: (0.41, 4.87)). This represents an approximately 45 percent increase in the ER visitation rate on average, and between a 7.1 percent and 83.7 percent increase at the 95% confidence level.
The model displayed no evidence of serial correlation (Durbin-Watson statistic: 2.48, p-value = 0.66; Wooldridge test F statistic: 2.27, p-value = 0.16). The model was also consistent with the assumption of homoscedastic errors (Breusch-Pagan Chi-Square statistic: 0.34, p-value = 0.56). As a result, there was no need to use robust standard errors. The use of heteroscedasticity and autocorrelation consistent standard errors did not change the inference on the coefficients (not shown, but available from the author upon request).
The coefficients from the linear regression model fit to the ER visitation rate due to miscarriage are shown in Table 2.
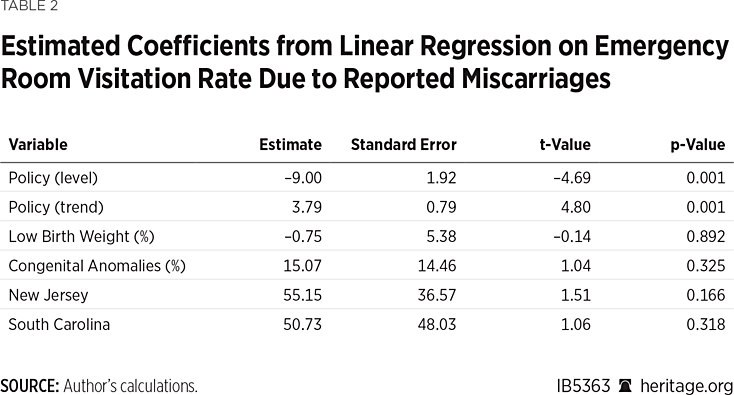
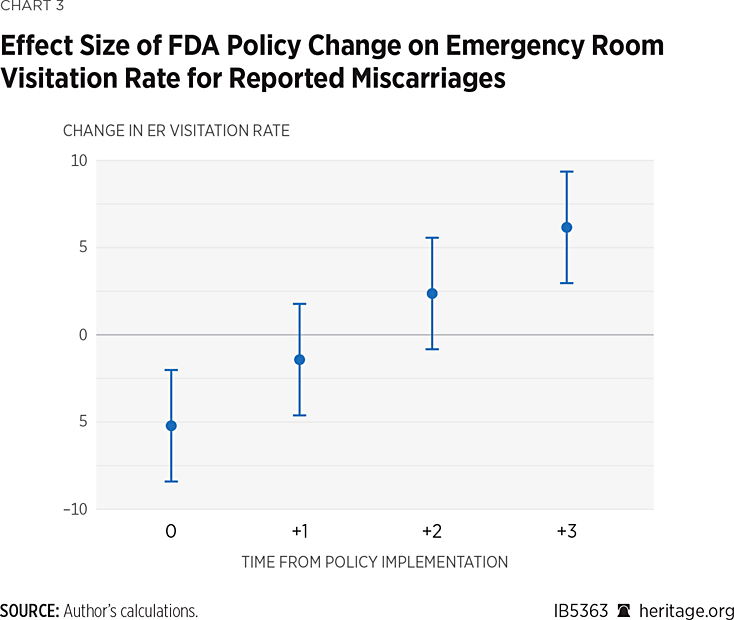
The coefficients for both the post-implementation level and the post-implementation trend were significant at the α= 0.05 level. The coefficients were not jointly significant at the α= 0.05 level in the first three periods post-implementation, but they were significant in the fourth-year post-implementation. In the fourth-year post-implementation, the estimated effect of the FDA’s policy change was a 6.16 point increase in the ER visitation rate due to reported miscarriages (95% confidence interval: (2.96, 9.36)).
Chart 3 visualizes the effect size over time of the FDA’s policy change on the ER visitation rate on reported miscarriages after controlling for miscarriage risk factors. The effect sizes shown in Chart 2 are the joint inference on the policy effect coefficients shown in Table 2 along with their 95% confidence intervals. Intervals that do not include 0 indicate a significant change in the ER visitation rate at the 95% confidence level. Since there are only two observations at each the first, second, and third post-implementation periods, and only one at the fourth, these results should be interpreted with caution.
The model did not show any signs of serial correlation within panels (Durbin-Watson test statistic: 2.76, p-value = 0.75; Wooldridge test F statistic: 2.95, p-value = 0.11). The model also did not display significant heterogeneity (Breusch-Pagan Chi-Square statistic: 0.36, p-value = 0.55). As a result, there was no need to estimate the variance of the coefficients with robust standard errors. Even so, the use of heteroscedasticity and autocorrelation consistent standard errors did not change the inference on the coefficients (not shown, but available from the author upon request).
Conclusion
Based on the available data, there is evidence that the FDA’s removal of the in-person dispensing requirement for mifepristone had an effect on the ER visitation rate due to complications from induced abortion. There is also significant evidence that the ER visitation rate for reported miscarriages increased in the fourth year after the introduction of the FDA’s new policy, even after controlling for changes in the relative frequency of common risk factors for miscarriage. This is a possible indication that the number of misreported miscarriages that were in fact attempted abortions may be on the rise four years after as a result of the FDA’s policy change.
The results should be interpreted with caution. Because the FDA’s policy change on mifepristone was rather recent, there is not enough data in the time series before and after the implementation of the policy to make robust inferences. Typically, a regression should be performed on a longer time series, providing more data points for estimation in the pre- and post-periods. Ideally, we also would have liked to include data for more states to ensure that the trends we see are not simply random noise. Unfortunately, due to the lack of availability of no-cost public use ER visitation data, we were only able to acquire data for three states. Consequently, the results may or may not be generalizable to other states.
Nevertheless, when it comes to expanding access to mifepristone, the stakes are high for maternal morbidity. Consequently, there is substantial benefit in obtaining results, even if preliminary, on the data available for estimating the impact of the FDA’s policy change. Decisions affecting matters as important as public health must rely on the best evidence available, even if the data available are less than ideal.
Public health decisions must be evidence-based, and so far, the evidence points in the direction of a negative impact on maternal health and morbidity as a result of the FDA’s removal of the in-person dispensing requirement for the abortion pill. The FDA should follow evidence-based policy on mifepristone and, thus, should immediately reinstate the mandatory in-person dispensing requirement for mifepristone and reverse its decision allowing retail pharmacies to dispense the drug.
Jonathan Abbamonte is a Senior Research Associate in the Center for Data Analysis at The Heritage Foundation. The author would like to thank Conor Semelsberger for providing data on abortions by state of occurrence for the years 2022 and 2023 as reported in state health department reports.
Appendix 1
Chart 1 Sources:
South Carolina. South Carolina Revenue and Fiscal Affairs Office, Emergency Department Visit Database, https://rfa.sc.gov/_hd/utilization/erquery.php (accessed November 4, 2024).
New Jersey. New Jersey Department of Health, New Jersey State Health Assessment Data, https://www-doh.nj.gov/doh-shad/query/selection/ub/UBSelection.html (accessed November 4, 2024).
Arkansas. Arkansas Department of Health. Induced Abortion Complications Report, 2019-2021, https://healthy.arkansas.gov/programs-services/data-statistics-registries/vital-statistics/ (accessed November 4, 2024).
South Carolina (2016-2021), New Jersey (2016-2020), Arkansas (2016-2021). Centers for Disease Control and Prevention, Abortions Distributed by Area of Residence and Area of Clinical Service, https://www.cdc.gov/reproductive-health/data-statistics/abortion-surveillance-findings-reports.html (accessed November 4, 2024).
South Carolina (2022). South Carolina Department of Health and Environmental Control, A public report providing statistics compiled from all abortions reported to DHEC 2022, https://scdhec.gov/sites/default/files/media/document/2022-Abortion_SC-Report.pdf (accessed November 4, 2024).
South Carolina (2023). South Carolina Department of Health and Environmental Control, A public report providing statistics compiled from all abortions reported to DHEC 2023: Based on data from Jan. 1 through Aug. 22, 2023, https://scdhec.gov/sites/default/files/media/document/Abortion-Report-2023-Part-1-Jan.1-Aug.22.pdf (accessed November 4, 2024). South Carolina Department of Health and Environmental Control, A public report providing statistics compiled from all abortions reported to DHEC 2023: Based on data from Aug. 23 through Dec. 31, 2023, https://scdhec.gov/sites/default/files/media/document/Abortion-Report-2023-Part-2-Aug.22-Dec.31.pdf (accessed November 4, 2024).
New Jersey (2022-2023). Calculated from a modeled assumption that the abortion rate was constant at its 2010-2020 mean.
U.S. Census Bureau. “Annual Resident Population Estimates for 5 Race Groups (5 Race Alone or in Combination Groups) by Age, Sex, and Hispanic Origin for States and the District of Columbia: April 1, 2010 to July 1, 2020,” https://www.census.gov/programs-surveys/popest/technical-documentation/research/evaluation-estimates/2020-evaluation-estimates/2010s-state-detail.html (accessed November 4, 2024). “Annual State Resident Population Estimates for 5 Race Groups (5 Race Alone or in Combination Groups) by Age, Sex, and Hispanic Origin: April 1, 2020 to July 1, 2023,” https://www.census.gov/data/datasets/time-series/demo/popest/2020s-state-detail.html (accessed November 4, 2024).
Chart 2 Sources:
South Carolina. South Carolina Revenue and Fiscal Affairs Office, “Emergency Department Visit Database,” https://rfa.sc.gov/_hd/utilization/erquery.php (accessed November 4, 2024).
New Jersey. New Jersey Department of Health, “New Jersey State Health Assessment Data”, https://www-doh.nj.gov/doh-shad/query/selection/ub/UBSelection.html (accessed November 4, 2024).
Centers for Disease Control and Prevention. Centers for Disease Control and Prevention, “Natality Information,” https://wonder.cdc.gov/natality.html(accessed November 4, 2024).


