
The upward march of retail gasoline prices has affected U.S. households regardless of whether their members drive, take public transportation, or walk. In a modern economy, the interdependency created by supplying specialized labor and trading for all other goods and services produced by other people leaves virtually no one unaffected by the price of gas at the pump.
Analysts at The Heritage Foundation recently examined how going from $3 and $4 retail to $5 and $6 retail per gallon of gasoline would affect the U.S. economy. If prices continue to rise at an accelerated pace over the course of a year:[1]
- Total employment would decrease by 586,000 jobs,
- Disposable personal income would decrease by $532 billion,
- Personal consumption expenditure would decrease by $400 billion, and
- Personal savings would be spent to help pay the cost.
What the Numbers Mean
Table 1 shows what these numbers mean for three representative households' income, consumption, and saving patterns. The first column is the actual data from the 2006 Bureau of Labor Statistics Consumer Expenditure Survey.[2] The simulated impact is in the second column for each type of household, and the third column shows the dollar loss for households.
The estimate is a best case in that mortgage and interest payments remain constant. More likely, increased borrowing and less saving will result in higher interest payments, constraining spending and decreasing the savings of households yet more. It also does not show the increased likelihood that a member of the household will be unemployed.
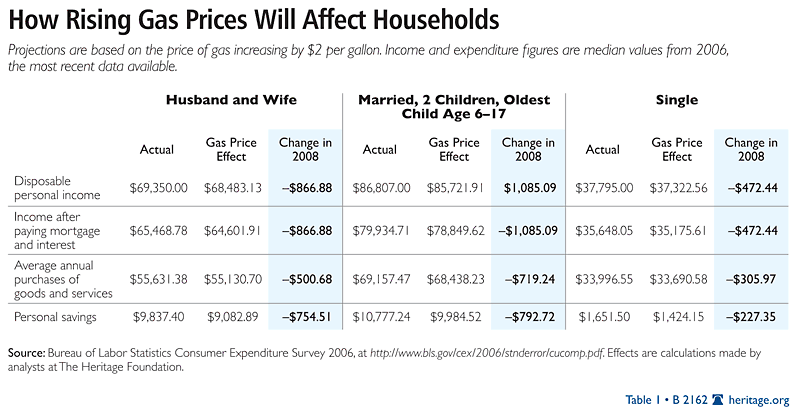
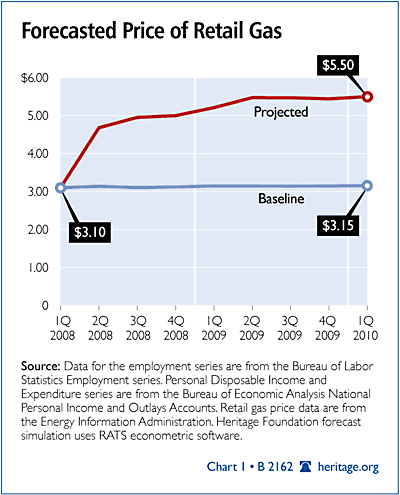
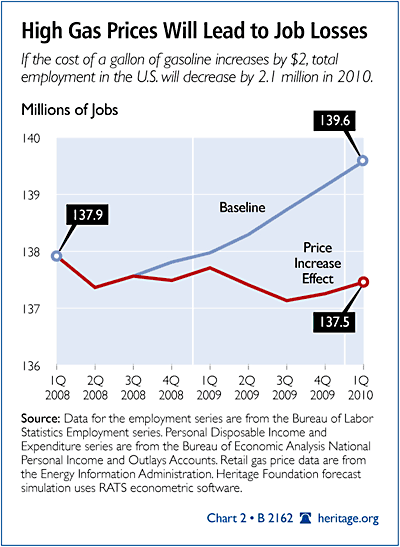
Chart 1 illustrates the baseline gas price forecast and the higher gas price simulation. The effect of gas prices operates directly and indirectly. Chart 2 shows the effect on employment. Both the demand for labor and the supply of labor are negatively affected, and this lowers overall employment. On the demand side, businesses rely heavily on transportation to get their goods and services to the consumer. Many suppliers have their own fleets; others, who outsource their transportation service, must pay higher costs for this service. Higher costs along with decreased consumer purchases will cause businesses to cut back on jobs. The decrease in employment is not entirely attributable to labor demand, though; labor supply may also decrease. Individuals with long commutes may decide to look for other jobs closer to home or give up working altogether.
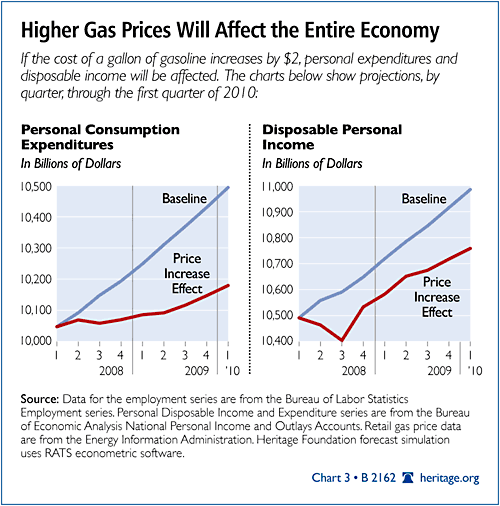
Chart 3 shows the effect on other household variables. Households tap into personal savings immediately to pay for higher fuel costs because personal consumption expenditures (buying habits) are not adjusted downward as fast as real[3] disposable income is decreased. Disposable income decreases almost immediately. Growth in income rebounds but then adjusts to a slower rate as the feedback from job losses begins to drag it down. Consumption expenditure is then further crimped by decreased disposable income, and higher interest payments from increased borrowing start to crowd out other purchases. This results in more losses to savings. As prices continue to rise, consumers do adjust their spending. This can be seen by the slower growth in spending as compared to the baseline. The overall effect after just two years can be seen by the gap between the baseline and the simulation with higher gas prices.
The rise in energy prices at a time when food prices and other commodity prices are rising may solicit a monetary policy response to fight inflationary pressures. Although this effect was not included in the analysis, this would further increase interest rates and constrain the pocketbooks of businesses and households. However, if this policy sends a signal that the Fed is once again targeting inflation, this may go a long way to ease pressure on commodity prices and strengthen the U.S. dollar. Both of these two effects would serve to ease pressure on prices.
Conclusion
Americans are now facing the prospect of even higher prices at the pump. While there are many other economic influences on household expenditure, personal savings, personal disposable income, and total employment, the Heritage analysis simulated the dynamic movement of these variables in response to movements in the retail price of gasoline.
The results of the analysis show that households react by using personal savings in the short term. This reduction in assets slows other spending, leading to slower growth in purchasing.[4] On the supply side, businesses experience higher production costs while demand for their goods is lower, causing them to adjust their employment downward. Individuals, too, may begin to adjust their work choices as longer commutes make working outside the home less beneficial. These two effects reduce overall employment.
There is a feedback effect between employment and personal disposable income. After a sharp decrease, disposable income starts to grow, but this growth is quickly slowed by the loss of jobs. The overall result after just two years is lower employment, lower disposable income, and lower overall consumption of goods and services.
This is purposefully a short-term forecast. The U.S. economy is known for its innovative responses to economic scarcity. Markets that are unconstrained by excessive regulation can give a clear price signal. Higher prices signal the need for more oil. Businesses are attempting to respond to that need by finding new reserves to drill and increasing investment in refining capacity. The high price also signals entrepreneurs to look for new, more efficient ways to supply the energy needs of consumers.
To the extent that the high price is not a clear signal because of excessive taxes and regulations that artificially make oil scarcer, the government can implement policies that would allow for more oil production. The government can also encourage innovations in energy supply by keeping regulatory burdens to a minimum.
Congress should focus on reining in spending and reducing the deficit. This would serve to lower long-term interest rates and strengthen the U.S. dollar, which would help to ease the pressure on prices. Monetary policy that is expected to be inflation-fighting could also aid in stabilizing prices and curb the current flight to commodities.
Karen A. Campbell, Ph.D. , is Policy Analyst in Macroeconomics in the Center for Data Analysis at The Heritage Foundation.
Appendix
Data, Method, and Results
Analysts used Vector Autoregression (VAR) analysis to decompose the historical data and conduct a dynamic forecast simulating a two-dollar increase in the retail price of gasoline. Vector Autoregression is a tool now widely used by economists to gain insights into the dynamic interactions of historical data, measure the impact on other variables to a shock in one of the variables, and make economic forecasts.[5]
This analysis uses the quarterly series for retail gasoline prices (GAS) from the International Energy Agency. Real disposable personal income (DPI) and real personal consumption expenditure (PCE) are from the Bureau of Economic Analysis, and total employment (TE) is from the Bureau of Labor Statistics. The data run from the first quarter of 1980 to the first quarter of 2008. The log of the data was first differenced to achieve stationarity,[6] resulting in 107 usable observations. The series were in real terms.
The following model was estimated.[7] Difl is the logged difference of the variable. J = {1,2,3,4}.[8]
Diflgas(t) = constant + diflgas(t ) + diflgas(t-j)
Diflpce(t) = constant + diflgas(t ) + diflgas(t-j) + diflpce(t-j) + difldpi(t+1-j)
Difldpi(t) = constant + diflgas(t ) + diflgas(t-j) + diflte(t-j)+ difldpi(t-j)
Diflte(t) = constant + diflgas(t ) + diflgas(t-j)+ diflte(t-j) + diflpce(t-j)
Factor variance decomposition of the model shows that after its own lags, retail gas accounts for much of the variance in personal consumption expenditure over the longer term (22 percent). The analysis also shows that over time, rather than diminishing, gas prices have an increasing effect on all three variables.
A forecast from the second quarter of 2008 to the first quarter of 2010 was generated to establish a baseline. The baseline predicted an average retail gas price of $2.61 in the second quarter of 2008, which is slightly higher than the average price in the first quarter of 2008 of $2.58 (in real terms). A shock in gas prices was implemented via a price path that increases the difference in gas prices by 40 percent in the first two quarters, 5 percent in the following quarter, and 10 percent in the quarter after that. The remaining quarters were not "shocked." This resulted in a forecast of average gas prices in the second quarter of 2008 of $3.90 and climbing to $4.58 (in real terms).
In order to estimate the nominal prices, the real gasoline prices were adjusted by a deflator of 1.2. This was the deflator used by the Bureau of Economic Analysis to adjust the consumption and income series. Arguably, this is a best-case scenario of the differences in the baseline versus forecast because the same rate of inflation is assumed for both. To the extent that higher gas prices help to fuel inflation, the gap between the baseline and forecasted amounts will be wider.
Talking Points
- Higher gas prices lower employment, income, and spending.
- Households initially tap their savings to pay the higher prices.
- Consumption growth slows as households adjust to higher gas prices.
- Slower growth in consumption and higher fuel prices for businesses result in lower employment.
- Employment is also decreased by workers trying to change their work patterns to avoid burdensome commutes.
- Lower employment slows the growth in income, which means slower economic growth over time.
- Markets are signaling a need for more supply. Businesses are trying to respond by making investments in refining capacity and finding new energy sources. This should be encouraged.
- Deficit reduction and inflation vigilance are needed to strengthen the dollar and ease pressure on prices and speculation in commodity markets.
Keywords
rising gas prices, gasoline prices, American households, spending patterns, personal consumption, personal savings, U.S. economy


