
Introduction
In 1963, President Lyndon Johnson launched the War on poverty with the goal of eliminating poverty in the United States. Since that time, the U.S. has spent over $11 trillion on anti-poverty programs, providing cash, food, housing, medical care, and services to the poor and near poor. Today, government provides a generous system of benefits and services to both the working and non-working poor. While government continues its massive efforts to reduce poverty, immigration policy in the U.S. has come to operate in the opposite direction, increasing rather than decreasing poverty. Immigrants with low skill levels have a high probability of both poverty and receipt of welfare benefits and services.[1]
Since the immigration reforms of the 1960s, the U.S. has imported poverty through immigration policies that permitted and encouraged the entry and residence of millions of low-skill immigrants into the nation. Low-skill immigrants tend to be poor and to have children who, in turn, add to America's poverty problem, driving up governmental welfare, social service, and education costs.
Today's immigrants differ greatly from historic immigrant populations. Prior to 1960, immigrants to the U.S. had education levels that were similar to those of the non-immigrant workforce and earned wages that were, on average, higher than those of non-immigrant workers. Since the mid-1960s, however, the education levels of new immigrants have plunged relative to non-immigrants; consequently, the average wages of immigrants are now well below those of the non-immigrant population. Recent immigrants increasingly occupy the low end of the U.S. socio-economic spectrum.[2]
The current influx of poorly educated immigrants is the result of two factors: first, a legal immigration system that favors kinship ties over skills and education; and second, a permissive attitude toward illegal immigration that has led to lax border enforcement and non-enforcement of the laws that prohibit the employment of illegal immigrants. In recent years, these factors have produced an inflow of some ten and a half million immigrants who lack a high school education. In terms of increased poverty and expanded government expenditure, this importation of poorly educated immigrants has had roughly the same effect as the addition of ten and a half million native-born high school drop-outs.
As a result of this dramatic inflow of low-skill immigrants,
-
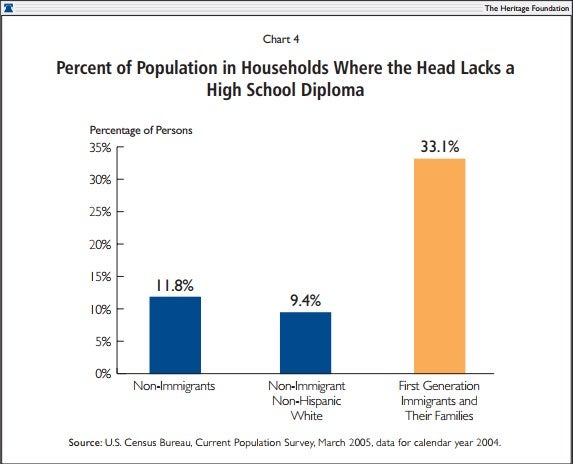
One-third of all immigrants live in families in which the head of the household lacks a high school education; and
-
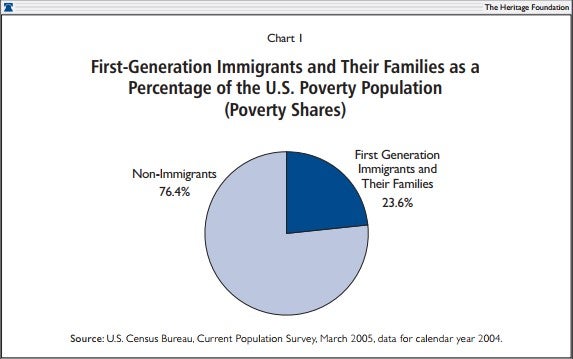
First-generation immigrants and their families, who are one-sixth of the U.S. population, comprise one-fourth of all poor persons in the U.S.
immigration also plays a large role in child poverty:
-
Some 38 percent of immigrant children live in families headed by persons who lack a high school education;
-
Minor children of first-generation immigrants comprise 26 percent of poor children in the U.S.; and
-
One out of six poor children in the U.S. is the offspring of first-generation immigrant parents who lack a high school diploma.
Hispanic immigrants (both legal and illegal) comprise half of all first-generation immigrants and their families. Poverty is especially prevalent among this group. Hispanic immigrants have particularly low levels of education; more than half live in families headed by persons who lack a high school diploma. family formation is also weak among Hispanic immigrants; fully 42 percent of the children of Hispanic immigrants are born out of wedlock. Hispanic immigrants thus make up a disproportionate share of the nation's poor:
-
First-generation Hispanic immigrants and their families now comprise 9 percent of the U.S. population but 17 percent of all poor persons in the U.S.; and
-
Children in Hispanic immigrant families now comprise 11.7 percent of all children in the U.S. but 22 percent of all poor children in the U.S.
Massive low-skill immigration works to counteract government anti-poverty efforts. While government works to reduce the number of poor persons, low-skill immigration pushes the poverty numbers up. In addition, low-skill immigration siphons off government anti-poverty funding and makes government efforts to shrink poverty less effective.
Low-skill immigrants pay little in taxes and receive high levels of government benefits and services. The National Academy of Sciences has estimated that each immigrant without a high school degree will cost U.S. taxpayers, on average, $89,000 over the course of his or her lifetime.[3] This is a net cost above the value of any taxes the immigrant will pay and does not include the cost of educating the immigrant's children, which U.S. taxpayers would also heavily subsidize.
In this way, the roughly six million legal immigrants without a high school diploma will impose a net cost of around a half-trillion dollars on U.S. taxpayers over their lifetimes. The roughly five million illegal immigrants without a high school diploma will cost taxpayers somewhat less because illegal immigrants are eligible for fewer government benefits. However, if these illegal immigrants were granted amnesty and citizenship, as proposed by the Bush Administration and legislated in a recent Senate-passed immigration bill (S. 2611), they could cost taxpayers an additional half-trillion dollars. In total, all immigrants without a high school education could impose a net cost on U.S. taxpayers of around one trillion dollars or more. If the cost of educating the immigrants' children is included, that figure could reach two trillion dollars.[4]
The poverty and other problems associated with mass low-skill immigration would be of less concern if they could be expected to quickly vanish in the next generation. Unfortunately, the evidence indicates that this will not occur. For example, the low levels of education, high levels of poverty, and high levels of out-of-wedlock childbearing found among Hispanic immigrants since 1970 persist among native-born Hispanics in the U.S. to a considerable degree.[5]
These data indicate that the current influx of low-skill immigrants will raise poverty in the U.S. not merely at the present time, but for generations to come. Current low-skill immigrants will raise both the absolute number of poor persons and the poverty rate in the U.S. for the foreseeable future. The greater the inflow of low-skill immigrants, the greater the long-term increase in poverty will be.
immigration and Census Data
This paper uses data from the Current Population Survey (CPS) of the U.S. Census Bureau covering the year 2004 to assess the impact of immigration on poverty in the United States.[6] The Current Population Survey is the principal instrument used in measuring poverty in the U.S. The CPS contains a representative sample of permanent U.S. residents, both native-born and foreign-born persons .
The foreign-born population represented in the CPS includes both legal immigrants and a substantial number of illegal immigrants. The most widely accepted analysis concluded that some 10.3 million illegal immigrants lived in the U.S. in 2004.[7] Of these, some 90 percent are believed to be represented in the CPS.[8]
This paper assesses the contribution of immigration to poverty as reported by official U.S. government statistics. This analysis is therefore limited to the population represented in the CPS sample. To the extent that the CPS under-reports the number of illegal immigrants in the U.S., both the real level of poverty and the role of immigration in poverty will be under-counted by CPS data. Therefore, this paper will also, to a degree, understate the role of immigration in poverty.
The impact of this undercounting of illegal immigrants is probably small. If the real number of illegal immigrants in 2004 was around 10 million, only one million illegal immigrants would not be represented in the CPS. An undercount of this magnitude would not greatly affect the figures presented in this paper.
However, it is possible the illegal immigrant population was much larger than 10 million in 2004. In that case, the undercount of illegal immigrants in the CPS would be proportionately greater. In these circumstances, the role of illegal immigration in generating de facto poverty in the U.S. would almost certainly be significantly greater than the figures in this paper suggest.
Defining the Immigrant Population
One basic issue in measuring immigrant poverty relates to the treatment of minor children born to immigrant parents in the U.S. For example, consider the case of a woman who comes to the U.S. from a foreign country and gives birth to a child in the U.S. without being married. Because the child was born on U.S. soil, he or she is automatically a U.S. citizen. Further, assume that the mother and the child live together and are poor.
The mother and child both add to the ranks of poor persons in the U.S. Conceivably, one might count the mother's poverty as part of immigrant poverty and the child's poverty as part of non-immigrant poverty. In reality, the expansion of U.S. poverty is, in both cases, a consequence of the mother's immigration to the U.S. The number of poor persons would be two fewer if the immigration had not occurred. Thus, it seems reasonable to count both poor immigrants and poor minor children born in the U.S. to immigrant parents as components of immigrant poverty. This paper will follow that procedure.
Methodology
To assess the role of immigrants in U.S. poverty, this paper begins by dividing the U.S. population represented in the CPS into two complementary categories: 1) first-generation immigrants and their family members and 2) non-immigrant citizens.[9]
The first-generation immigrants and their family members category contains three sub-groups:
-
foreign-born adults and children,[10]
-
minor children born in the U.S. who live with their first-generation immigrant parents,[11] and
-
other members of families headed by first-generation immigrants.
The last sub-group consists of native-born adult dependents who live in families headed by first-generation immigrants. These individuals are primarily spouses or young adult children still living with their immigrant parents. These individuals are included in the "first-generation immigrants and their family members" category because their financial status is largely determined by the financial status of the immigrant head of the family. This sub-group is small, consisting of about one percent of the U.S. population; its inclusion in the overall category of first-generation immigrants and their family members has very little effect on the overall poverty numbers presented in this paper.
The non-immigrants category includes all adults and children born in the United States except those who reside in households headed by first-generation immigrants. This group consists of every individual not included in the "first-generation immigrants and their family members" category.
Throughout the paper, "immigrant" and "immigrant families" refer to members of the first-generation immigrants and their family members category defined above. The term "immigrant children" refers to the children in this category. The term "non-immigrant" refers to all persons in the non-immigrant category described above. Except where noted otherwise, figures in this paper were derived from the Census Bureau's Current Population Survey for 2004.
The Size of the Immigrant Population
Overall, 49.3 million first-generation immigrants and their family members lived in the U.S. in 2004; some 13.9 million were children. First-generation immigrants and their family members comprised 16.9 percent of the population. The non-immigrant population numbered 241.8 million, or 83.1 percent of the population. Of these, 59.7 million were children.
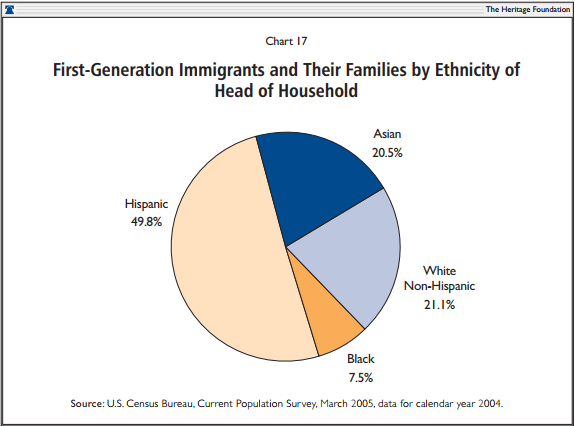
Among first-generation immigrants and their families living in the U.S. in 2004, Hispanics and Asians predominated. Half of first-generation immigrants and family members lived in Hispanic-headed households, and 20 percent lived in Asian-headed households. Some 21 percent lived in households with white non-Hispanic heads, and 8 percent lived in households headed by blacks.
Measuring poverty
Throughout this paper, persons are defined as poor if they lived in households with incomes less that the official government poverty income thresholds. In 2004, the poverty income threshold was $19,157 for a four person family, $15,219 for a three person family, and $9,827 for a single person household. [12]
Two terms used throughout this analysis are "poverty rate" and "poverty share." The poverty rate measures the percentage of a given group (such as immigrants) that is poor. The denominator in this case is the total number of people in the group. For example, if there were 1,000 immigrants in a community and 200 of them were poor, the poverty rate for immigrants would be 20 percent. The "poverty share," by contrast, measures the number of poor persons of a particular type as a share or percentage of all persons in poverty. In this calculation, the numerator is number of poor persons of a particular group (such as immigrants) and the denominator is all poor persons. For example, if there are 100 poor persons in a community and 30 of these poor persons are immigrants, then the immigrant share of poverty would be 30 percent.
Immigration and Poverty
In 2004, some 35.7 million persons lived in poverty in the United States. Among these poor persons, 8.7 million were first-generation immigrants and their family members. Thus, roughly one in four poor persons was an immigrant or member of an immigrant's family.
Immigrants in the U.S. are disproportionately likely to be poor, which means that their share of the poverty population is greater than their share of the general population. While first-generation immigrants and their families comprise one out of four poor persons in the U.S., they are only one out six persons in the general population.
Immigration and Poverty Rates
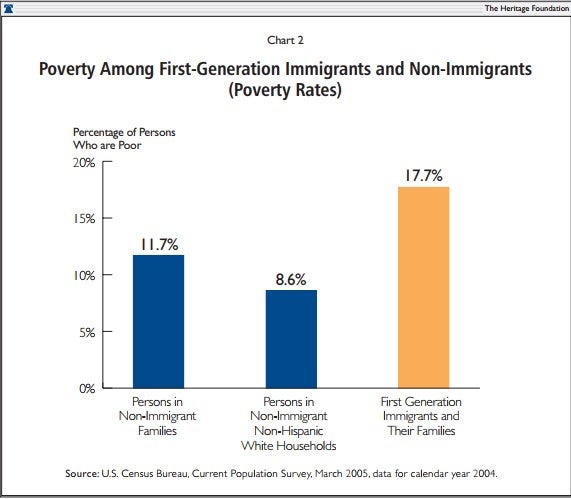
A poverty rate measures the percentage of a group that is poor. Among the 49.3 million first-generation immigrants and their family members living in the United States in 2004, 8.7 million, or 17.7 percent, were poor. By contrast, 11.7 percent of persons living in non-immigrant households were poor, and only 8.6 percent of persons living in households headed by non-immigrant white non-Hispanics were poor. The poverty rate for immigrants was thus twice the rate for non-immigrant non-Hispanic whites.
The high poverty rate for immigrants pushes up the poverty rate for the U.S. population as a whole. Excluding immigrants, the poverty rate in the U.S. would be 11.7 percent. Including immigrants raises the national poverty rate to 12.7 percent.
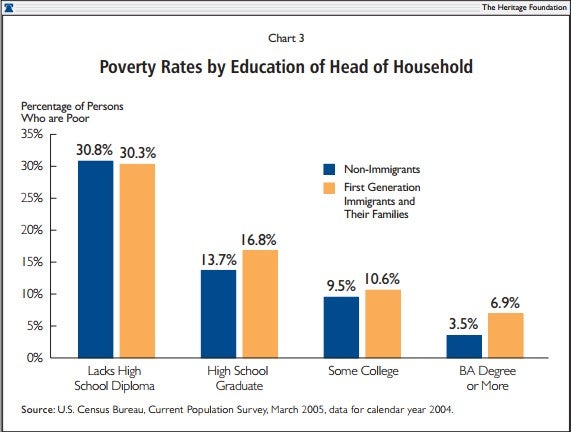
Poverty, Education, and Immigration
Households headed by persons with low education levels are far more likely to be poor. Some 30 percent of persons in households with heads who lack a high school education are poor. By contrast, 4 percent of persons in households with heads who have a college degree are poor. The poverty rates of immigrants and non-immigrants with comparable levels of education are similar. However, the education level of first-generation immigrants is far lower than that of non-immigrants, and so the immigrant poverty rate is higher.
Educational Attainment of First-Generation Immigrants and Non-Immigrants
Both immigrants and non-immigrant households with low levels of education are more likely to be poor. The high level of poverty among first-generation immigrants stems, in part, from their poor education compared to U.S. natives. One-third of all immigrant families are headed by individuals without a high school degree. By contrast, 11.8 percent of non-immigrant families are headed by persons without a high school degree. Among non-immigrant non-Hispanic whites, only 9.4 percent lack a high school degree.
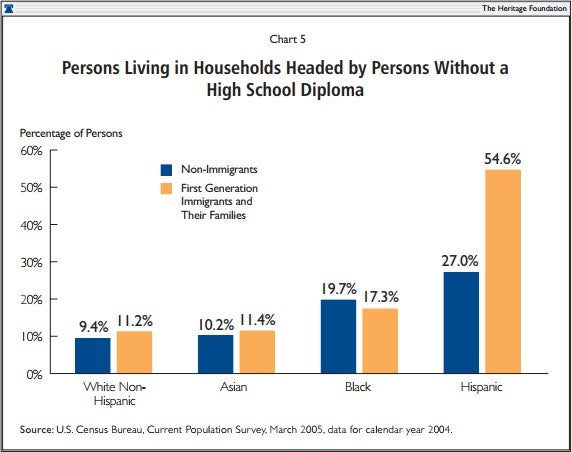
Ethnicity and Education
Ethnic groups in the U.S. differ greatly in their education levels. Hispanics, both immigrants and native-born, have low levels of education compared to the rest of the U.S. population. Some 55 percent of first-generation Hispanic immigrants and family members live in households headed by persons without a high school diploma; among non-immigrant Hispanics, the figure is 27 percent. By contrast, only 11.4 percent of Asian immigrants live in households headed by high school drop-outs; among non-immigrant Asian-Americans, the figure is 10.2 percent. Hispanics' low levels of education contribute to their high level of poverty.
Poverty, Immigration, and Ethnicity
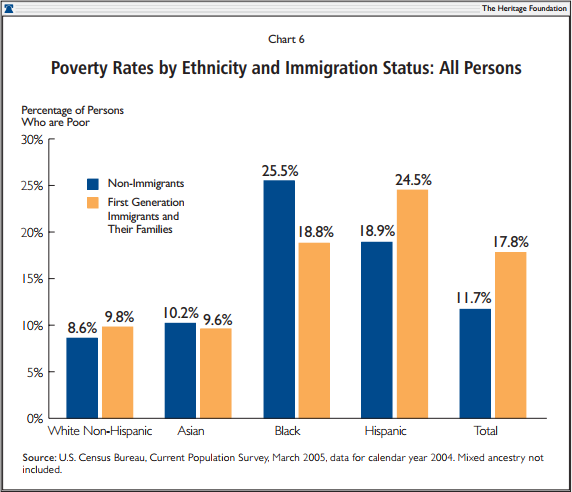
Differences in education levels lead to large differences in poverty between ethnic groups. In 2004, persons in first-generation immigrant families were more than half again as likely to be poor than persons in non-immigrant households (17.8 percent compared to 11.7 percent).
poverty among immigrants varied dramatically by ethnicity. The poverty rate among Asian immigrants was 9.6 percent, only slightly higher than the non-immigrant white non-Hispanic rate of 8.6 percent. The poverty rate among Hispanics immigrants, by contrast, was 24.5 percent. The Hispanic immigrant poverty rate rivals that of non-immigrant blacks in the U.S. and is nearly three times the rate of non-immigrant non-Hispanic whites.
The poverty rate for Hispanic immigrants is very high and remains high even for second- and third-generation Hispanics. The poverty rate for persons in non-immigrant Hispanic households is 18.9 percent, more than twice the rate for white non-Hispanic non-immigrants.
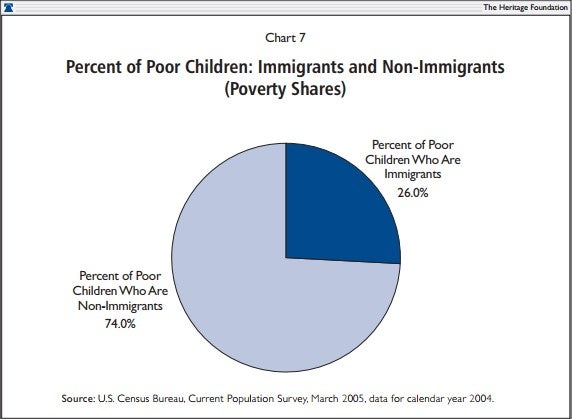
Immigration and Child Poverty Shares
Children in first-generation immigrant families are disproportionately likely to be poor. Overall, some 12.9 million children (persons under age 18) lived in poverty in the United States in 2004. Of these, 3.4 million were immigrants or native-born children of first-generation immigrant parents. Children in immigrant families represent 18.9 percent of all children but 26.0 percent of all poor children.
Immigration and Child Poverty Rates
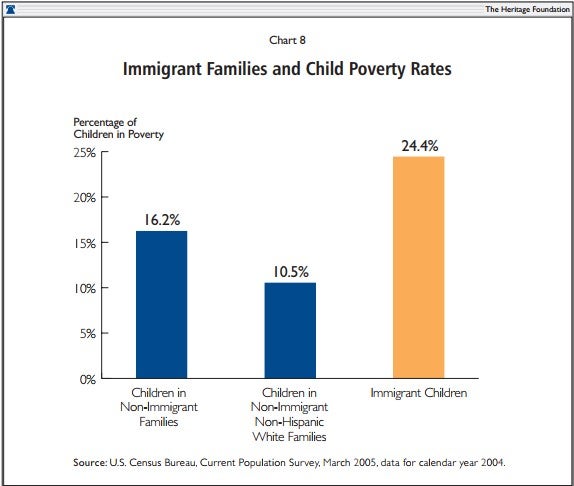
poverty rates among immigrant children are far higher than those among children with non-immigrant parents. Nearly one-fourth of all children in immigrant families were poor in 2004. By contrast, 16.2 percent of children in non-immigrant families were poor. The poverty rate among immigrant children is 50 percent higher than the rate among non-immigrant children.
The child poverty rate among non-immigrant families is inflated by high child poverty rates among non-immigrant Hispanic and black families. A clearer sense of the impact of immigration on child poverty can be seen by comparing the poverty rate among immigrant children (24.4 percent) with the poverty rate among non-immigrant, non-Hispanic white children (10.5 percent). Immigrant children are thus more than twice as likely to live in poverty as non-immigrant, non-Hispanic white children.
Child poverty and Parental education
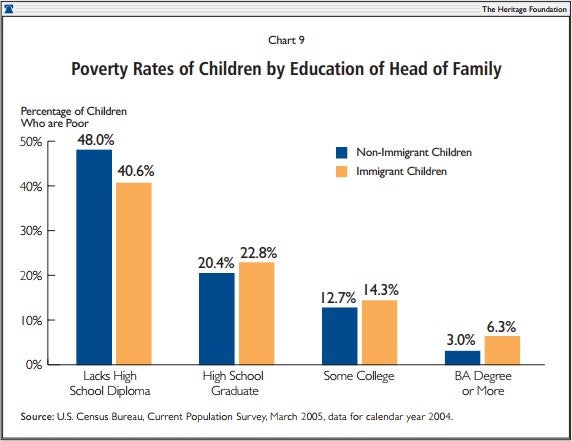
Child poverty is to a great degree driven by the education level of the parent. The lower the level of parental education the higher the probability of child poverty. Chart 9 shows the poverty rates for children in first-generation immigrant and non-immigrant families based on the education level of the head of the family.
poverty rates among immigrant and non-immigrant children are similar for children whose parents have similar levels of education. Obviously, the poverty rates among children whose parents have low levels of education are far higher than the rates among children of well-educated parents. For example, the poverty rate among immigrant children whose parents lack a high school diploma (at 40.6 percent) is more than six times higher than the poverty rate among immigrant children with college-educated parents (6.3 percent).
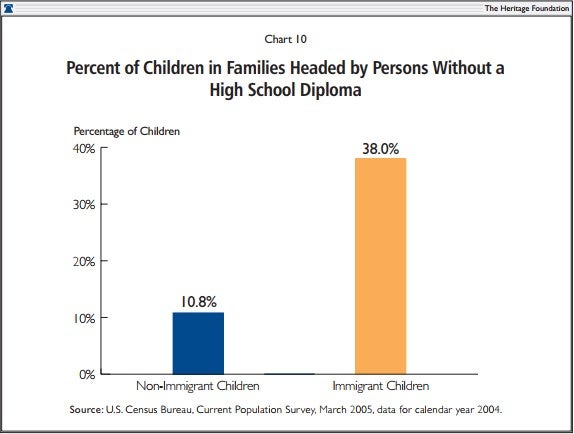
Immigration and Parental education
Immigrant children are far more likely to have poorly educated parents. Among the 13.7 million immigrant children in the U.S., 5.2 million, or 38 percent, live in families headed by persons without a high school diploma. By contrast 10.8 percent of non-immigrant children live in families headed by persons without a high school diploma.
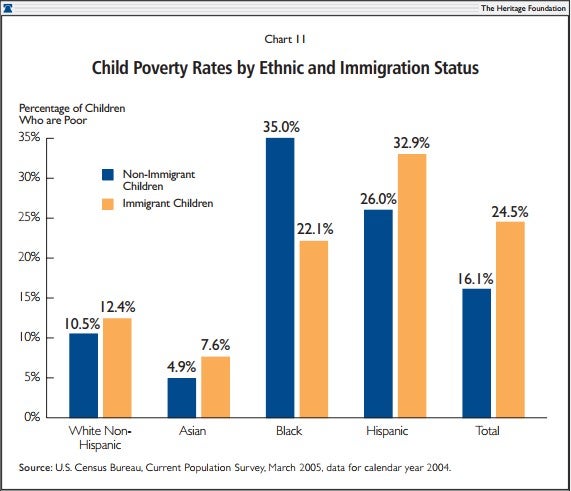
Child poverty, immigration, and Ethnicity
Because their parents have lower levels of education, Hispanic immigrant children are more likely to be poor. In 2004, the poverty rate for children from Hispanic immigrant families was 32.9 percent. This is higher than the poverty rates for children in black immigrant families (22.1 percent), Asian immigrant families (7.6 percent), and white non-Hispanic immigrant families (12.4 percent.)
High child poverty rates persist among non-immigrant Hispanic families. More than one quarter of children in non-immigrant Hispanic families are poor. This rate is lower than among black non-immigrant households but is far higher than the rates among whites and Asians.
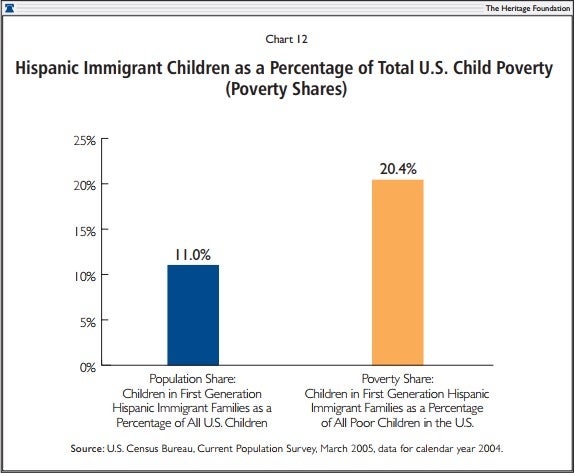
Hispanic Immigrants and Child poverty Shares
There were 7.9 million children in first-generation Hispanic immigrant families in the U.S. in 2004. These children comprise a large and disproportionate share of poor children in the U.S. Though children in first-generation Hispanic immigrant families comprised 11.0 percent of all children in the U.S., they were 20.4 percent of all poor children.
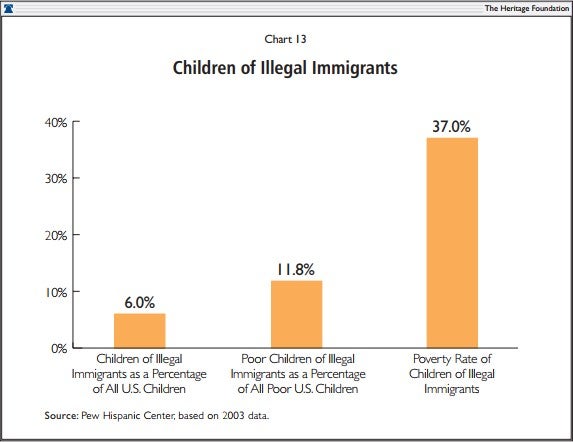
Illegal immigration and poverty
According to the Pew Hispanic Center, 4.7 million children with illegal immigrant parents currently live in the U.S.[13] Some 37 percent of these children are poor.[14] While children of illegal immigrant parents comprise around 6 percent of all children in the U.S., they are 11.8 percent of all poor children.
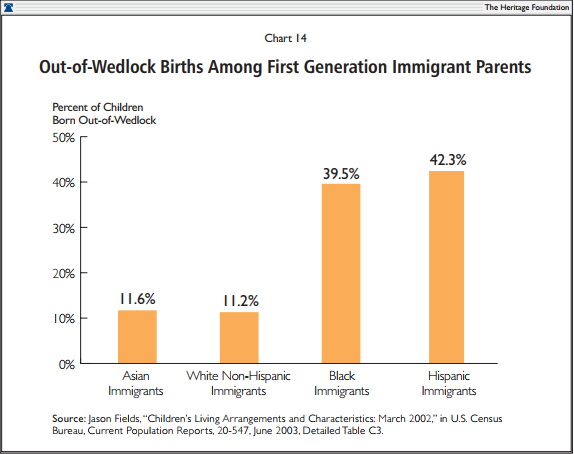
immigration, Ethnicity, and Out-of-Wedlock Childbearing
In addition to the low levels of education among Hispanic parents, a second major factor contributing to Hispanic immigrant child poverty is the high level of family disintegration among Hispanics, both immigrants and non-immigrants. Out-of-wedlock childbearing is more common among first-generation Hispanic immigrants than among any other immigrant group. In the U.S. in 2003, some 42 percent of children of first-generation immigrant Hispanic mothers were born outside marriage. Among black immigrant mothers, the rate was 39.5 percent; among Asian immigrants, 11.6 percent; and among white non-Hispanic immigrants, 11.2 percent. Among native-born Hispanic women, the out-of-wedlock childbearing rate is even higher at 49.6 percent.
In general, children born and raised outside marriage are seven times more likely to live in poverty than are children born and raised by married couples. Children born out of wedlock are also more likely to be on welfare, to fail in school, to have emotional problems, to abuse drugs and alcohol, and to become involved in crime.[15]
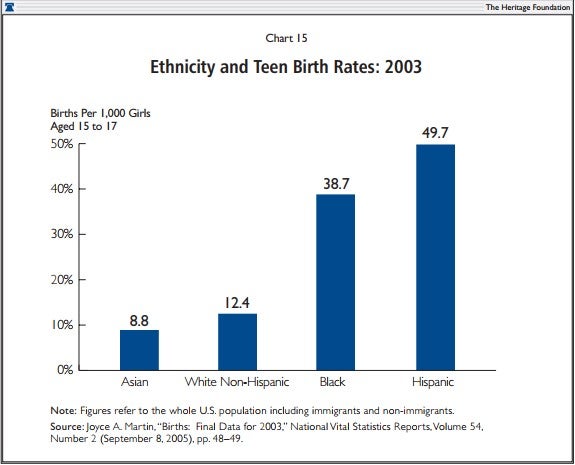
Ethnicity and Teen Birth Rates
Teen birth rates can be measured by births per 1,000 girls aged 15 to 17 years. Hispanics have the highest teen birth rates of all ethnic groups. Among Hispanics, there were 49.7 births per 1,000 teenage girls. This is higher than the black teen birth rate (38.7 births) and far higher than the Asian rate (8.8 births). The Hispanic teen birth rate is four times higher than the rate among non-Hispanic whites.
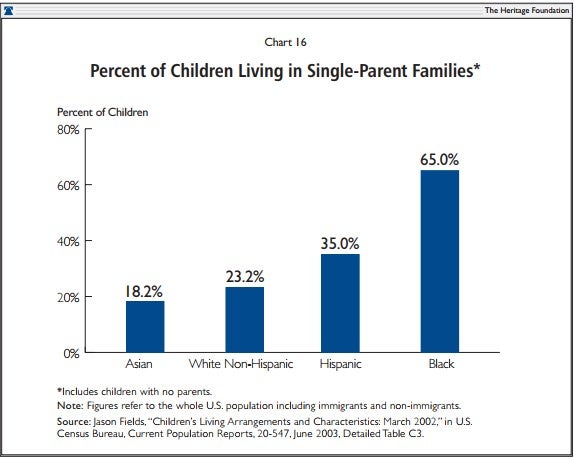
Ethnicity and Single-Parent Families
Similar patterns are found in the percentage of single-parent families among various ethnic groups. More than a third of all Hispanic children (including those with immigrant and non-immigrant parents) live in single-parent homes. This is far lower than the rate among blacks (65 percent) but higher than the rates among non-Hispanic whites (23.2 percent) and Asians (18.2 percent).
Ethnicity and the Immigrant Population
The low levels of education among Hispanic immigrant parents and their high rate of out-of-wedlock childbearing are of particular concern because Hispanics (both legal and illegal) represent a very large portion of the current inflow of immigrants into the U.S.
There were 49.3 million first-generation immigrants and family members living in the U.S. in 2004. Of these, 50 percent were in Hispanic families; 20 percent were in Asian families; 21 percent in white non-Hispanic families and 7.5 percent in black families.
The ethnic distribution of current immigrants differs widely from that of the non-immigrant U.S. population. There were 241.8 million non-immigrants in the U.S. in 2004. Of these: 7 percent were in Hispanic families; 1 percent in Asian families; 13 percent in black families and 78 percent in white non-Hispanic families.
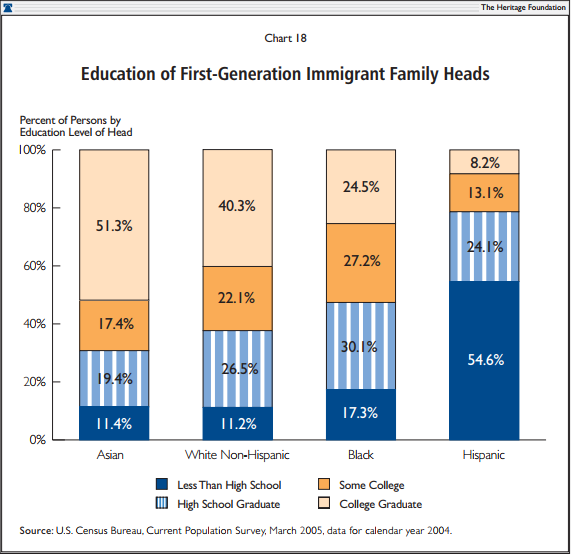
Ethnicity and education Among First-Generation Immigrant Families
Chart 19 gives additional data on the education levels of various immigrant groups. Among household heads, Hispanic immigrants have the highest percentage of high school drop-outs and the lowest level of college graduates. Some 54.6 percent of first-generation Hispanic immigrant families are headed by individuals who lack a high school degree; among Asian immigrant families, the number is 11.4 percent.
Only 8.2 percent of first-generation Hispanic immigrant families are headed by college graduates. By contrast, 51.3 percent of first-generation Asian immigrant families are headed by college graduates.
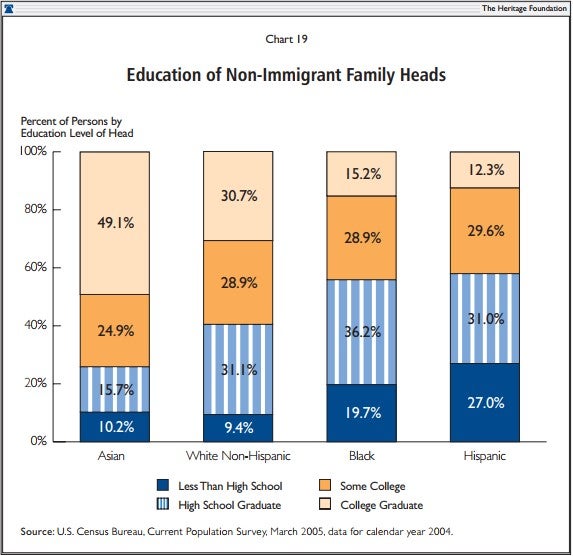
Ethnicity and education Among the Non-Immigrant Population
Concern over the low levels of education and high levels of poverty among first-generation immigrants might be mitigated if these problems quickly vanished in future generations. However, the evidence indicates that, to a considerable degree, these problems will persist far into the future. Among the heads of non-immigrant families, Hispanics still have the highest level of high school drop-outs and the lowest level of college graduation. Some 27 percent of non-immigrant Hispanic heads lack a high school degree, compared to 10.2 percent among non-immigrant Asians. Only 12.3 percent of non-immigrant Hispanic heads have a college degree; the rate among non-immigrant Asians is 49.1 percent.
While second-generation Hispanics do show improvements in education and wages relative to first-generation Hispanic immigrants, these improvements plateau in the third and subsequent generations. These subsequent generations do not show improvements relative to second-generation Hispanics; education, in particular, stagnates at a comparatively low level. Continuing low levels of education mean that the descendants of Hispanic immigrants are on a "slow assimilation trajectory" relative to the rest of society.[16] Low education levels contribute to high levels of persistent poverty among non-immigrant Hispanics, as shown in the next chart.
The Persistence of poverty
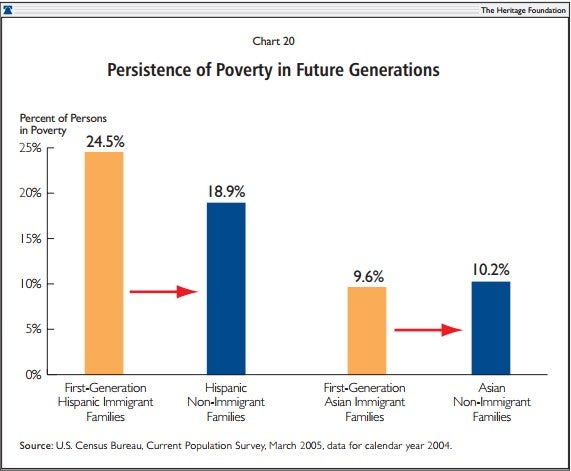
Given the low levels of education and the high levels of out-of-wedlock childbearing among native-born Hispanics in the U.S., it is not surprising that poverty persists among this group. Although the poverty rate among non-immigrant Hispanics is lower than the rate among first-generation Hispanic immigrants, it is still quite high compared to the rates of other ethnic groups.
The poverty rate among first-generation Hispanic immigrants and their families is 24.5 percent. Among families headed by non-immigrant Hispanics, the poverty rate falls somewhat but remains at a relatively high 18.9 percent. This rate is exceeded among non-immigrants only by the poverty rate among non-immigrant blacks (25.5 percent). By contrast, the poverty rate among Asian immigrants starts out at a much lower level (9.6 percent) and remains low among non-immigrant Asians (10.2 percent).[17]
These data indicate that the current rapid influx of low-skill immigrants will raise poverty in the U.S., not merely at the present time, but for generations to come. Current low-skill immigrants will raise both the absolute number of poor persons and the poverty rate in the U.S. for the foreseeable future. The greater the inflow of low-skill immigrants, the greater the long-term increase in poverty will be.
welfare Spending and education
The United States has a very extensive means-tested welfare system. Means-tested welfare programs provide aid to persons and families below certain income thresholds. For example, Foods Stamps is a means-tested aid program; Social Security and Medicare, which provide benefits to eligible persons irrespective of other income, are not. Generally means-tested programs target aid to poor and near poor Americans.
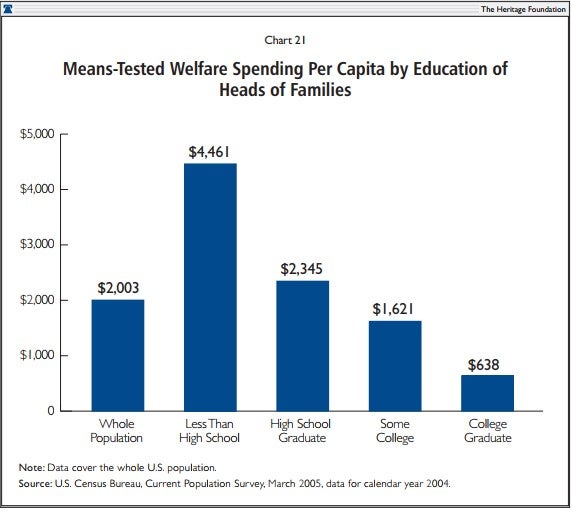
The federal government operates over 80 means-tested welfare programs. Major means-tested aid programs include Temporary Assistance to Needy Families, the Earned Income Tax Credit, Supplemental Security Income, Food Stamps, the nutrition program for Women, Infants and Children (WIC), public housing, Head Start, and Medicaid. Total spending by federal and state governments on means-tested welfare aid came to $583 billion in 2004.[18] The total population of the U.S. in that year was around 291 million. Dividing total means-tested expenditure ($583 billion) by the population (291 million) yields an average welfare spending figure of $2,003 per capita on means-tested welfare benefits. This is, of course, an artificial figure because most Americans do not receive means-tested benefits.
The lower the education of a family head, the more means-tested welfare aid a family is likely to receive. For example, in the whole U.S. population, families headed by persons without a high school diploma, on average, receive $4,461 in means-tested assistance per family member per year. By contrast, families headed by college graduates, on average, receive $638 per person.[19]
Because immigrants have comparatively low education levels, they have a high propensity to be poor and thus to receive welfare benefits. The fiscal impact of this is somewhat offset by the fact that illegal immigrants, who constitute around a third of all immigrants, are ineligible for most welfare programs.
welfare benefits are only part of the costs that low-skill immigrants impose on government. The National Academy of Sciences estimated that, on average, each immigrant without a high school education creates a net cost to government (i.e., benefits received minus taxes paid) of $89,000 over the course of his or her lifetime. The net cost to government of low-skill immigrants is so large that even when the projected taxes and benefits of the immigrant's descendents over the next 300 years are added into the calculation, the long-term net present value to the government of immigrants without a high school education remains negative.[20]
Discussion
America is in the midst of a massive social and demographic transformation. immigration levels now nearly rival those of the "great migration" at the beginning of the 20th century. As a result, first-generation immigrants and their immediate families comprise one out of seven Americans.
In earlier periods, immigrants to the U.S. had education levels similar to those of the non-immigrant population and the wage levels of immigrants were, on average, higher than those of non-immigrants.[21] As a result, in part, of legislative changes starting in the mid-1960s, the pattern of immigration has shifted dramatically. Today's immigrants, on average, have very low skill and education levels compared to the non-immigrant work force.[22] In recent years, the U.S. has imported some 10.5 million immigrants who lack a high school diploma. Among current immigrants, one in three does not have a high school education.
The current mass influx of low-skill immigration stems from two factors. The first is a legal immigration system that emphasizes kinship ties over immigrant skills and education. The second is the failure to enforce existing laws against hiring illegal immigrants and lax border enforcement, which together have encouraged massive illegal low-skilled immigration over the U.S.-Mexican border. Of the 10.5 million immigrants lacking a high school education in the U.S., roughly half have entered the country illegally.
Poorly educated immigrants impose large costs on U.S. taxpayers. Any taxes they pay are greatly outweighed by the costs of the government benefits they consume. The National Academy of Sciences has estimated that the average immigrant without a high school degree will impose a net cost of nearly $100,000 on U.S. taxpayers over the course of his or her life. This cost is in excess of any taxes paid and does not include the cost of educating the immigrant's children.
This means that the six million immigrants lacking a high school diploma and legally residing in the U.S. today will cost taxpayers more than a half trillion dollars over their lifetimes. Moreover, if the five million illegal immigrants who lack a high school education are granted amnesty and citizenship, as proposed by the Bush Administration and legislated in a Senate-passed immigration bill (S. 2611), overall costs would rise considerably; the overall net cost to government of immigrants without a high school diploma could reach one trillion dollars or more. If the cost of educating immigrants' children is included, the figure could reach two trillion dollars.
Similarly, a draft immigration plan outlined by Congressman Mike Pence (R-IN) could be criticized as a de facto amnesty program and would permit an unlimited inflow of immigrants in future years, all of whom would be put on a path to eventual citizenship. Like the Senate immigration bill, the Pence plan could greatly increase low-skill immigration, leading to increased poverty and substantially increased costs for the U.S. taxpayer.
Low skill immigration increases poverty in America
Immigrants and their families now comprise one out of four poor Americans. Poor immigrants pay little in taxes and consume large levels of government services including medical care, welfare, and public education. The increase in poverty due to immigration can impose costs well beyond the immediate cost of current welfare benefits for immigrants. By magnifying the public perception of poverty, immigration can create political leverage for new anti-poverty programs. Immigration-induced poverty can easily have spillover effects resulting in new government entitlements for all poor Americans.
Conclusion
The U.S. offers enormous economic opportunities and societal benefits. Hundreds of millions more people would immigrate to the U.S. if they had the opportunity. Given this context, the U.S. must be selective in its immigration policy. Policymakers must ensure that the interaction of welfare and immigration does not expand the welfare-dependent population, thereby hindering rather than helping immigrants and imposing large costs on American society.
U.S. immigration policy should encourage high-skill immigration and strictly limit low-skill immigration. In general, government policy should limit immigration to those who will be net fiscal contributors, avoiding those who will increase poverty and impose new costs on overburdened U.S. taxpayers.
It is sometimes argued that since higher-skill immigrants are a net fiscal plus for the U.S. taxpayers while low-skill immigrants are a net loss, the two cancel each other out and therefore no problem exists. This is like a stock broker advising a client to buy two stocks, one which will make money and another that will lose money. Obviously, it would be better to purchase only the stock that will be profitable and avoid the money losing stock entirely. Similarly, low-skill immigrants increase poverty in the U.S. and impose a burden on taxpayers that should be avoided.
Current legislative proposals that would grant amnesty to illegal immigrants and increase future low-skill immigration would represent the largest expansion of the welfare state in 30 years. Such proposals would increase poverty in the U.S. in the short and long term and dramatically increase the burden on U.S. taxpayers.
Robert Rector is Senior Research Fellow in Domestic Policy Studies at The Heritage Foundation.


