The Environmental Protection Agency (EPA) wants to implement stronger air pollution restrictions on ozone (smog) for the stated purpose of improving public health.[1] These regulations are misguided because they would impose significant costs for little or no benefit.[2] At the same time, policies being implemented at the state and local levels and proposed at the federal level are working to undermine any improvement of air quality.
Population Density and Air Pollution
For years, regional transportation plans, public officials, and urban planners have been seeking to densify urban areas, using strategies referred to as “smart growth” or “livability.” They have claimed that densifying urban areas would lead to lower levels of air pollution, principally because it is believed to reduce travel by car. In fact, however, EPA data show that higher population densities are strongly associated with higher levels of automobile travel and more concentrated air pollution.[3]
This is illustrated by county-level data for nitrogen oxides (NOx) emissions, which is an important contributor to ozone formation. This analysis includes the more than 425 counties in the nation’s major metropolitan areas (those with more than 1 million in population).[4]
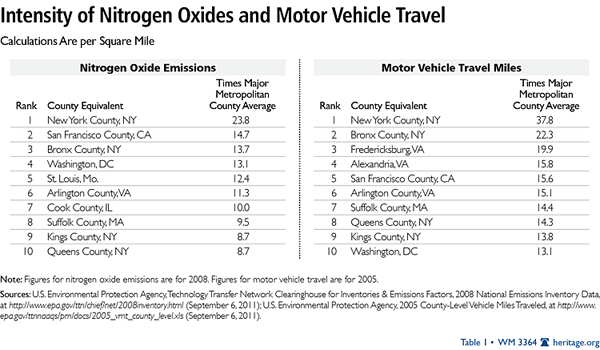
Seven of the 10 counties with the highest NOx emissions concentration (annual tons per square mile)[5] in major metropolitan areas are also among the top 10 in population density (2008). New York County (Manhattan) has by far the most intense NOx emissions and is also by far the most dense. Manhattan also has the highest concentration of emissions for the other criteria air pollutants, such as carbon monoxide, particulates, and volatile organic compounds (2002 data).[6] New York City’s other three most urban counties (Bronx, Kings, and Queens) are more dense than any county in the nation outside Manhattan, and all are among the top 10 in NOx emission density. (See Table 1.)
Traffic and Air Pollution
More concentrated traffic also leads to greater traffic congestion and more intense air pollution. The data for traffic concentration is similar to population density.[7] Manhattan has by far the greatest miles of road travel per square mile of any county. Again, seven of the 10 counties with the greatest density of traffic are also among the 10 with the highest population densities. As in the case of NOx emissions, the other three highly urbanized New York City counties are also among the top 10 in the density of motor vehicle travel. (See Table 1.)
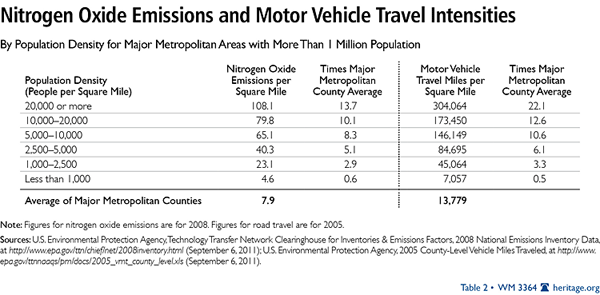
The overall relationship between higher population densities and both NOx concentration and motor vehicle traffic intensity is illustrated in Table 2. There is a significant increase in the concentration of both NOx emissions and motor vehicle travel in each higher category of population density. For example, the counties with more than 20,000 people per square mile have NOx emission concentrations 14 times those of the average county in these metropolitan areas, and motor vehicle travel is 22 times the average.[8] A smaller sample of the most urbanized counties (those with 90 percent or more of the land urbanized) showed a stronger association.[9] Even research by the Sierra Club and a model derived from that research by ICLEI–Local Governments for Sustainability, both strong supporters of densification, show that traffic volumes increase with density.[10]
The Goal: Improving Public Health
These data strongly indicate that the densification strategies associated with smart growth and livability are likely to worsen the concentration of both NOx emissions and motor vehicle travel.
But there is a more important impact. A principal reason for regulating air pollution from highway vehicles is to minimize public health risks. Any public policy that tends to increase air pollution intensities will work against the very purpose of air pollution regulation—public health. The American Heart Association[11] found that air pollution levels vary significantly in urban areas and that people who live close to highly congested roadways are exposed to greater health risks. The EPA also notes that NOx emissions are higher near busy roadways.[12] The bottom line is that—all things being equal—higher population density, more intense traffic congestion, and higher concentrations of air pollution go together.
All of this could have serious consequences as the EPA expands the strength of its misguided regulations. For example, officials in the Tampa–St. Petersburg area have expressed concern that the metropolitan area will not meet the new standards, and they have proposed densification as a solution, consistent with the misleading conventional wisdom. The reality is that this is likely to make things worse, not better. Officials there and elsewhere need to be aware of how densification worsens air pollution intensity and health risks and actually defeats efforts to meet federal standards.
Growth That Makes Areas Less Livable
There are myriad difficulties with smart growth and livability policies, including their association with higher housing prices, a higher cost of living, muted economic growth, and decreased mobility and access to jobs in metropolitan areas. As the EPA data show, the densification policies of smart growth and livability also make air pollution worse for people at risk, while increasing traffic congestion.[13]
Wendell Cox, Principal of the Wendell Cox Consultancy in the St. Louis area, is a Visiting Fellow in the Thomas A. Roe Institute for Economic Policy Studies at The Heritage Foundation.


