Introduction
Public health officials here and throughout most of the world agree that mask wearing has some value in reducing the rate at which COVID-19 spreads. As a result, numerous states and localities, including the State of Kansas, have issued requirements mandating the use of face masks. Although controlled studies of mask mandates are rare due to the nature of the pandemic, the optional structure of the statewide mandate in Kansas provides an opportunity to evaluate their efficacy.
Specifically, Kansas Governor Laura Kelly (D) signed an executive order on July 2, 2020, that required “the wearing of facemasks in most indoor and many outdoor public places,” effective July 3, 2020, but the order allowed individual counties to opt out of the requirement.REF As of August 11, 24 counties in Kansas (representing 67 percent of the state population) had a mask mandate in place, while 81 counties had opted out. Thus, the state executive order essentially set up a quasi-randomized control group of counties without a mask mandate to compare to those with a mandate.REF
Although the executive order did not explicitly create a controlled experiment for mask wearing, studying the spread of COVID-19 before and after these dates in the two groups of counties can provide at least some insight into the efficacy of the mask mandate in Kansas.REF This Heritage Special Report analyzes COVID-19 case proliferation and mortality among Kansas counties that mandated masks relative to those that did not. It also evaluates one of the few published studies of the Kansas mask mandate and finds that the study, published by the Centers for Disease Control and Prevention, fails to demonstrate that the mandate was effective.REF
We find that counties that instituted mask mandates did report lower case incidence (cases per 100,000) in some periods compared to counties that did not. However, our analysis demonstrates that these differences are not statistically significantREF and the overall trends are similar in both groups of counties. Our analysis also indicates that, after the imposition of the mandate, trends in COVID-19 proliferation continued to increase in Kansas counties with and without mandates. The CDC study fails to examine the mandate question with this level of statistical rigor—and ultimately makes incorrect statements regarding trends.
Our analysis does not deny the efficacy of mask wearing per se, nor should it discourage the practice. In fact, mask use during the pandemic has been recommended by The Heritage Foundation’s Coronavirus Commission guidelines.REF However, our findings do suggest that public health strategies relying predominantly on mask mandates are inadequate, and thus other initiatives, in addition to mask-wearing, should have been a component of policies aimed to limit the spread of the disease. We hope that our analysis provides the public, as well government agencies, with a number of ideas for improving statistical analysis of public health data.
Mask Usage in Kansas
At the request of The New York Times, the firm Dynasta conducted a survey between July 2 and July 14, 2020, to assess the level at which people were wearing masks across the country. The firm garnered 250,000 responses, compiling county-by-county data that was presented visually on The New York Times website and posted on Github.com.REF The survey asked respondents: “How often do you wear a mask in public when you expect to be within six feet of others?” and instructed respondents to respond “never,” “rarely,” “sometimes,” frequently,” or “always.” Since the data was gathered in the first weeks of July, data from Kansas provides insight as to whether the state mask mandate (at least initially) influenced mask usage.REF
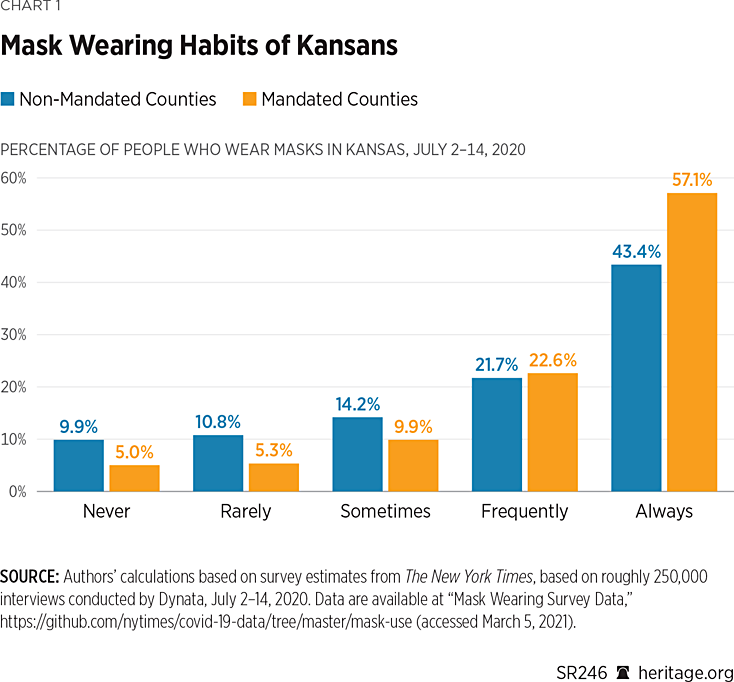
As seen in Chart 1, the data suggest a notable difference in mask usage in Kansas amongst the 24 counties that implemented mask mandates, compared to the 81 that did not. In particular, more than 79 percent of people in mandate counties either frequently or always wore masks during the period examined, while only 65 percent of people did so in the counties that did not mandate mask wearing. Moreover, approximately twice the percentage of people in non-mandate counties reported either never or rarely wearing masks, compared to those in counties with mandates. Thus, these data suggest that there was a difference in mask usage across Kansas counties immediately after the state initiated its mask mandate.
One can also use these survey responses to compute the probability that in a random encounter amongst five people, all five will be wearing masks.REF For counties that implemented mask mandates, the probability that an encounter consisting of five people will result in all five wearing a mask is 0.35. On the other hand, for counties that did not implement these mandates, the probability is 0.12.
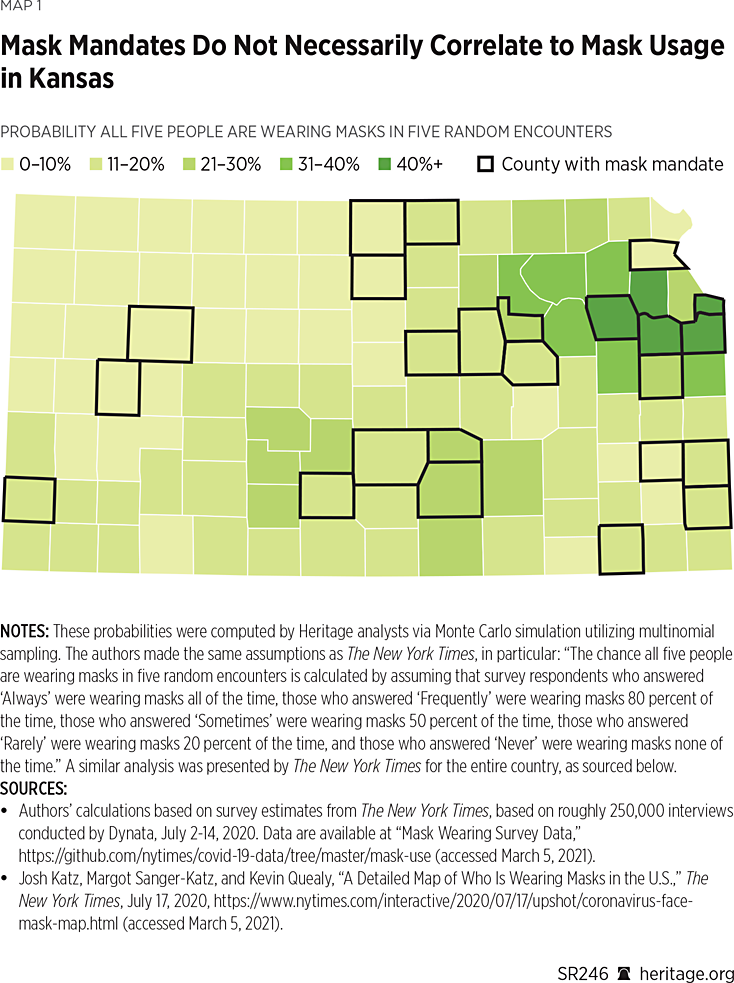
One important consideration is that these probabilities are based on weighted survey data, using population size as the sample weight.REF As a result, counties such as Johnson and Shawnee are more heavily weighted than less populated counties. Although this feature is precisely the purpose of computing a weighted average—to provide more weight to certain more conspicuous observations than others—this type of analysis can also sometimes be misleading because it can obscure important variation. To see why, Map 1 depicts the probability, for every county in Kansas, that five people in a random encounter are all wearing masks.
As Map 1 illustrates, this probability measure displays significant variation throughout the state. Interestingly, many counties that did not mandate masks had higher probabilities than some that did. For example, after ranking the counties by the probability that all five people in a random encounter would be wearing masks, Douglas County, Johnson County, Wyandotte County, and Shawnee County (all mandate counties) top the list, with probabilities ranging from 0.43 to 0.69. However, Jefferson, Wabaunsee, Pottawatomie, Riley, Osage, and Miami (all non-mandate counties) are ranked next, higher than many counties with mask mandates. Altogether, according to The New York Times data, six of the top 10 counties and 17 of the top 25 counties were non-mandate counites. (See Map 1.)
The New York Times data suggests that the split between mandate and non-mandate counties is far from clean. In fact, nearly two-thirds of the respondents in counties without mandates report either frequently or always wearing masks during early July. Moreover, according to the Times data, many counties without mandates experienced more mask use than others with mandates. This fact, however, is lost when the data is weighted across the Kansas population because heavily populated counties are highly influential in the computation of the associated weighted average. At the very least, the Times data suggest that many people wore masks even in the absence of government mandates to do so.
The CDC Study of Kansas Mask Mandates
The Centers for Disease Control and Prevention (CDC) released a November research paper that studies the efficacy of mask mandates in the state of Kansas.REF The CDC paper examines, at the county level, the number of new daily COVID-19 cases reported and the incidence (reported daily new cases per 100,000 people) from June through August.REF The report concludes that “[a]fter implementation of mask mandates in 24 Kansas counties, the increasing trend in COVID-19 incidence reversed.”REF
A closer examination shows that this conclusion is incorrect because the authors used data available from USAFacts.org that was later updated. In other words, the updated version of the data do not show that the COVID-19 incidence trend reversed in the counties with mask mandates.
The CDC is aware of this data issue, and they have acknowledged that the original study used data from an earlier release date.REF On January 1, 2021, the CDC issued an erratum to the Kansas mandate study that notes, “on p. 1777, the sixth footnote should have read ‘†† https://usafacts.org/visualizations/coronavirus-covid-19-spread-mapexternal icon. Accessed August 31, 2020.’”REF Originally, the footnote omitted the date that the CDC researchers downloaded the data from USAFacts.org. This oversight is critical because using the data updated after August 31 reverses a main conclusion of the CDC report.
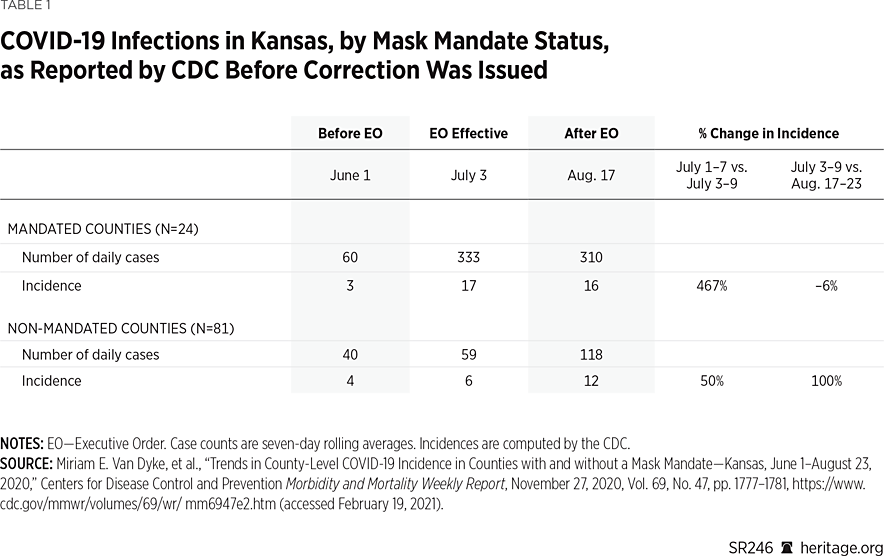
Using the data available prior to the update, as reported in the erratum, the CDC paper concludes that “the increasing trend in COVID-19 incidence reversed” in the Kansas counties with mask mandates.REF The CDC authors support this claim using both the raw number and incidence-of-reported cases. They provide the raw number of reported cases as the seven-day rolling average of daily cases, and the incidence as the seven-day rolling average of daily cases per 100,000 population. Table 1 reproduces the CDC paper’s result.
The first two columns on Table 1 provide case numbers and incidence for the first week of June and the first week of July (when the mandates went into effect) for both the 24 counties that left the mask mandate in place, as well as for those 81 counties that opted out of the mandate. The third column shows the same statistics for August 17 to 23, approximately 45 days after the mandates went into effect.
As the first row demonstrates, the CDC reports that cases and incidence in the counties with mandates increased from June to July, and then declined in August. The incidence increased more than fivefold from June to July (from 3 cases to 17), and then fell 6 percent in August (from 17 cases to 16). The bottom two rows provide the same statistics for the 81 non-mandated counties, and show that cases and incidence increased from June to July, and then increased at a faster rate in August (100 percent).REF Based on these results, the CDC reports that the mask mandates appear to have reversed the increasing case trend in the counties with mandates, while case incidence doubled in those counties without mandates.
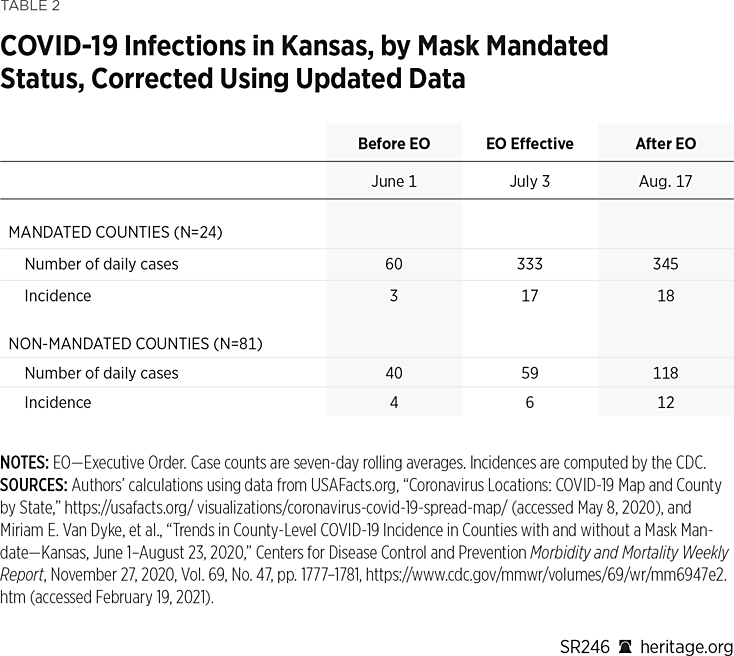
Table 2 replicates each of these calculations using the updated data rather than the earlier released data used in the CDC report (downloaded August 31, 2020).REF As these new results show, the updated case data do not change the original results for the non-mandated counties, but it does alter the results for the mandated counties. In particular, the trend no longer reverses in August: It continues to increase, although at a slower rate.
The top row shows that the number of cases in the mandated counties increased 35 percent from July to August (from 333 to 345), and that the incidence increased 6 percent (from 17 per 100,000 to 18 per 100,000). Thus, although the rate of increase appears to have slowed in the counties with mandates, the trend in case growth is still increasing. While it is true that the case (and incidence) growth is still higher as of early August in the non-mandate counties, an important empirical question is whether this result holds beyond early August. Without investigating this question, it is premature to claim that mask mandates were effective in Kansas.
Extension of Dates to Include Fall Surge
The CDC paper does not report any statistics beyond August. In a footnote on page 1777, the CDC report states:
August 23, 2020, was selected as the study end date because most Kansas counties had already started or were about to begin school the week of August 24, 2020. The implementation of in-person schooling would have signified an important change in events influencing COVID-19 incidence rates after the executive order.
Although school reopening is an important change in events, it does not prohibit investigating COVID-19 trends in Kansas after August. Moreover, the Kansas governor signed a separate executive order in July “mandating all students, teachers, faculty and visitors to public or private K–12 school buildings or facilities wear face coverings.”REF Although 28 counties either partially or fully opted out of this school mitigation order by October 15, only two of the 24 counties that implemented public mask mandates in July opted out of the school mitigation order, and these two counties (Scott and Sedgwick) instituted their own school mask mandates.REF
As in most areas of the U.S., some Kansas school districts chose to reopen schools while others chose to require remote classroom or hybrid instruction. For example, Johnson and Sedgwick Counties are Kansas’ two most heavily populated districts, with 21 percent and 18 percent of the state’s population, respectively. Both counties had had a mask mandate in place since July, but they implemented different school reopening plans.
In Sedgwick, as of October 30, all middle and high school students were still learning remotely, and the district planned to allow in-person instruction to begin on November 12.REF However, at its November 9 meeting, the board decided to keep remote learning in place “amid a surge of coronavirus cases in Wichita [the largest Sedgwick city] and across the state.”REF
In Johnson County, all students initially attended school in a hybrid environment, but students in grades pre-K through 5 shifted to onsite learning on October 8.REF On November 30, all secondary students (grades 6 through 12) shifted fully to remote learning “[i]n acknowledgement and response to the growing spread of COVID-19 infections in Johnson County.”REF When the school district announced this shift to remote learning, they also proclaimed that “[s]ocial distancing, mask-wearing, and hand washing, for example, have helped to keep transmission low inside the school buildings. However, the district is seeing an impact on staffing due to the sharp increase in cases within the community.”REF
Regardless of these complicating factors, if mask mandates are only effective when schools are closed, then they do not work. Thus, one very important empirical question is whether the COVID-19 trends observed in Kansas through August remained the same—or changed—after August. To investigate this question, this Heritage Special Report extends the CDC’s analysis through mid-November.REF
During this period, not all Kansas schools opened, but each of the 24 counties with public mask mandates also implemented mask mandates in their schools. Thus, the two-thirds of the population under a mandate prior to August remained under a mandate after schools were open, and that mandate was also implemented in the schools that opened. Also, 68 percent of the 81 counties without mandates maintained the state’s separate school-mitigation order, and at least some of the counties that opted out of the school mitigation order instituted their own mask requirements for schools that opened.REF In this regard, the public mandate/non-mandate distinction outside of the schools was unchanged for the bulk of the state’s counties after school began.REF
Table 3 presents the results that extend the analysis through November, before the whole state was under a public mask mandate.REF These results demonstrate that the mask-mandate counties reported higher rates of growth in both case totals and incidence during the fall surge, both in absolute terms and relative to the counties without mask mandates.REF For instance, after staying essentially flat in the middle of September,REF the number of daily cases in the counties with mandates increased 35 percent in late October (to 465 cases), and 260 percent in November (to 1,676 cases).
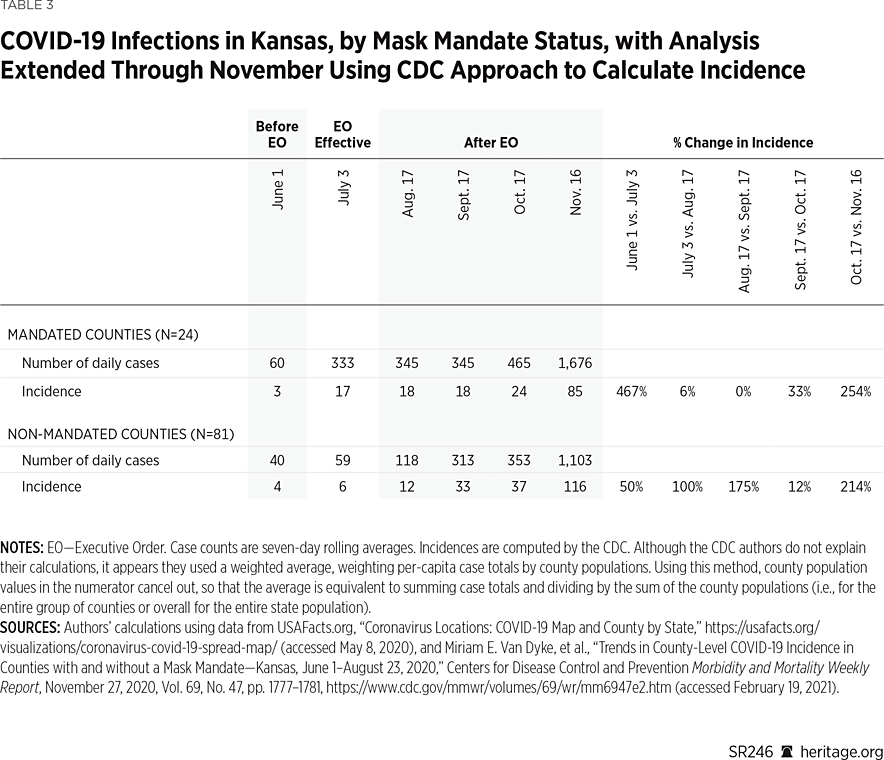
In contrast, after the counties without mask mandates reported a rise of 165 percent in September (to 313 cases), they reported an increase of just 13 percent in October (to 353 cases), followed by an increase of 214 percent in November (to 1,107 cases). Table 3 also demonstrates the same patterns for case incidence in both groups of counties.
In particular, using either the raw totals or incidence, case growth was higher in the counties with mask mandates in both October and November when compared to the counties without mandates. In the mandate counties, incidence increased 33 percent in late October (from 18 to 24), and 254 percent in November (from 24 to 85). In the non-mandate counties, incidence increased 12 percent in late October (from 33 to 37), and 214 percent in November (from 37 to 116).
These patterns are broadly consistent with the spread of COVID-19 in Kansas throughout the first nine months of the pandemic, both before and after the mandates were in place. Through November, case growth tended to rise and fall concurrently in both groups of counties. The CDC study does not adequately capture the overall pattern, however, because it only examines case totals and incidence (using seven-day rolling averages) through August. Of course, it is also important to examine case growth throughout the pandemic, both before and after the period studied in the CDC report, as well as outside the seven-day periods in the report.
The first reported COVID-19 case in Kansas was on March 8, 2020, in Johnson County, the state’s most heavily (and most densely) populated county. The case totals remained higher in the mandate counties until April 27, and the seven-day rolling average of new cases was higher in the mandated counties until April 13. The seven-day rolling average of new cases was then greater in the non-mandated counties through May 29 (for 47 consecutive days). However, from May 30 through November 30 (the endpoint of our analysis), the seven-day rolling average of new cases was greater in the counties with mask mandates.
Using the incidence figures, the values across mandate counties versus non-mandate counties are more evenly distributed. For instance, the incidence (seven-day rolling average of new cases per 100,000) was higher in the mandate counties through April 10, and then remained higher in the non-mandate counties until June 3. From June 4, incidence remained higher in the mandate counties until August 27, and then stayed higher in the non-mandate counties through November 30.
Additional Issues with the CDC Study
Several other aspects of the CDC study’s methodology deserve further examination. The first of these issues is the method used to calculate incidence. Typically, to adjust case totals for population differences, researchers convert raw values to the number of cases per 100,000 population. For a given geographic area, they calculate this measure by dividing the number of cases by the population, and then multiplying the result by 100,000. That is, the researchers calculate the number of cases as a percentage of the population, and then inflate it by 100,000 (to make it more comparable across areas with different population sizes).
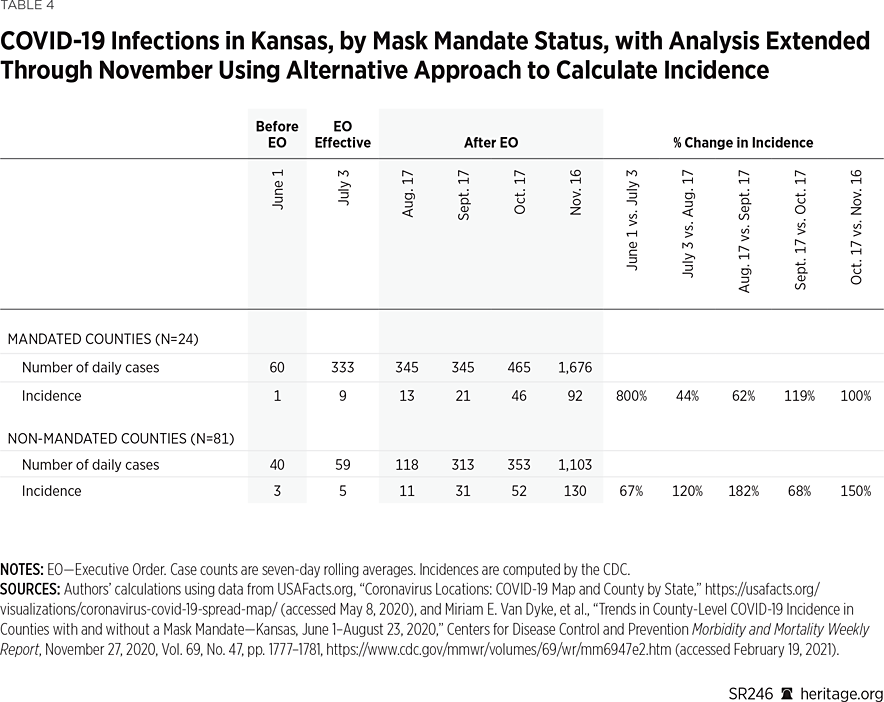
The CDC study does use this method to calculate incidence. However, instead of calculating each county’s incidence as the number of cases divided by the county’s population, the CDC authors report the county cases as a percentage of the state’s population. Although there is nothing technically wrong with that approach, it makes at least as much sense to calculate the incidence figures using each county’s population total.REF Table 4 reproduces the incidence figures used in Tables 2 and 3 using this alternative calculation.
These results demonstrate that the trend in incidence increases in both mandate and non-mandate counties from June through November. The percentage increase in the incidence is greater in some periods for the mandate counties, and greater in others for the non-mandated counties. However, the geometric mean for these rate increases is 147 percent in the mandate counties, and 113 percent in the non-mandate counties, indicating that the mask mandates did not reverse—or notably suppress—overall COVID-19 growth.REF
Another issue with the CDC study is that its authors only focus on certain weeks as points of comparison (as represented in Table 2). A more comprehensive comparison would examine the growth across the entire time horizon of the study. Charts 2 and 3 provide one such evaluation, plotting the daily values of the seven-day rolling averages of confirmed cases (per 100,000) across time. Chart 2 uses the CDC approach to calculate incidence, and Chart 3 uses the alternative approach as used in this report.
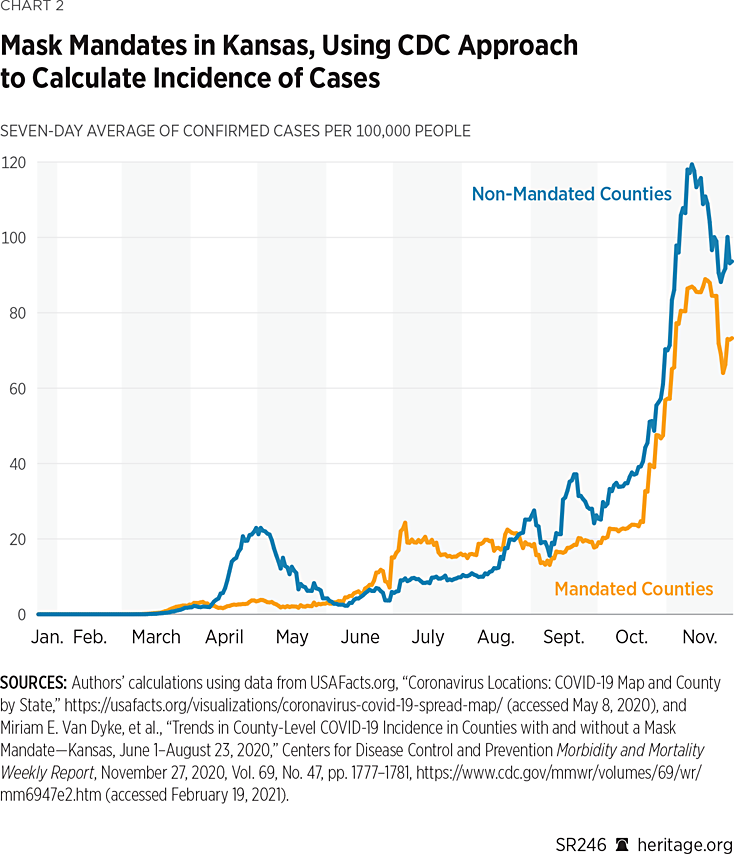
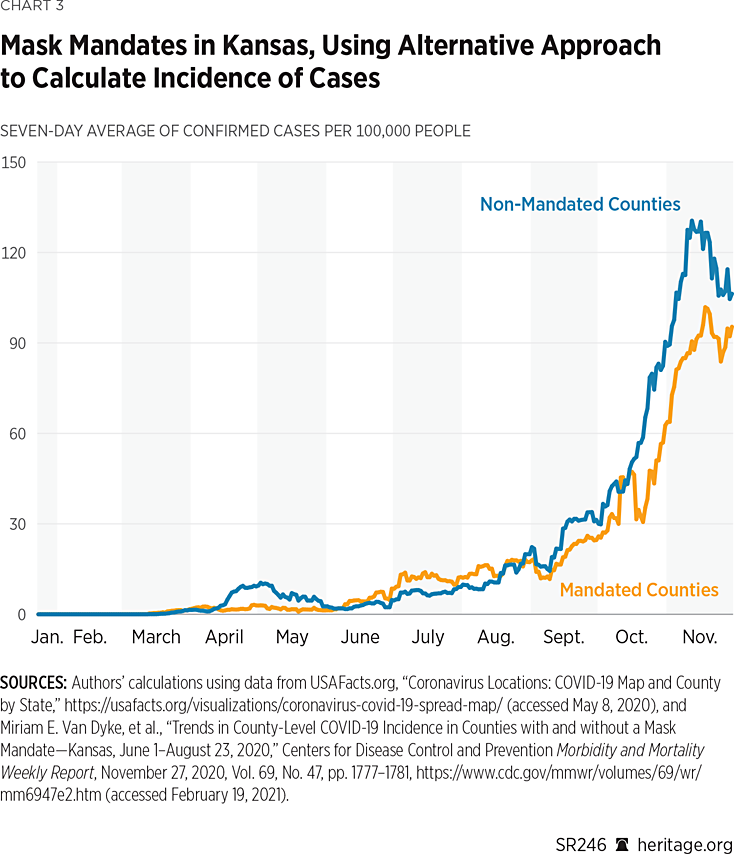
As both charts indicate, there was considerable fluctuation over the course of the year in the 24 counties that had mask mandates and the 81 that did not. Overall, though, the trends are very similar across both groups. However, since September, using both incidence measures, the non-mask-mandated counties did in general report higher per capita cases.REF Nevertheless, both groups of counties experienced a steady increase in per-capita case growth.
Another perspective from which to analyze growth over the full horizon is by computing average monthly growth rates. Charts 4 and 5 provide this view, with rates calculated as the geometric means of the seven-day rolling average of daily case growth for each month.REF
As Charts 4 and 5 illustrate, there has been significant variation in case growth in both counties that issued mask mandates and counties that did not. Interestingly, before the imposition of mask mandates on July 2, both groups of counties incurred overall reductions during May. The levels of these reductions differ depending on which approach is used, but the direction of the change is the same.
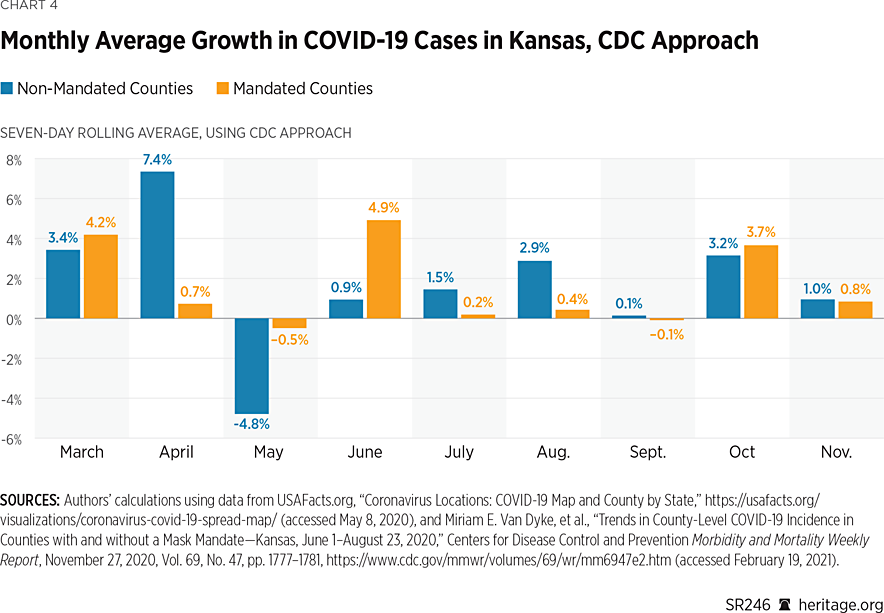
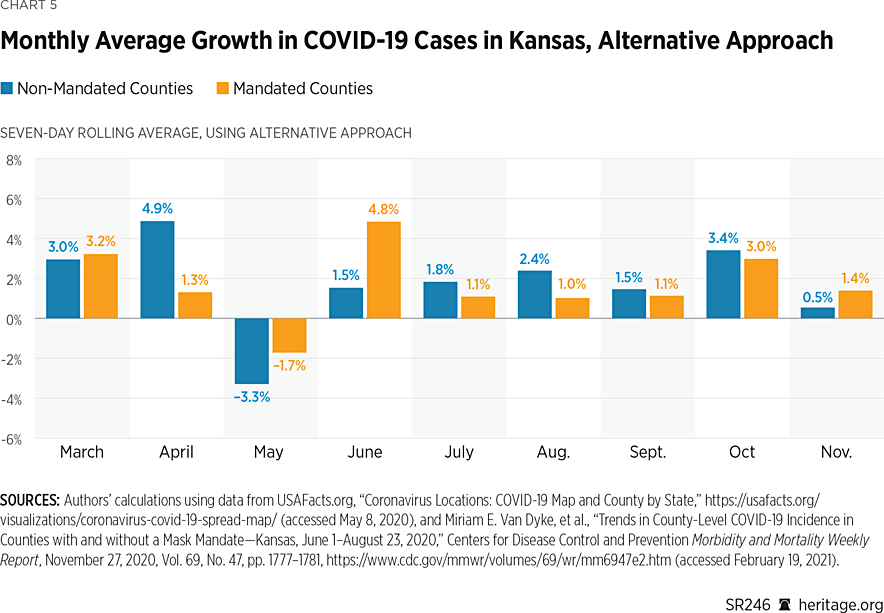
Subsequent months through September all suggest increases in monthly case growth, with counties not implementing mask mandates incurring slightly higher growth. However, during October and November, the different calculation methods for incidence provide conflicting results as to which group of counties experienced higher case growth. Still, using both metrics, the growth rates for the two groups of counties are quite similar. In a forthcoming section, we examine the difference between the two groups for statistical significance.
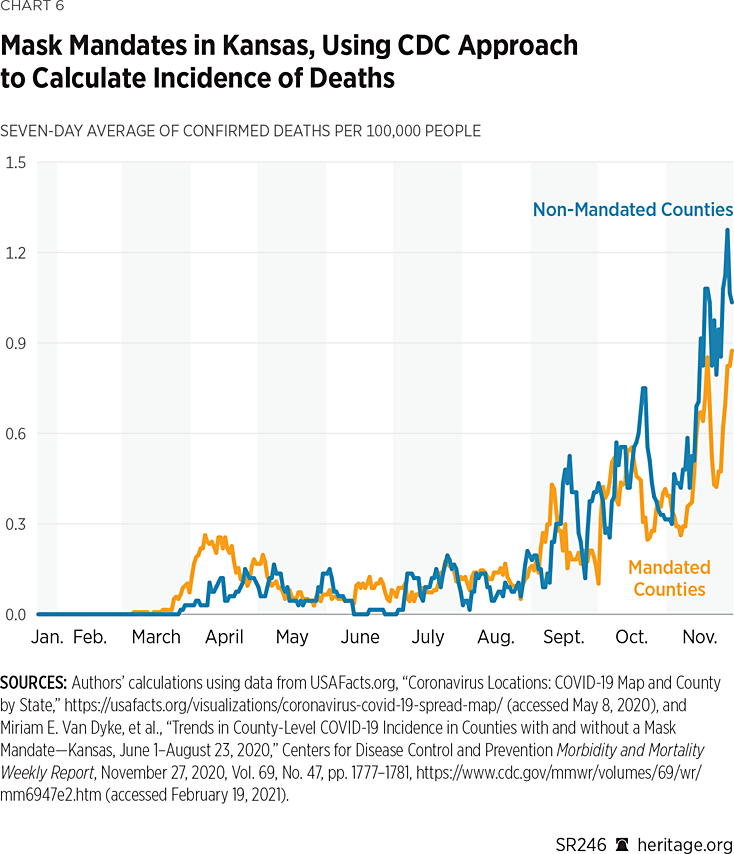
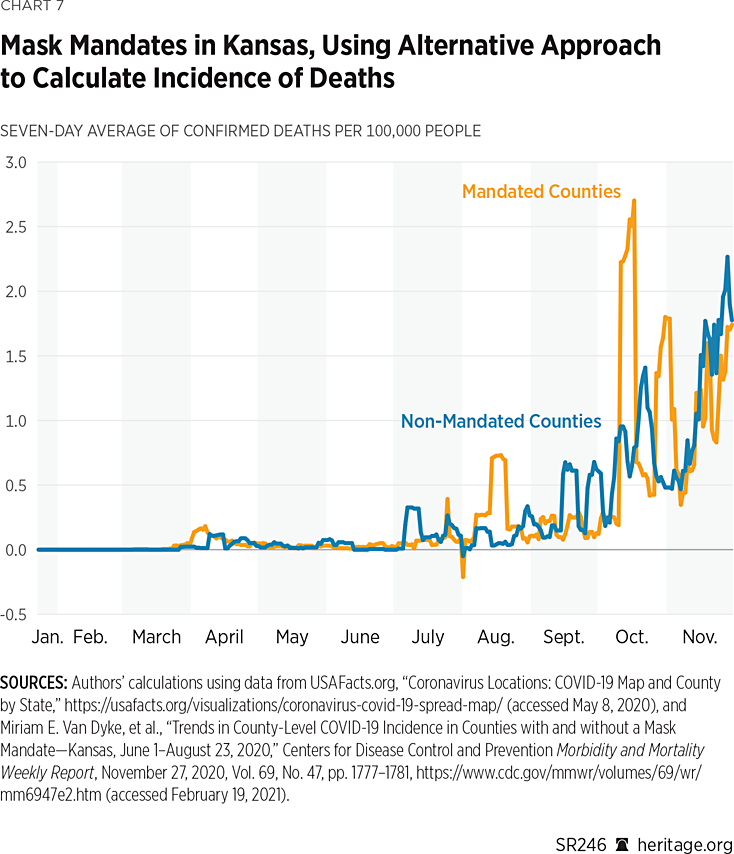
Mortality. Another important question—one the CDC study ignores—is an analysis of COVID-19 mortality data between counties that had mask mandates and those that did not. Charts 6 and 7 display the daily values for the seven-day rolling average in mortality, where incidence is calculated using the two approaches discussed in the previous section. As these charts illustrate, the counties that did not implement mandates seemed to fare slightly worse in terms of mortality than the counties that did. However, there was no clear sustained reduction in mortality in either group.
Additionally, Charts 8 and 9 present mortality statistics using the monthly growth rates for deaths.
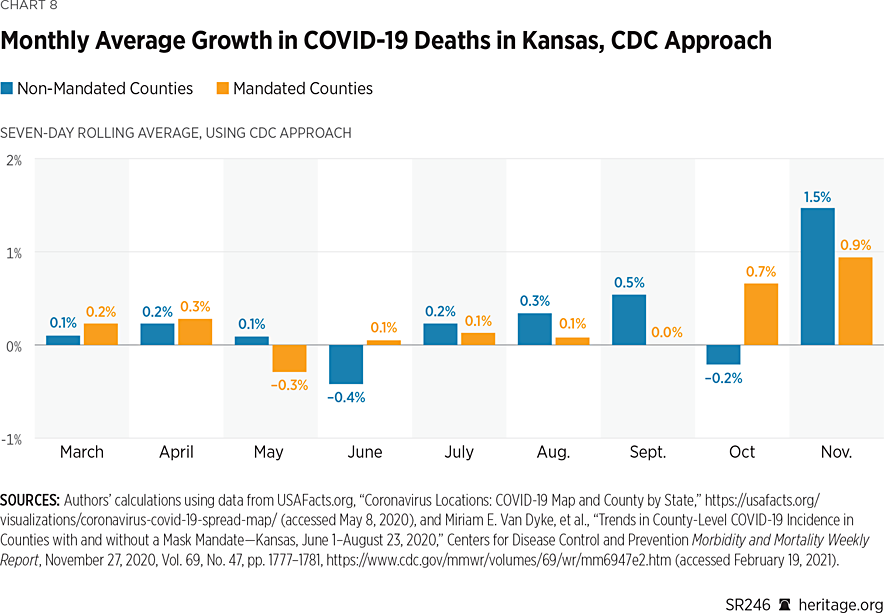
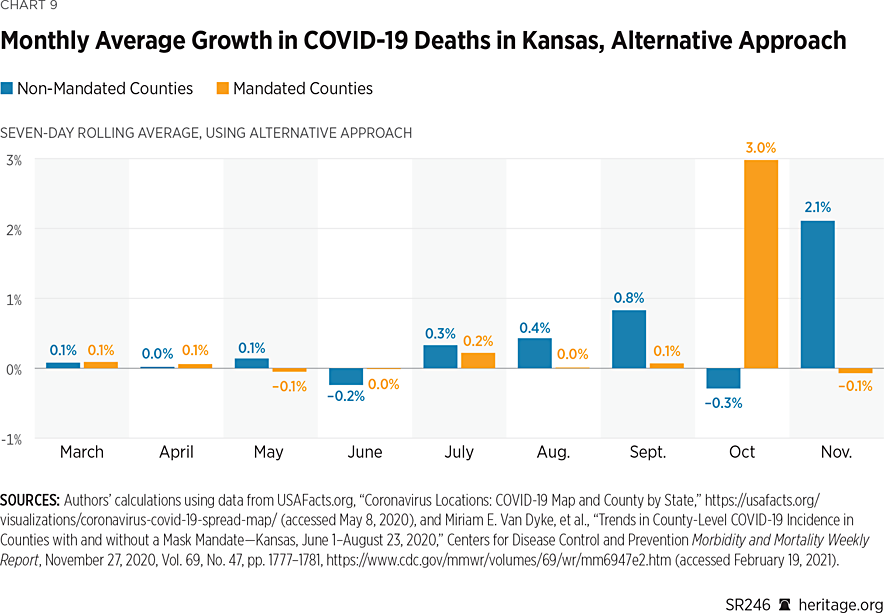
These charts demonstrate that, in both groups of counties, there has been significant variation in mortality growth rates pertaining to COVID-19 in Kansas. As was also the situation with case growth, both groups varied in terms of which had higher growth rates before the imposition of the mask mandates. After the imposition of mask mandates in July, however, in most months, counties that implemented mandates experienced slightly lower (albeit positive) growth rates for mortality than counties that did not.
Using the CDC method of calculating incidence, the sole exception is the month of October, while the alternative approach reveals that the sole exception is the month of November. Non-mandated counties experienced negative growth in October under both approaches, and mandated counties experienced negative growth in November under the alternative approach. Of course, these basic descriptive measures have limited use because they tell us little about the statistical significance of any differences that may exist. The next section of this report uses more sophisticated techniques to determine if differences across the two groups of counties are significant from a statistical perspective.
A Bayesian Statistical Model. A key question is whether disparities between counties that implemented mask mandates and counties that did not indeed differ statistically. We developed a series of regression models to evaluate this question. Initially, we took a rather simple approach by developing a standard frequentist model to compare growth rates. In particular, we computed incidence figures (per 100,000) arithmetically averaged across counties with mandates and those without. Using this calculation, we then computed daily growth rates for both groups, which we used as the dependent variable for our analysis.
The model elicited no statistical difference on a monthly basis between the counties that implemented mask mandates (after their imposition in July) and those that did not. Additionally, the frequentist linear model suffered from a poor model fit with a coefficient of determination less than 0.01, suggesting that there was a significant amount of unexplained variability in the data.REF
Altogether, the poor results of the frequentist model suggest that additional factors may explain the variability in daily growth rates across mandated and non-mandated counties. Since it is plausible that different counties would incur different levels of COVID-19 proliferation (therefore eliciting different behavioral responses), we utilized a hierarchical Bayesian statistical model to account for such county-level heterogeneity. Our results are presented in Table 5, and full details of our model are contained in Appendix 2.

Our posterior distribution elicits a high R-squared value signifying that our model fits quite well. Overall, our posterior analysis suggests that the most notable effects in terms of case growth occurred before the imposition of mask mandates, with notable effects in May and June. Specifically, both groups experienced a reduction in May (also prevalent in Charts 4 and 5) with marginal posterior means of –0.039 and –0.037, respectively, with probabilities exceeding zero each less than 0.05.
However, after the imposition of July’s mandate, there is no clear monthly effect of case proliferation in either group. Overall, these results suggest that, at least statistically, the mask mandates in Kansas did not have a significant effect on monthly case growth. However, the posterior intercept coefficient is positive, with probability exceeding zero above 0.993, suggesting that there are likely other factors influencing case growth that remain unexamined in this model.
Separately, we computed the difference between the monthly marginal posterior coefficients for counties implementing the mandate and counties that did not. These results are contained in Table 6.
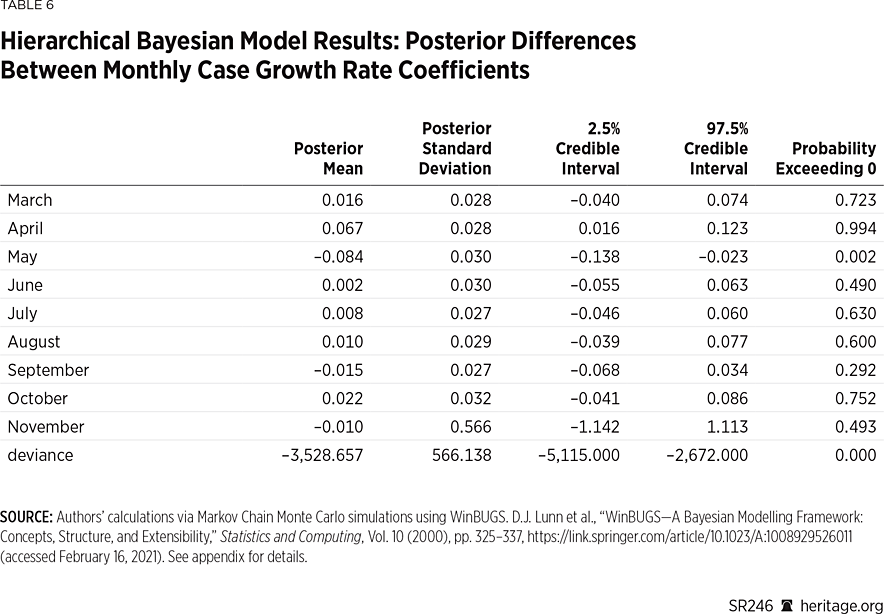
Once again, our analysis illustrates that there were slight disparities between the two groups of counties, but only before the mandates were implemented in April and May. After the implementation of the mandates, statistically speaking, there was no clear distinction between the two groups.
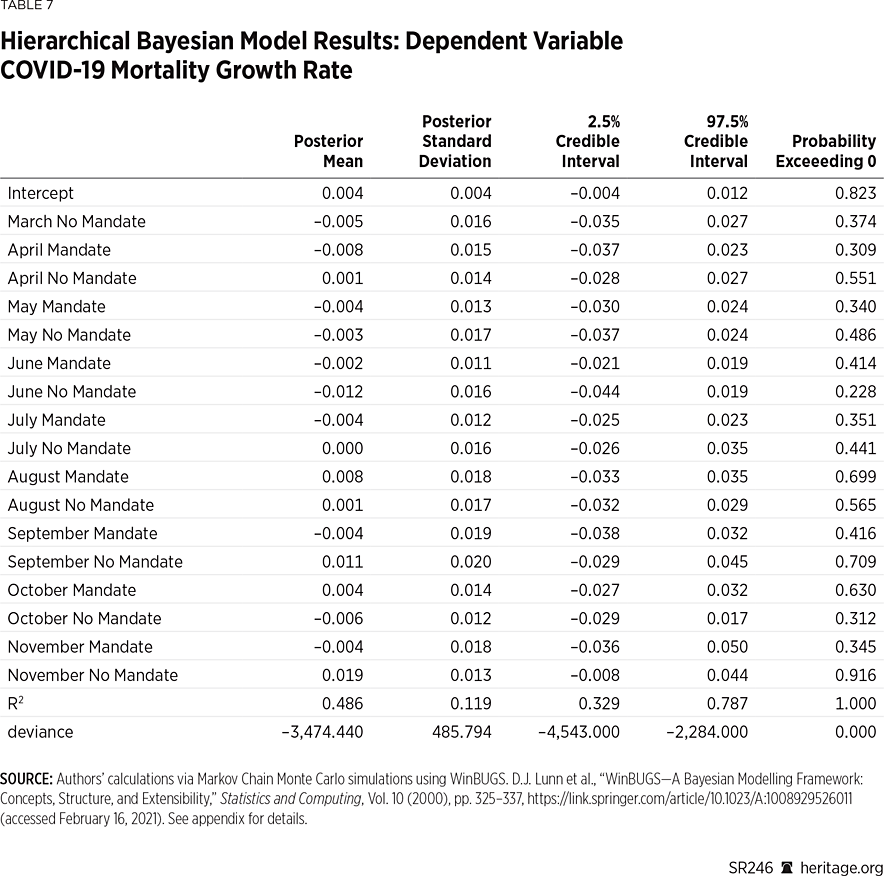
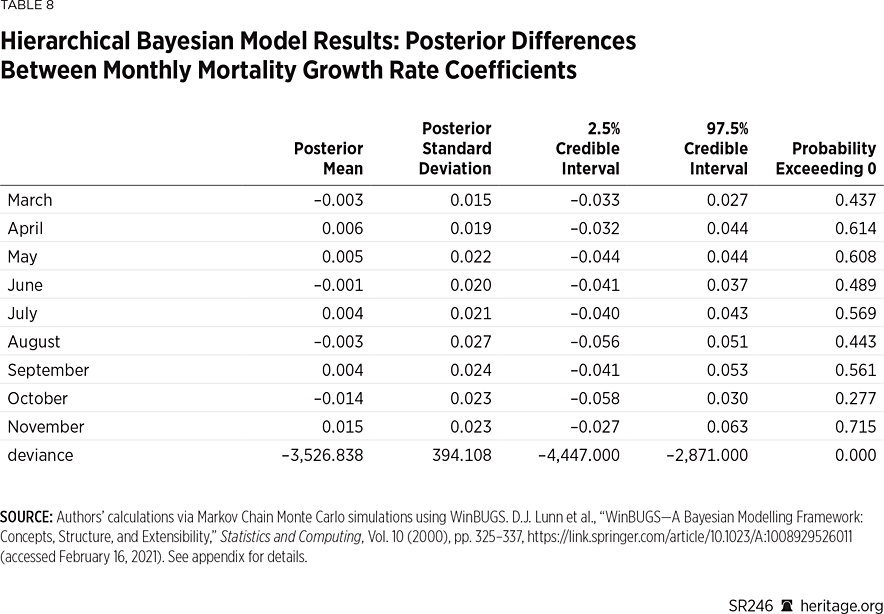
Lastly, Tables 7 and 8 present a similar analysis using mortality data. Unlike the case growth model, this model does not fit quite as well in terms of the estimated coefficient of determination, although it does still fit significantly better than its analogous frequentist counterpart. Also, unlike the case growth analysis, the mortality growth examination illustrates neither any monthly effect on mortality nor any meaningful statistical differences between the mandated and non-mandated counties on a monthly basis—before or after the imposition of the mandated order. Thus, these results suggest that although the counties in Kansas with mask mandates did report slower growth in mortality (and fewer deaths per 100,000), this impact was not significant from a statistical perspective.REF
Discussion and Limitations
Initially after the mandate, on a per-capita basis, counties with mask mandates had more cases (based on seven-day rolling daily averages) than those without mandates. However, in the fall, non-mandated counties reported higher case incidence. In terms of mortality, levels fluctuated in both groups of counties, with non-mandated counties having more daily deaths (again based on seven-day averages) on a per capita basis in the fall. When monthly growth rates pertaining to case proliferation and mortality are compared for the full period (June through November), however, there is no statistical significance between the two groups of counties.
One potential reason for the lack of significance could be due to insufficient compliance as suggested by statistics presented earlier in this report. However, as these data spanned only July 2 through July 14 and other local data on mask compliance is scant, controlling for compliance with the mandate is not feasible, though a worthy topic for future research.
Additional limitations of this study include the fact that there are likely other factors influencing COVID-19 proliferation and mortality that are unaccounted for in our modeling, including mask requirements by private entities, adherence to social distancing recommendations, prevalence of other precautions, and mobility.REF There are also many other ways that one can examine case and mortality growth, which may also come with their own limitations but are definitely worthy questions of future research. Last, of course, our analysis is confined to the state of Kansas, and it would be useful to examine similar questions for other states as well.
Regardless, after the imposition of the mandate, trends in case proliferation continued to increase in both groups of Kansas counties. The CDC report on the Kansas mask mandates fails to analyze the data with a sufficient level of rigor—and mistakenly argues that the trend in case growth reversed. The authors hope that the analysis presented in this report gives the public, as well as government agencies such as the CDC, tools and ideas for improving statistical analysis of public health data going forward.
Subject to the limitations listed in this section, our findings suggest that public health strategies relying predominantly on mask mandates are inadequate,REF and thus other initiatives in addition to mask wearing, a practice in line with The Heritage Foundation’s Coronavirus Commission guidelines, should have been a component of policies aimed to limit the spread of the disease.
Conclusion
Rigorous statistical analysis is fundamentally important in assessing public policy. Our analysis indicates that, after the imposition of an optional mandate, trends in COVID-19 proliferation continued to increase in Kansas counties with and without mandates. The CDC report on the Kansas mask mandates fails to analyze the data with a sufficient level of rigor and mistakenly argues that the trend in case growth reversed. The authors hope that this report gives the public, as well as government agencies such as the CDC, tools and ideas for improving future analyses of public health data.
Appendix 1: A Note on Population-Adjusted Case Values
Throughout the COVID-19 pandemic, various agencies and news outlets have relied on both raw numbers of reported cases as well as population-adjusted figures. Typically, population-adjusted figures allow better comparisons across countries, states, or counties with different population sizes. Sometimes, the raw values and the adjusted figures can produce a very different ranking between counties, for example, leaving readers to wonder which version of these COVID-19 figures they should rely on. Unfortunately, both versions are important, and neither is necessarily the “right” one to use. In other words, both measures can provide valuable information depending on the context in which they are used.
One of the most common population-adjusted figures is the number of cases per 100,000 population. For a given geographic area, this measure is calculated by dividing the number of cases by the population, and then multiplying the result by 100,000. That is, it takes the number of cases as a percentage of the population, and then inflates it by 100,000. To explore what kind of information these figures provide, this appendix presents statistics from two Kansas counties with very different population sizes: Meade County, with an estimated population of 4,033, and Johnson County, with an estimated population of 602,401.
As of June 5, Johnson and Meade Counties reported a total of 939 and 30 COVID-19 cases, respectively. Since Johnson has a much larger population, it is not overly surprising that officials are reporting a higher number of cases. One way to make a better comparison is to calculate what percentage of the respective populations reported having COVID-19. Using this method, 0.16 percent of Johnson County’s population reported having COVID-19, whereas 0.74 percent of the population reported having COVID-19 in Meade County.
Since it can be difficult to attribute practical meaning to figures so small, people commonly adjust these relative figures by multiplying them by 100,000. Using this method, Johnson and Meade Counties report having 156 and 744 cases of COVID-19 per 100,000 people, respectively. Mathematically, these transformations multiply 0.16 times 100,000 (for Johnson) and 0.74 times 100,000 (for Meade), therefore they suggest that for every 100,000 people, Johnson has 156 COVID-19 cases, whereas Meade has 744.
This interpretation, while mathematically accurate, somewhat misleadingly suggests that the COVID-19 problem is much worse in Meade than it is in Johnson even though less than one percent of the population reported having COVID-19 in both counties. Yet Meade County has a population of only 4,000 people, with a population density of 4 people per square mile. Given that Johnson has more than 600,000 people with a density of 1,262 people per square mile, it stands to reason that COVID-19 is more likely (all other factors constant)REF to spread more rapidly and cause more people to get sick there versus in a county with Meade’s population characteristics.
A closer look at the numbers in these two counties as the pandemic continued helps further demonstrate the shortcomings of this adjustment. As of November 22, Meade County reported 281 cases for a rate of 6,968 per 100,000. Of course, only 4,000 people live in Meade. Therefore, this adjustment only reveals that 6.97 percent of the population has reported a case of COVID-19 in Meade. Johnson County, on the other hand, reported 23,981 cases as of November 22, for a rate of 3,966 per 100,000 (3.97 percent). Similarly, as of February 22, 2021, Meade reported 486 cases for a rate of 12,051 per 100,000 (12.05 percent of the population), whereas Johnson reported 53,652 cases for a rate of 8,906 per 100,000 (8.91 percent of the population).
Unsurprisingly, Johnson County’s case total grew more rapidly over the full period (57 times higher in February versus June) than Meade’s (16 times higher in February versus June). It is also true that Johnson County’s case total still represents a smaller share of its population than Meade’s case total does for that county. However, unless the disease spreads much more rapidly in Johnson, it should take longer to infect the same share of the population in Johnson versus Meade: There are literally 150 times the number of people living in Johnson County than in Meade County.
Thus, focusing only on the population-adjusted total or only on the raw total leaves out valuable information about the spread of COVID-19. The population-adjusted total tells us very little, if anything, about the probability of catching the disease. Outbreaks might look worse in smaller communities when using population-adjusted totals, but there nonetheless might be less opportunity to cause community spread relative to more populated areas (or locations with more human interaction).
z
Appendix 2: Hierarchical Bayesian Model
In our model, we specified for month i=1,…I, day t=1,...,ti, and j=1 to represent the set of counties that implemented the mask mandate, and 2 for the set that did not. We defined the log daily growth rate in incidence log(yijt)~N(μijt,σijt2), with the following linear predictor:
$$μ_{ijt}=α_{ijt}+β_{ijt}$$
and the following prior structure:
$$α_{ijt}∼N(μ_α,σ_α^2)$$
$$β_{ijt}∼N(μ_{βij},σ_{βij}^2)$$
$$μ_{βij}∼N(∆_j,σ_{∆j}^2)$$
$$μ_α∼N(0,100)$$
$$∆_j∼N(0,100)$$
$$σ_{βij}^{-2}∼Γ(a_j,b_j)$$
$$σ_{∆j}^{-2}∼Γ(1,1)$$
$$σ_{ijt}^{-2}∼Γ(c,d)$$
$$σ_α^{-2}∼Γ(1,1)$$
$$a_j∼Γ(10,1)$$
$$b_j∼Γ(1,1)$$
$$c∼Γ(1,1)$$
$$d∼Γ(1,1)$$
Lower dimensional parameters μβij provide a representation of the monthly change in mandated and non-mandated counties, providing a point of comparison to evaluate the difference between mandated and non-mandated counties in terms of growth rates. We treated counties during the month of March that ultimately instituted mask mandates as our benchmark variable to ensure statistical identifiability. We estimated our models in WinBUGS over 30,000–120,000 Markov Chain Monte Carlo iterations, using the initial 10 percent of these iterations for burn in. Posterior inferences regarding μβij shed light on the monthly change in growth rates, and thus we focus our inference on those.REF We computed Bayesian coefficients of determination using the approach outlined in Gelman et al. (2019).REF We assessed for convergence of our posterior distribution using the approach outlined in Geweke (1992).REF Comparing the first 40 percent of our posterior sample to the remaining 60 percent failed to elicit a lack of statistical significance for all coefficients examined, thus suggesting that the posterior distribution had been adequately sampled and was therefore accurately characterized by our sample.REF
Kevin Dayaratna, PhD, is Principal Statistician, Data Scientist, and Research Fellow in the Center for Data Analysis, of the Institute for Economic Freedom and Opportunity, at the Heritage Foundation. Norbert J. Michel, PhD, is Director of the Center for Data Analysis, of the Institute for Economic Freedom, at The Heritage Foundation.