Introduction
Under the Biden Administration, the Environmental Protection Agency (EPA) revived the social cost of carbon (SCC), which quantifies the economic effects from the release of carbon-dioxide (CO2) emissions. Specifically, the Administration adopted three Integrated Assessment Models (IAMs)—the Data-driven Spatial Climate Impact Model (DSCIM), the Greenhouse Gas Impact Value Estimator (GIVE), and the Howard and Sterner meta-analysis models—to calculate the SCC.REF Policymakers often rely on SCC estimates from these models to justify imposing strict regulations on a wide variety of everyday products, ranging from vehicles and household lamps to pool pump motors.REF Given the SCC’s role in regulatory policymaking, the robustness of these models to key assumptions should be critically evaluated.
Prior Heritage Foundation research has found that reasonable changes to many such assumptions led to significant reductions in SCC estimates, suggesting that the Biden Administration selectively applied unrealistic assumptions to inflate SCC values and justify aggressive environmental regulations. Based on these findings, the authors conclude that SCC estimates and their underlying models are unreliable and subject to manipulation and, therefore, should not be used to guide regulatory policy.
A Brief Overview of Integrated Assessment Models and the Social Cost of Carbon
IAMs estimate the SCC by modeling interactions among the economy, society, and the environment. Central to these models are “damage functions,” which translate temperature increases into projected economic losses to support cost-benefit analyses. Monte Carlo simulations incorporate uncertainty in this analysis by repeatedly running a model with randomly chosen inputs to produce a range of possible outcomes. This process generates probability distributions of SCC estimates, which are often characterized by standard point and interval estimators. Although heavily influential in public policy, IAMs are highly sensitive to assumptions and subject to significant uncertainty, raising concerns about their robustness and reliability.REF
The SCC played a central role in the Obama Administration’s climate agenda. To develop SCC estimates, the Administration formed the Interagency Working Group on Social Cost of Greenhouse Gases (IWG), which included agencies such as the Department of Energy and the EPA. Using three IAMs, the IWG estimated SCC values ranging from $26 to $95 per metric ton of CO2 emissions in 2050.REF
The first Trump Administration disbanded the IWG and shifted the SCC focus from global impacts to domestic climate effects. The Biden Administration later reinstated the SCC framework, introducing three new models, including DSCIM, to project economic damages from climate change.REF On January 20, 2025, President Trump issued “Unleashing American Energy,” an executive order disbanding the IWG. The order criticized the lack of robustness in SCC estimates and directed the EPA Administrator to address its deficiencies, including the potential for SCC elimination.REF
Overview of the DSCIM Model
Developed by the University of Chicago’s Climate Impact Lab, DSCIM estimates the SCC by assessing damages from CO2 emissions across five key categories: health, energy, labor productivity, agriculture, and coastal regions.REF The model consists of four components: socioeconomic and greenhouse gas emissions projections, climate system modeling, damage functions, and discounting.REF
Given the inherent uncertainty in variables such as equilibrium climate sensitivity, population growth, gross domestic product (GDP) projections, and agricultural assumptions, the model employs Monte Carlo simulations over 10,000 iterations to capture a range of possible outcomes. The associated probability distribution is summarized via the arithmetic average across these simulations.
As with any model, the DSCIM relies on a set of underlying assumptions. This Backgrounder discusses a subset of these assumptions to assess the model’s sensitivity to modest changes in their specifications—namely, the specification of discount rate, time horizon, and climate sensitivity.REF
Discount Rates. The SCC depends on the concept of discounting, which is intended to account for the time value of money and ensure that future climate benefits and costs are appropriately valued in present terms. Though identifying the optimal discount rate remains uncertain, selecting an appropriate rate is essential to engage in proper cost-benefit analysis.
Following the logic of greenhouse gas policy, cutting CO2 emissions is an investment in environmental capital. The theory is that cutting CO2 emissions today improves the environment and its flow of services in the future. There are unlimited choices for investment—in environmental capital, human capital, or physical capital—that could provide for improved flow of services in the future, but the resources for making those investments are limited. Therefore, the limited resources should be allocated to those investments that provide the greatest improvement.
Investments in environmental capital, such as reducing CO2 emissions, should be pursued only if they yield a rate of return at least comparable to the best available alternative investments. Discounting—the process of calculating the present value of future benefits—provides the framework for making this comparison. By reversing the process of compounding, discounting enables a consistent evaluation of the future benefits of CO2 reduction relative to other investment opportunities.
Selecting an appropriate discount rate is essential for making efficient investment decisions. Using too low a discount rate risks harming future generations by diverting resources away from alternative investments that could deliver greater overall benefits.
Though it is impossible to know what would be the highest return that could be reasonably generated by alternative investment, the real rate of return on the New York Stock Exchange has been 7 percent over the past two centuries. That this is a very broad sampling across both investment areas and time spans argues strongly for its use.REF Some may lean toward a 3 percent discount rate, which is closer to the rate of return of the bond market.REF
From 2003 to 2023, the White House Office of Management and Budget (OMB) directed agencies to apply both 3 percent and 7 percent discount rates in cost-benefit analyses, with flexibility to consider additional rates as appropriate.REF In 2023, the Biden Administration revised this policy, establishing a central discount rate of 2 percent and encouraging declining discount rates to account for long-term uncertainty, particularly in the context of climate impacts.REF To support this shift, the OMB incorporated a discounting methodology known as Ramsey discounting as the preferred method for modeling uncertainty over extended time frames.REF The Biden Administration’s EPA estimated the SCC under 1.5 percent, 2 percent, and 2.5 percent Ramsey discount rates. The mean and median SCC under these rates are presented in Tables 1 and 2.
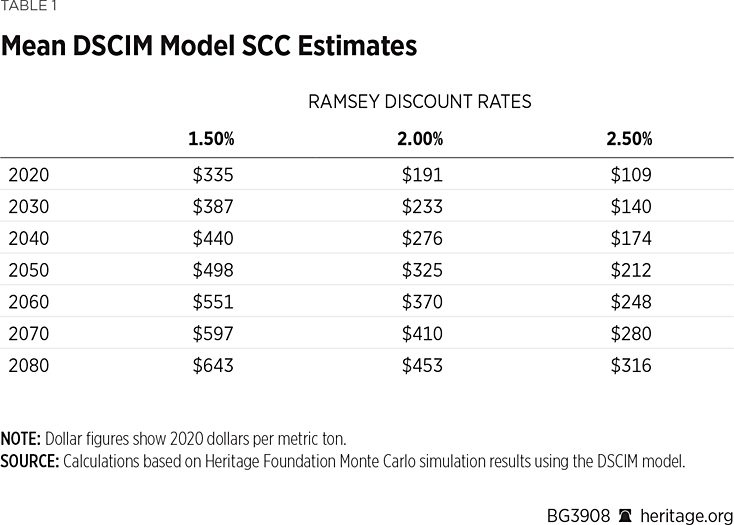
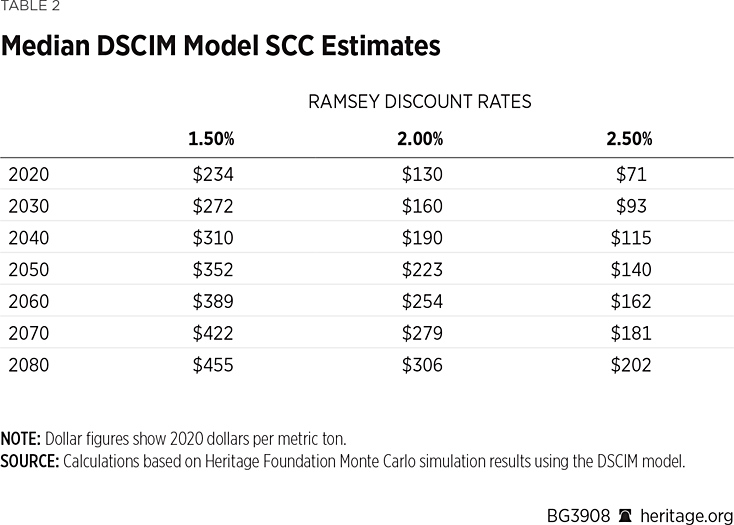
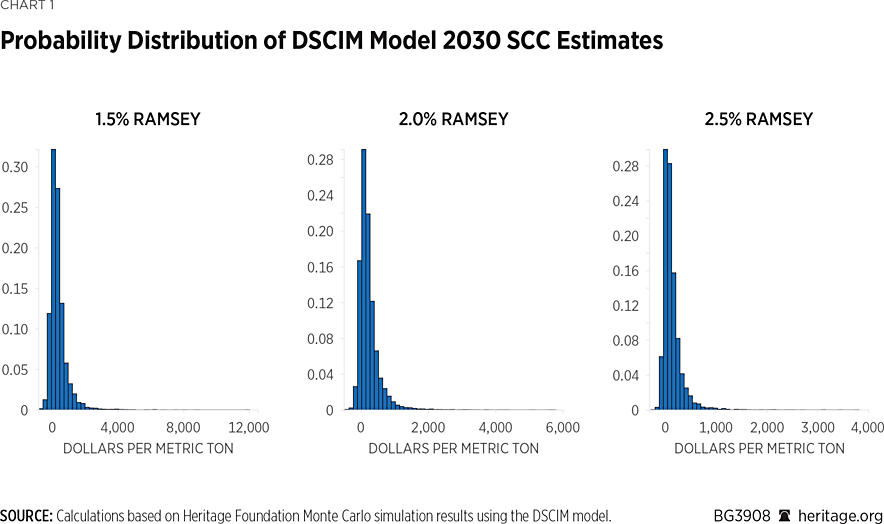
Chart 1 provides an overall visual representation of the SCC in 2030.As Chart 1 shows, for 2030, the mean estimates of the SCC are $387, $233, and $140, with standard deviations of $553, $329, and $201 under 1.5 percent, 2 percent, and 2.5 percent discount rates, respectively. The 95th percentiles vary significantly, estimated for these discount rates at $1,276, $763, and $460, respectively. These findings, derived solely from the EPA’s own assumptions, underscore the significant variability inherent in SCC estimates.
As prior research published at Heritage as well as in the peer-reviewed literature has shown, the SCC can drop drastically as a result of altering the discount rate.REF It would therefore be useful to similarly alter discount rates in DSCIM and assess associated changes in the SCC. Discount rates in DSCIM, however, are tied to specific damage function coefficients. For example, estimating the SCC under a 1.5 percent Ramsey discounting involves a specific set of damage function coefficients, as do 2 percent and 2.5 percent rates.
In an effort to use DSCIM to estimate the SCC under alternative discount rates, we contacted the EPA to request the relevant codes to re-estimate the damage function coefficients. The EPA declined to provide the model codes, instead referring us to an external research group that had conducted the estimates using a high-performance computing environment. While it may be possible to obtain the codes from this group and replicate the set-up, the technical barriers and lack of direct federal access create a de facto transparency problem. These obstacles prevent meaningful independent analysis of alternative discounting assumptions and undermine the reproducibility of the SCC estimates.
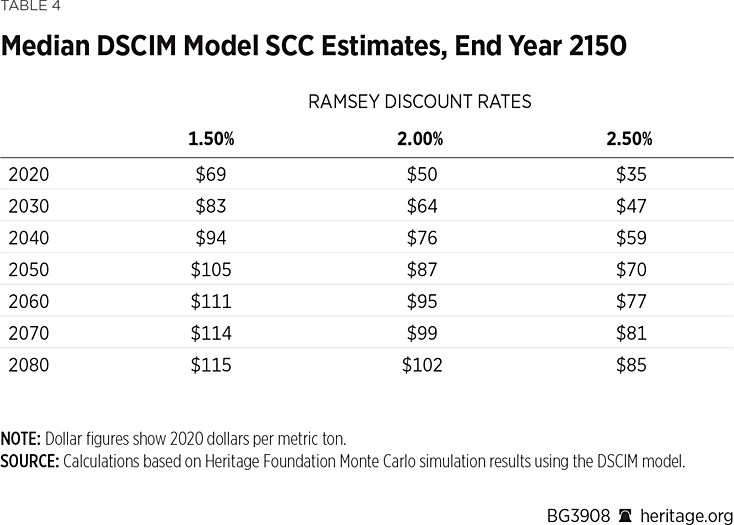
Time Horizon. The SCC estimates rely on projected aggregate damages extending nearly 300 years into the future. However, making long-term forecasts of key variables such as GDP growth, greenhouse gas emissions, and technological progress centuries ahead are fraught with uncertainty. As a result, we re-estimated the model over a less unrealistic period of nearly 150 years, with results shown in Tables 3 and 4.
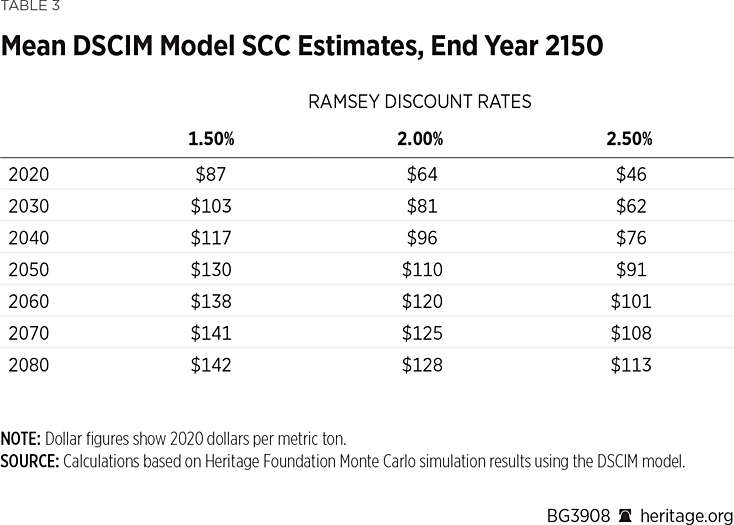
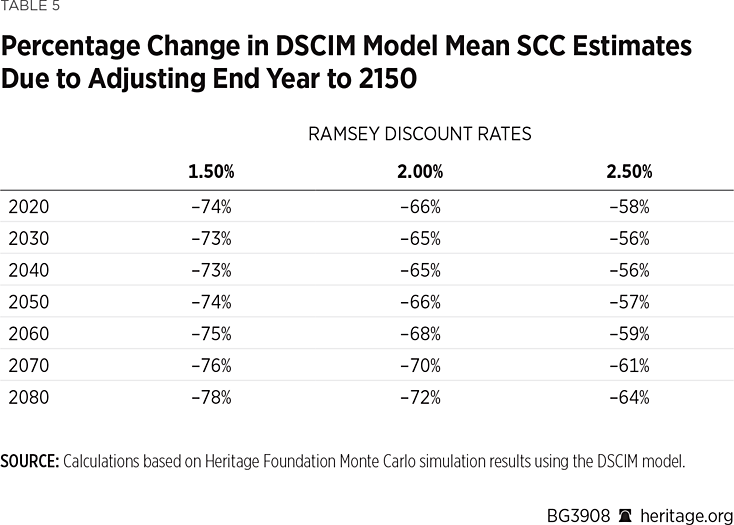
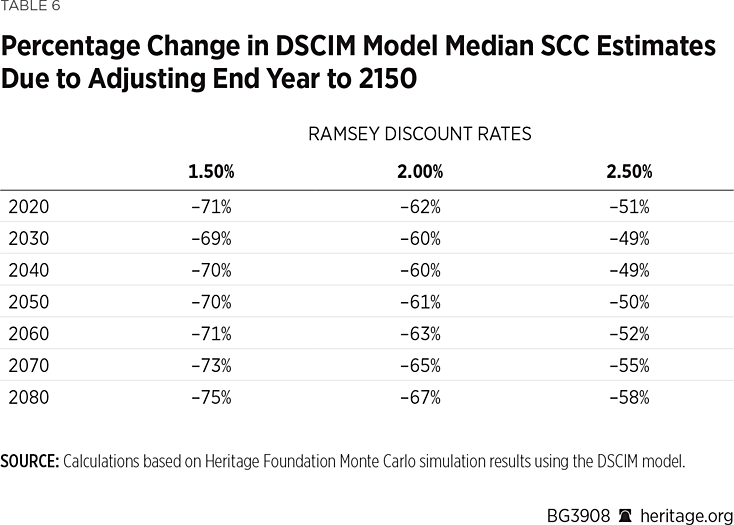
As Tables 5 and 6 show, as a result of altering the time horizon, the mean and median estimates are substantially reduced by 40 percent to nearly 80 percent. The largest SCC reductions occur at a 1.50 percent discount rate (69 percent to 78 percent) and in 2080 (58 percent to 78 percent). Chart 2 depicts the probabilistic distribution of the SCC for 2030 under this shortened time period.
As Chart 2 shows, under 1.5 percent, 2.0 percent, and 2.5 percent discount rates, the mean SCC estimates are $103, $81, and $62, with standard deviations of $112, $87, and $67, with 95th percentiles of $305, $240, and $185, respectively. As a result, beyond just the point estimators presented in Tables 3 and 4, the SCC is drastically lower under this 150-year time horizon.
Equilibrium Climate Sensitivity. Another assumption on which the SCC estimates depend is the specification of an equilibrium climate sensitivity (ECS) distribution, which quantifies the earth’s temperature response from a doubling of atmospheric CO2 emissions. As a key determinant of global temperature projections, this concept heavily shapes the SCC. While there is a scientific consensus that rising CO2 emissions contribute to global warming, the magnitude of this effect remains uncertain.REF Given this uncertainty, ECS is not represented by a single fixed value but rather as a probability distribution involving a spectrum of possible values.
The EPA adopts a mean ECS of 3.18°C (median 2.95°C), which falls within the Intergovernmental Panel on Climate Change (IPCC) Sixth Assessment Report estimated range of 2.0°C and 5.0°C.REF However, empirical evidence indicates that IPCC climate models consistently overpredict global warming, with observed temperatures falling below projections. These discrepancies imply that more realistic estimates of ECS likely fall toward the lower end of the IPCC’s range.REF One distribution was published by John Christy and Richard McNider in 2017, and another was published by Nic Lewis in 2022 in separate peer-reviewed journals.REF Tables 7–14 present SCC estimates under these two different distributions along with associated percentage changes.
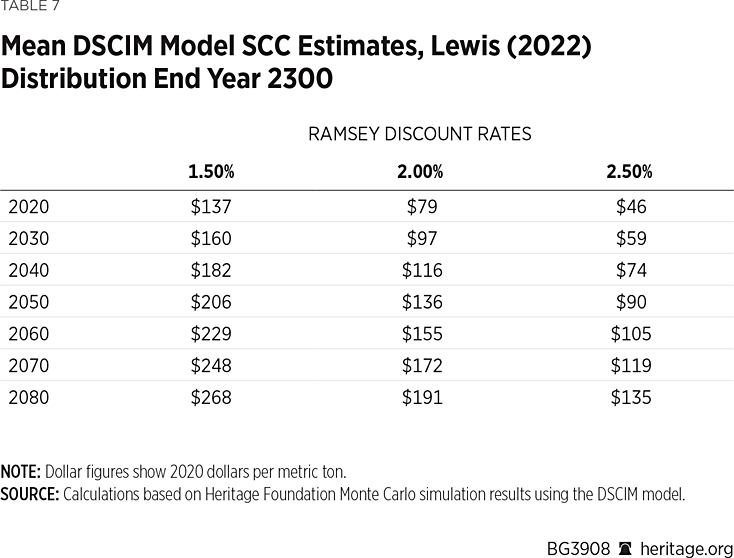
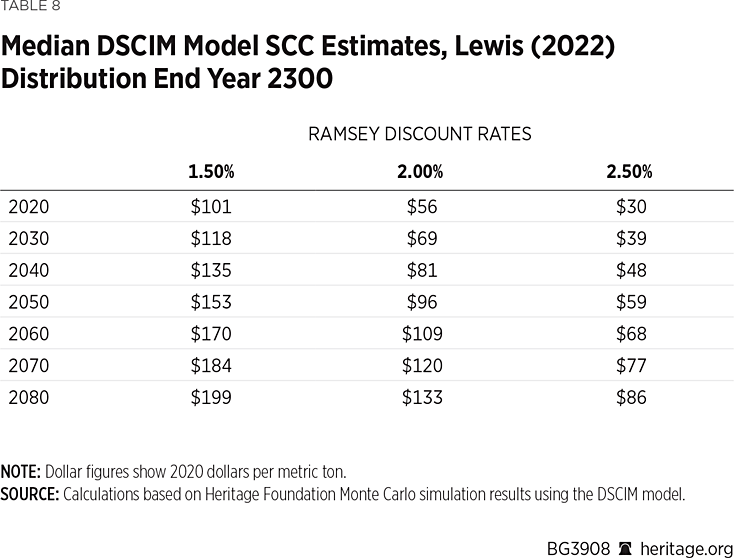
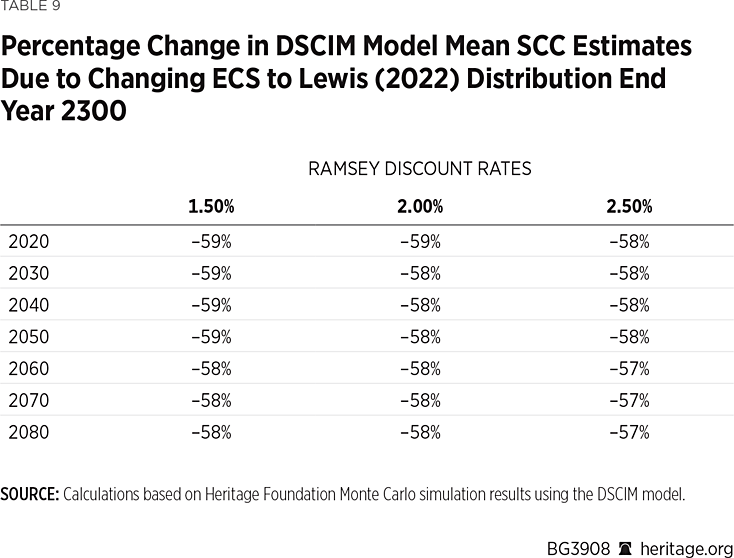
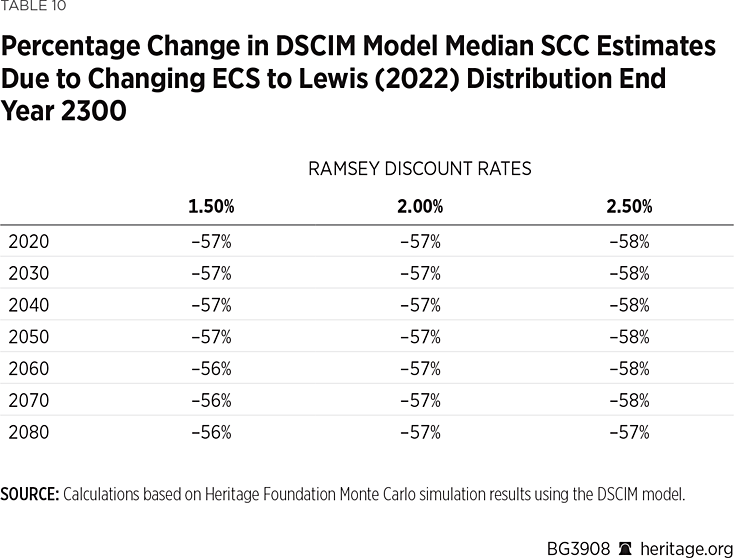
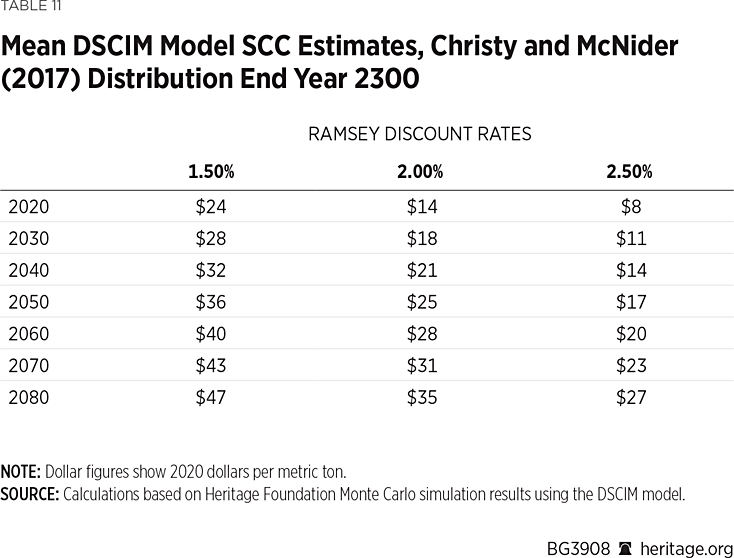
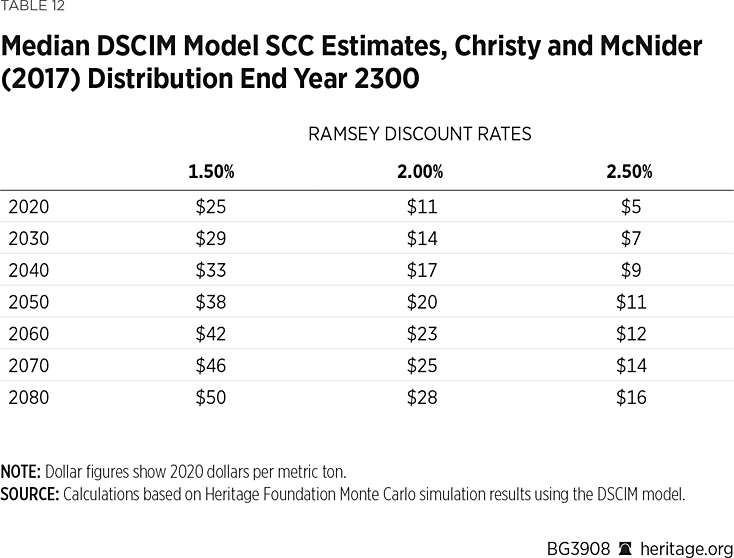
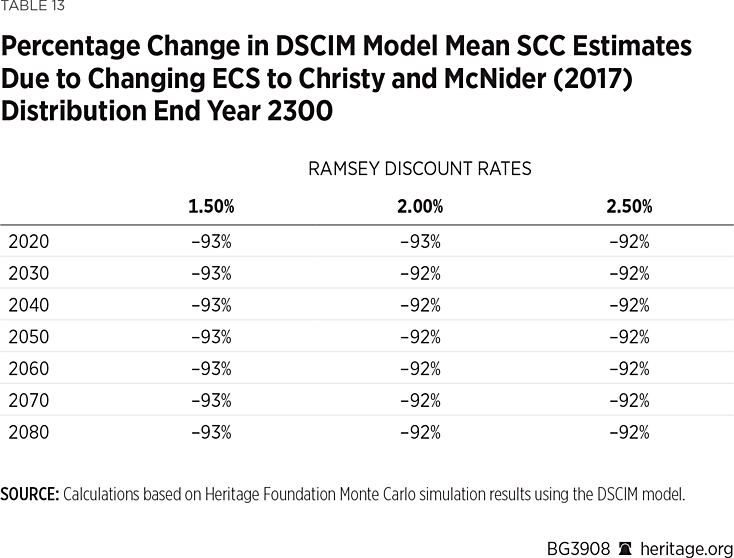
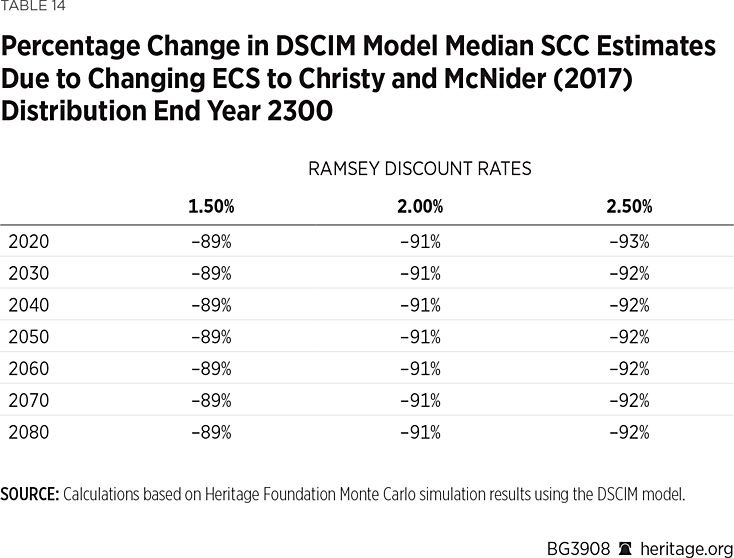
As these tables show, altering the choice of climate sensitivity to that of the Lewis distribution elicits significant reductions in both the mean and median SCC estimates, with an average decrease of nearly 60 percent. The Christy and McNider (2017) distribution, as illustrated in Tables 11–14, also shows pronounced reductions in SCC estimates, with an average of approximately 90 percent.
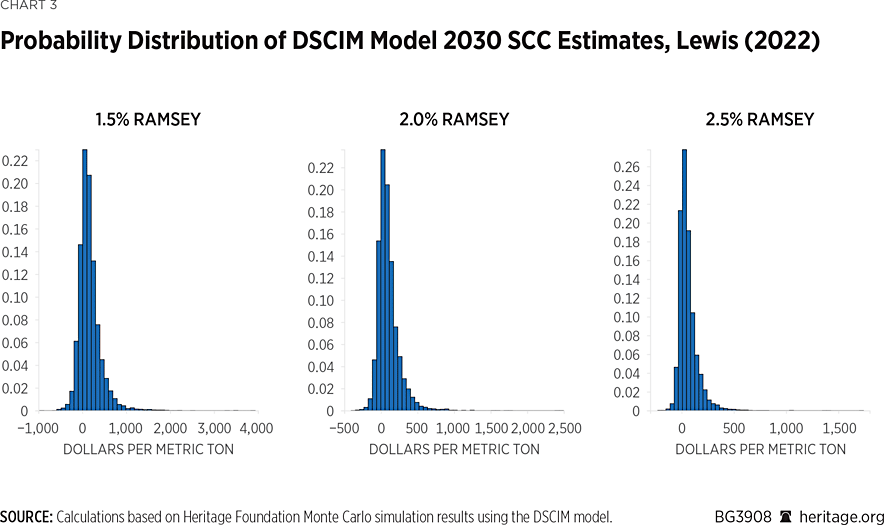
Charts 3 and 4 show histograms under the alternative distributions. As Chart 3 shows, the SCC values are considerably lower under the Lewis (2022) distribution compared to the EPA specification. Namely, the mean estimates are $160, $97, and $59, with 95th percentiles of $590, $361, and $220 and standard deviations of $256, $150, and $92 under 1.5 percent, 2.0 percent, and 2.5 percent Ramsey discount rates, respectively.
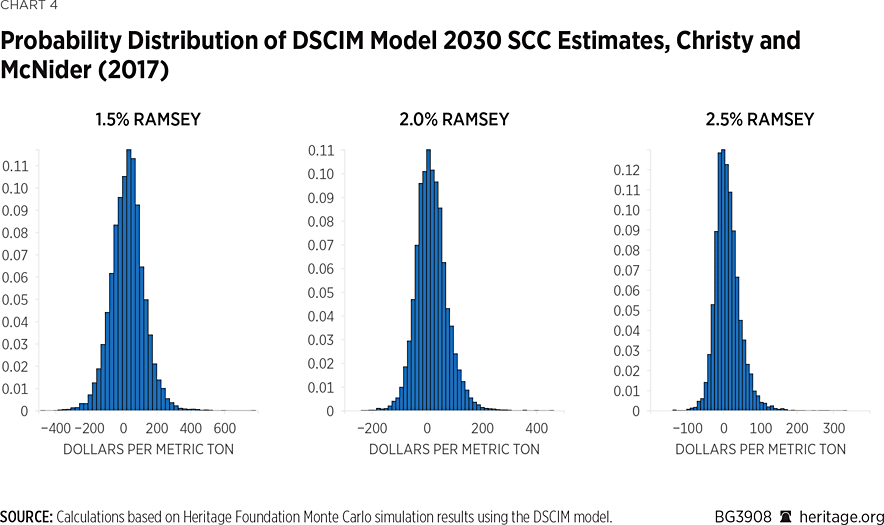
As Chart 4 shows, as is the case with the Lewis (2022) distribution, the SCC is also substantially lower under the Christy and McNider (2017) distribution compared to the EPA’s specified climate sensitivity distribution. Namely, the mean estimates of the SCC are $28, $18, and $11, with 95th percentiles of $187, $115, and $72 and standard deviations of $98, $57, and $34 under 1.5 percent, 2.0 percent, and 2.5 percent discount rates, respectively.
Charts 3 and 4 clearly show that, in addition to the point estimates presented in Tables 7–14, the SCC is significantly lower under these alternative specifications of climate sensitivity. In the following section, we discuss a largely unexplored phenomenon—the concept and probability of a negative SCC.
Probability of a Negative SCC
CO2 plays a crucial role in photosynthesis and can contribute to environmental benefits such as higher agricultural yields and extended growing seasons, particularly under conditions of moderate warming. To its credit, DSCIM recognizes that in some scenarios, these positive effects may outweigh the projected climate damages, allowing for the possibility of a negative SCC.REF
Tables 15–18 display the probability of a negative SCC under both the EPA’s assumptions and the alternative assumptions presented in this report.Table 15 reports an average probability of a negative SCC of 0.15 under the EPA’s assumptions, and this falls slightly to 0.13 when the time horizon is truncated to 2150. This decline reflects the shorter period over which long-term climate impacts can be realized, which in turn reduces the probability of scenarios in which moderate warming results in net economic benefits. Under the Lewis (2022) and Christy and McNider (2017) ECS distributions, Tables 17 and 18 show a 0.23 and 0.39 probability of a negative SCC, respectively.
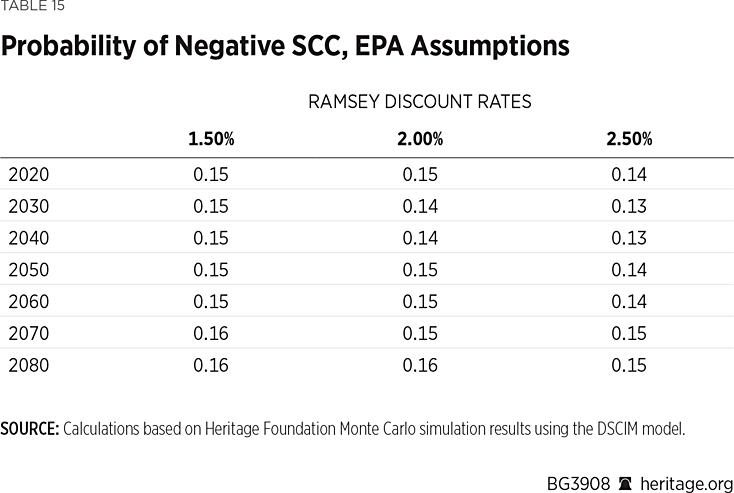
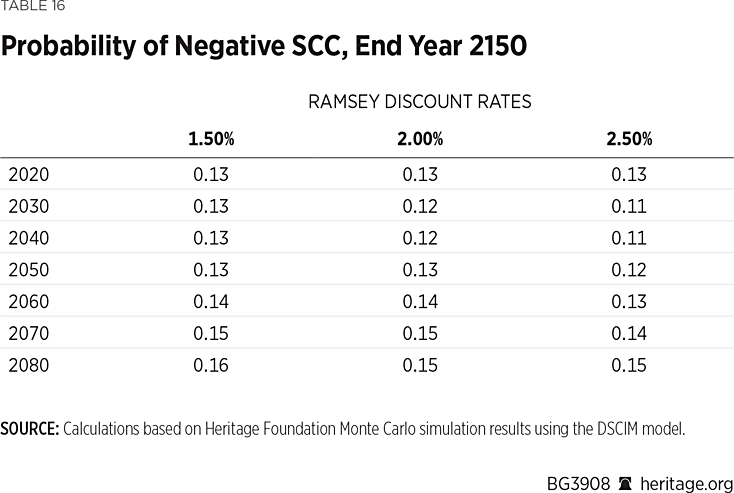
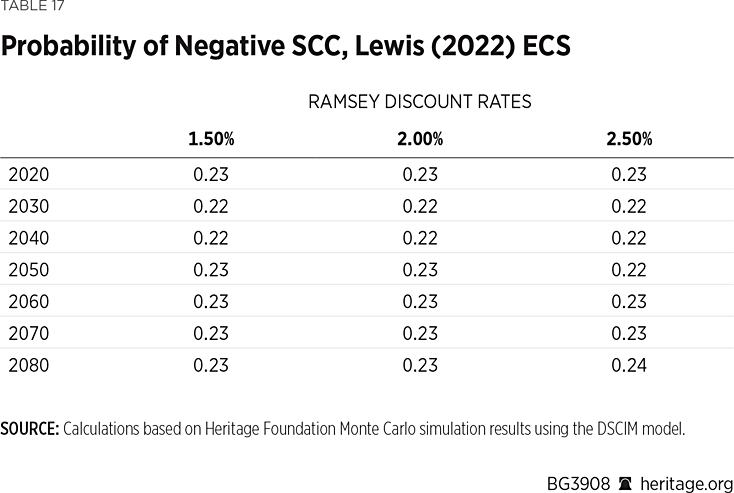
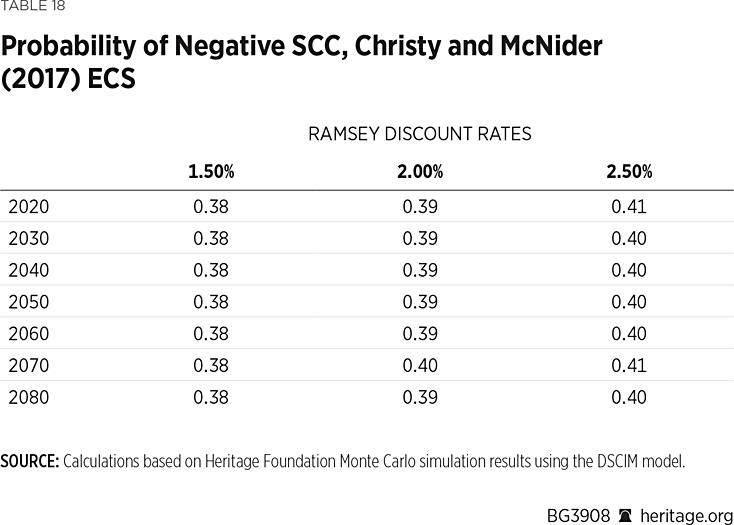
These higher probabilities for 2030 are also evidenced in Charts 1–4. Under the assumptions made by the prior Administration’s EPA, the probability of a negative SCC ranges between 0.13 and 0.15 for 2030. As Charts 3 and 4 show, these probabilities increase substantially under the Lewis (2022) and Christy and McNider (2017) ECS distributions, ranging from 0.22 to 0.40. These increased probabilities of negative SCC values reflect the modeled benefits of moderate warming under these ECS distributions.
A negative SCC, reflecting net benefits from CO2 emissions, suggests that, if anything, carbon emissions should not be taxed but rather subsidized. Of course, we do not take the position that the government should tax or subsidize greenhouse gas emissions, but the model’s negative SCC estimates under reasonable adjustments to assumptions underscore the sensitivity of these models to user manipulation. In fact, research published over the past several years has suggested that CO2 fertilization effects may be vastly understated in IAM modeling.REF
Policy Implications and Conclusions
As is the case with other IAMs, the DSCIM model intends to estimate the economic impact of climate change.REF However, also as with other IAMs, the DSCIM model is sensitive to reasonable changes in assumptions and therefore highly vulnerable to user manipulation. Consequently, policymakers—such as those in the Biden Administration—can manipulate the SCC by selecting assumptions that support their preferred outcomes, using circular logic to both produce and justify predetermined regulatory policies.
As a result, we offer the following policy recommendations:
- To ensure transparency and reproducibility in regulatory analysis, federal agencies should not be able to hide behind the work of outside groups. Instead, they should maintain and publicly provide access to the full suite of models and code used to generate key policy metrics such as the SCC—including the ability to adjust core assumptions. Referring stakeholders to external research groups—particularly when replication requires high-performance computing—creates practical obstacles that limit independent scrutiny. Requiring agencies to directly host accessible and modifiable code would strengthen accountability and improve the integrity of cost-benefit analysis in environmental policymaking.
- In the “Unleashing American Energy” executive order issued on January 20, 2025, President Trump instructed the EPA Administrator to evaluate the use of the SCC, including considering its elimination.REF On May 5, 2025, the Trump Administration issued this guidance, indicating that federal agencies should not consider the SCC in policymaking unless “plainly required by their governing statute.”REF
- Although this guidance is indeed a step in the right direction, a future Administration could potentially reinstate the SCC framework with an executive order, as President Biden did during his term. To prevent this, Congress should enact legislation prohibiting the use of the SCC in policymaking. During the 118th Congress, Representatives Richard Hudson (R–NC) and Kevin Hern (R–OK), along with several other lawmakers, introduced a bill to do so. However, it failed to ultimately become law. Lawmakers should continue pursuing legislative measures to ensure that future Administrations, regardless of party, cannot reinstate the SCC in regulatory decision-making.REF
Austin Gae is a Research Associate in the Center for Energy, Climate, and Environment at The Heritage Foundation. Kevin Dayaratna is Director, Chief Statistician, and Senior Research Fellow in the Center for Data Analysis at The Heritage Foundation.


