Entitlement programs in the United States have expanded more than tenfold since their inception, but workers are nowhere near 10 times better off as a result. It may seem as though programs that provide cash benefits and medical care would make Americans better off, but instead, they often make them worse off, depriving them of autonomy, personal choice, and higher incomes and saddling them with a mountain of debt. Medicare and Social Security carry $70 trillion worth of unfunded obligations over the next 75 years—the equivalent of a $445,000 credit card bill placed on every U.S. worker.1
Most workers do not realize that the amount they pay into Social Security and Medicare does not come close to covering the actual costs of the programs. If they did, they would likely prefer smaller programs with more targeted benefits.
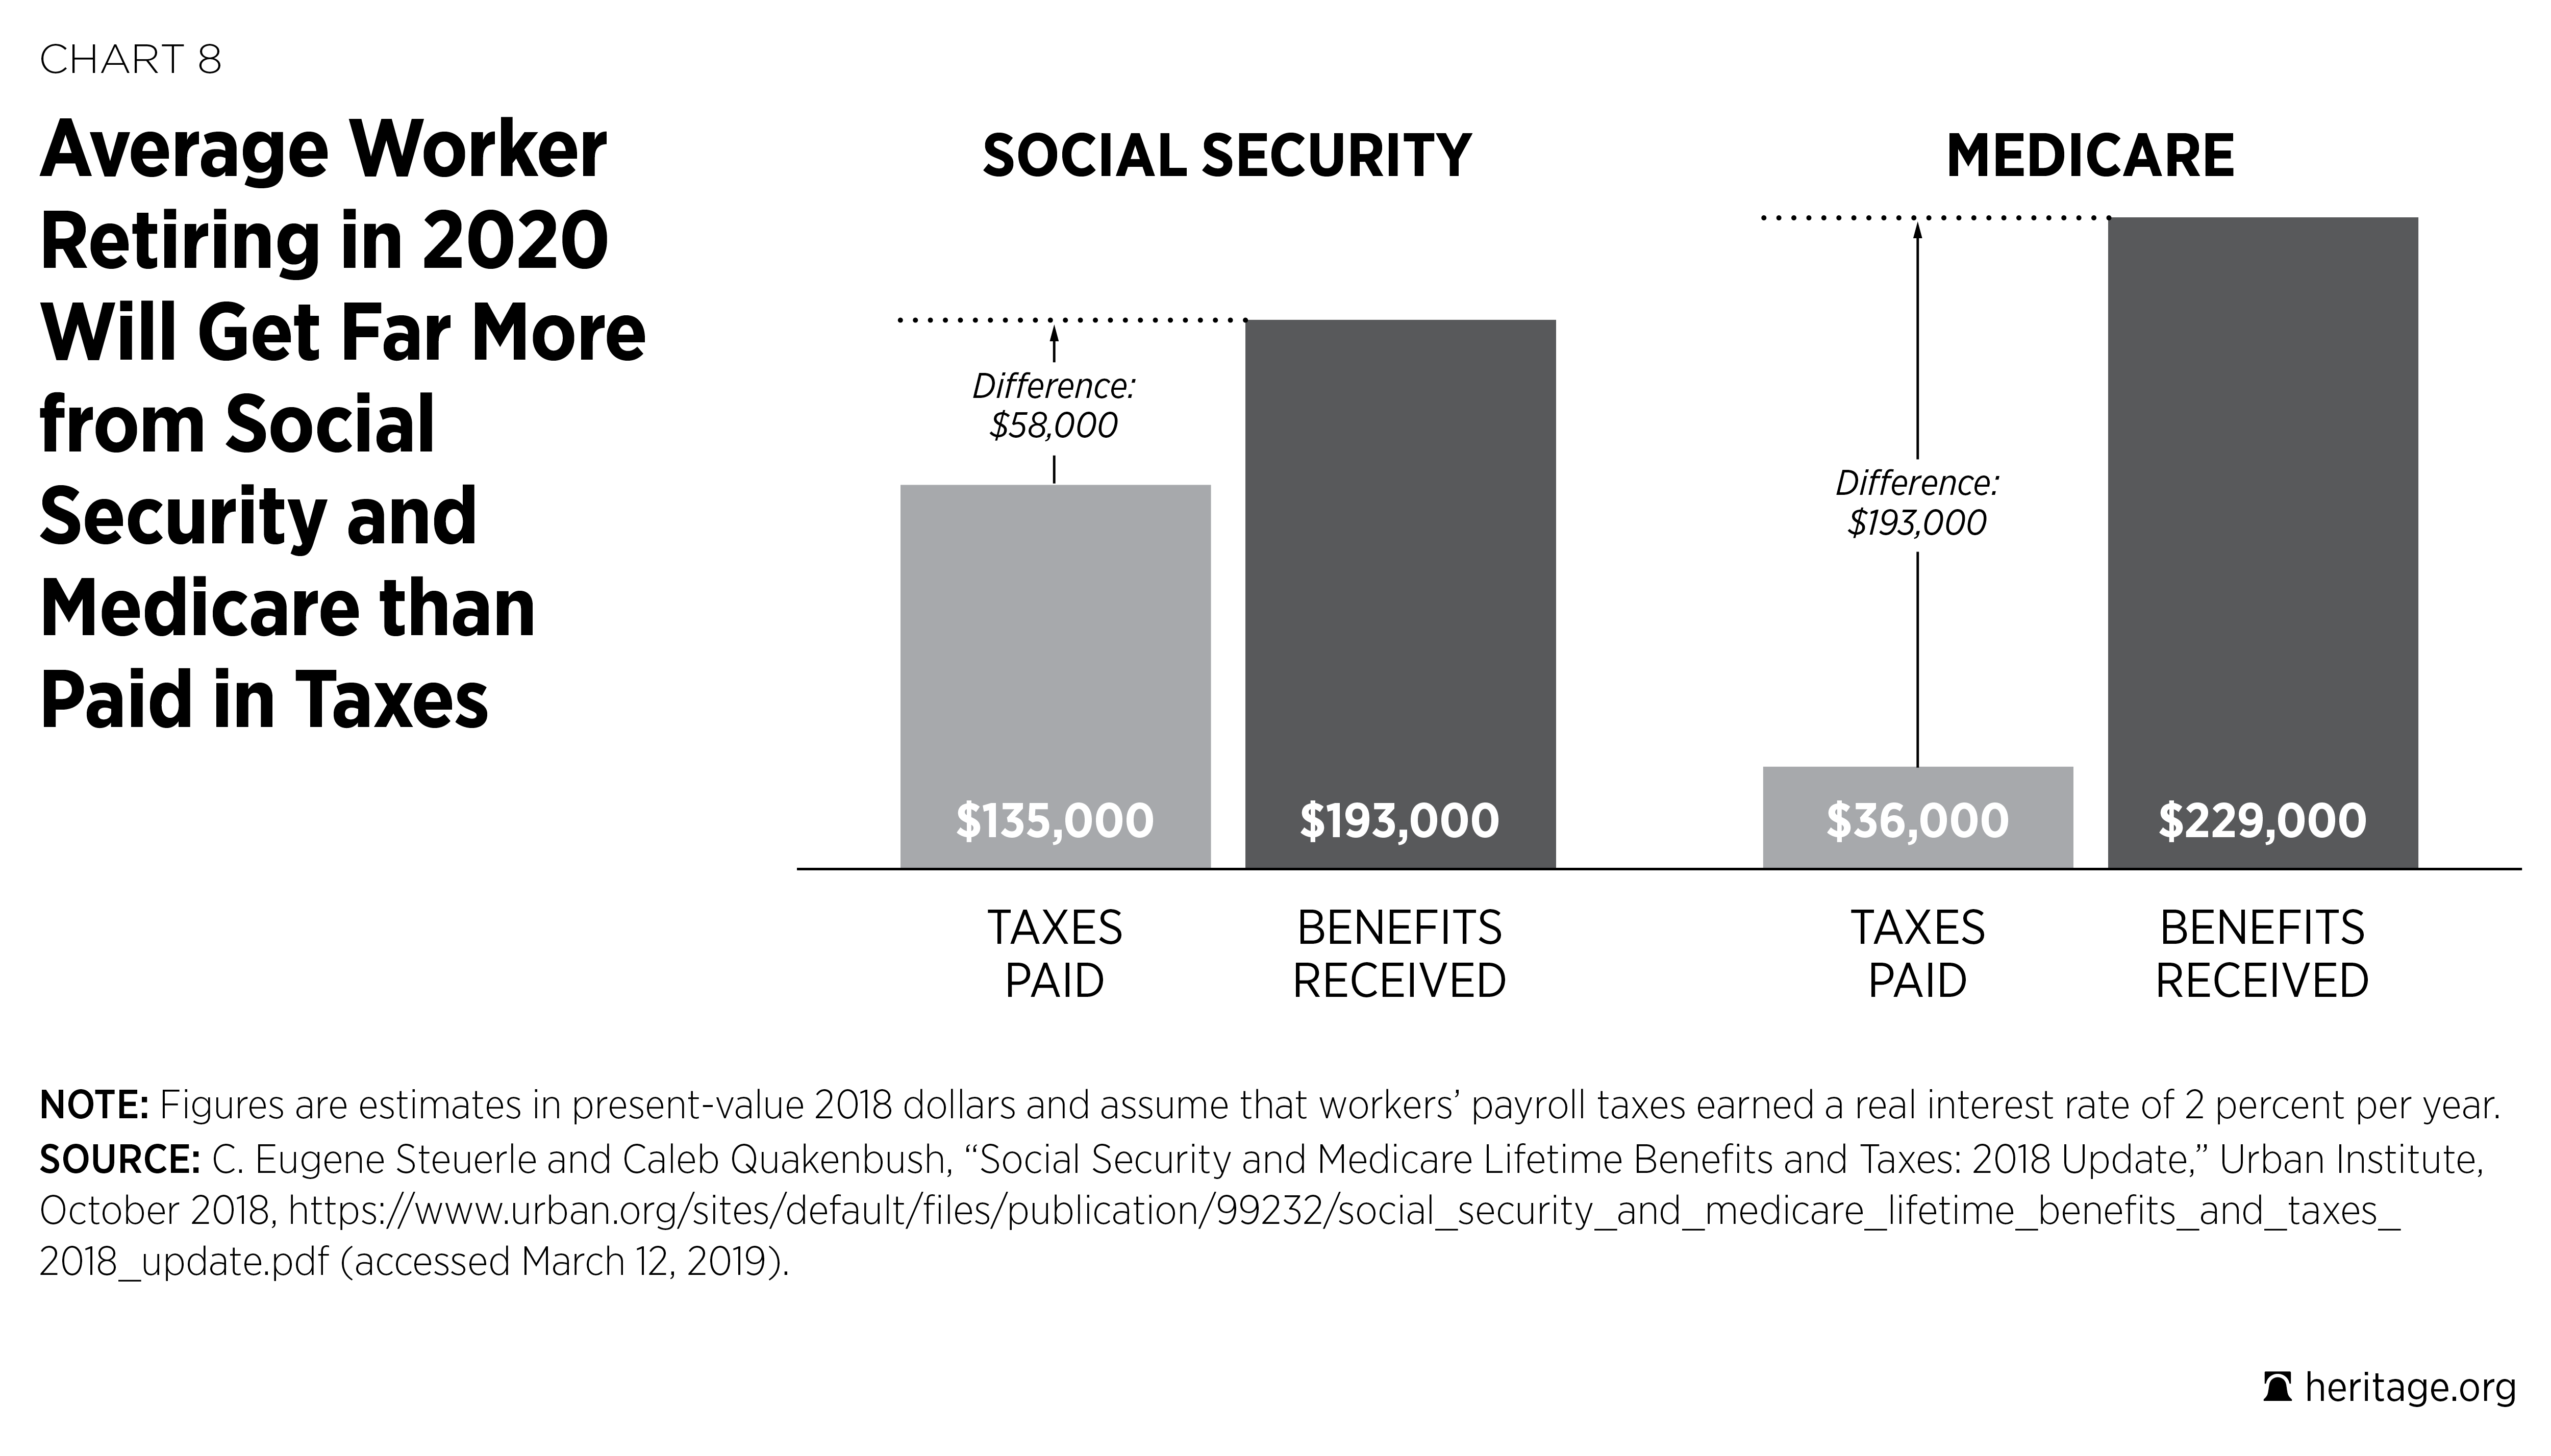
According to the Urban Institute, the average worker retiring in 2020 will have paid $135,000 in Social Security taxes and will receive $193,000 in Social Security benefits.2 The gap for Medicare is even larger; the average retiree in 2020 will have paid $36,000 in Medicare taxes and will receive $229,000 in Medicare benefits (excluding premiums paid by the retiree). This means that the average retiree in 2020 will receive about 2.5 times as much in benefits as he or she paid into the systems.
Thus, if workers actually had to pay for the full cost of their Social Security and Medicare benefits, their payroll taxes would be substantially higher. Instead, the actual costs are passed down to younger and future generations in the form of higher national debt and reduced opportunities. In addition to imposing a crushing burden on future workers, drastic payroll tax increases would prevent them from being able to save money on their own—money that could be invested and earn a positive return instead of immediately going to pay for current retirees’ benefits.
Both Social Security and Medicare provide zero percent returns because the payroll taxes taken out of workers’ earnings are not saved (as many people believe they are), but rather are transferred immediately to current retirees. Even the interest earned on trust fund reserves represents a tax liability for workers and is unlike interest earned in private-sector trust funds. If workers could instead save on their own for their retirement needs, they would receive a lot more “bang for their buck” than they receive from America’s entitlement programs.
Notwithstanding their high costs, federal entitlement programs appear to offer things people want and need: income and health care benefits. The problem is that government control of these aspects of workers’ lives results in lower overall incomes, subpar health care, more dependence on government, and fewer opportunities. Instead of providing vital resources to the most vulnerable, America’s entitlement programs have ballooned to the point that about one in every three Americans relies on federal entitlements. This limits workers’ personal freedom and welfare, because instead of being in charge of their own circumstances, they must rely on the government to meet their most basic needs.
Today, one in five Americans is dependent on Medicaid for health care. A program initially designed to provide a safety net for a targeted set of low-income people who could not obtain coverage on their own has turned into the de facto health care option for low-income Americans. Opening the program to large numbers of able-bodied Americans, as done under Obamacare, dilutes its original purpose and creates competing demands on an already overstretched program that promises more than it can deliver.
The introduction of Obamacare has furthered the entitlement crisis not only by expanding dependence on Medicaid, but also by creating a new set of dependents through subsidies. Tying these subsidies to an insurance market that is heavily regulated by the government has driven up the cost of the coverage and pushed Millions of Americans out of the market altogether.
Today, as a result of Obamacare, costs are rising, choices are dwindling, and more Americans than ever before are dependent on the government for their health care. Were it not for the federal government’s hold over nearly all of low-income and older Americans’ health care, a large portion of retirees’ incomes, and the incomes and prospects of individuals with disabilities, many Americans—young and old—would benefit from far greater prosperity, greater opportunity, and more freedom and autonomy.
Social Security
Social Security began as a relatively small antipoverty program aimed at preventing individuals who were too old to work from outliving their savings. Yet the program’s costs have expanded from 0.35 percent of GDP in 1950 to 4.3 percent of GDP in 2018,3 and today, 42 percent of older Americans rely on Social Security for at least half of their income.4
Social Security’s costs and dominance of retirement income leave workers with less control and lower incomes than they otherwise would have. If a median male worker born in Florida in 1995, for example, had been able to invest his payroll taxes in a conservative mix of stocks and bonds instead of being forced to send them to the U.S. Treasury to help finance government deficits, he would be able to purchase a private annuity that would provide $47,000 more per year than Social Security promises to pay.5 Even the lowest earners would be able to purchase annuities at least 40 percent greater than Social Security can provide.6
Social Security was not originally intended either to take so much from workers’ paychecks or to be their primary source of retirement income. When the program began in 1935, it took only 2 percent of workers’ paychecks and promised never to take more than 6 percent. Today, Social Security’s retirement program takes 10.6 percent of workers’ paychecks (its disability insurance program takes another 1.8 percent, for a total of 12.4 percent), but it requires 13.23 percent to keep the program solvent for the next 75 years.7 If Congress were to raise taxes to keep the program solvent, the cost in taxes for an average worker who makes $52,000 per year (not including Medicare and Disability Insurance payroll taxes) would be $6,900 per year.
How did Social Security become so expensive?
For one thing, the program began at a time when the average life expectancy at birth in the U.S. was only 59 years for men and 63 years for women. With Social Security’s eligibility age at 65, the typical worker was not expected to receive Social Security benefits, and those who did receive them benefited for an average of 12.5 years.8 Today, however, with the average life expectancy at birth equal to 76 years for men and 81 years for women and an early eligibility age of 62, almost everyone receives Social Security, and they receive benefits for an average of two decades.9
In addition to expanding benefit periods, Social Security pays significantly higher benefit levels largely because it credits workers with higher incomes than they actually received throughout their working careers. In 1960, the average Social Security check for retired workers equaled $691 per month (in 2018 dollars). Today, the average retired worker receives more than twice as much—$1,420 per month—and retirees with the highest incomes receive $3,147 per month.
Social Security’s expansion has created a significant drain on federal resources: In 1960, Social Security cost $98 billion per year (in 2018 dollars), or 2.1 percent of GDP; today, Old-Age and Survivors Insurance (OASI) consumes $894 billion, or 4.3 percent of GDP.10 Moreover, it has become the government’s biggest expense: For every $1 spent on the core constitutional function of defense, the federal government spends $1.35 on Social Security’s retirement benefits.11 This was not the vision of our country’s founders or of those who created Social Security.
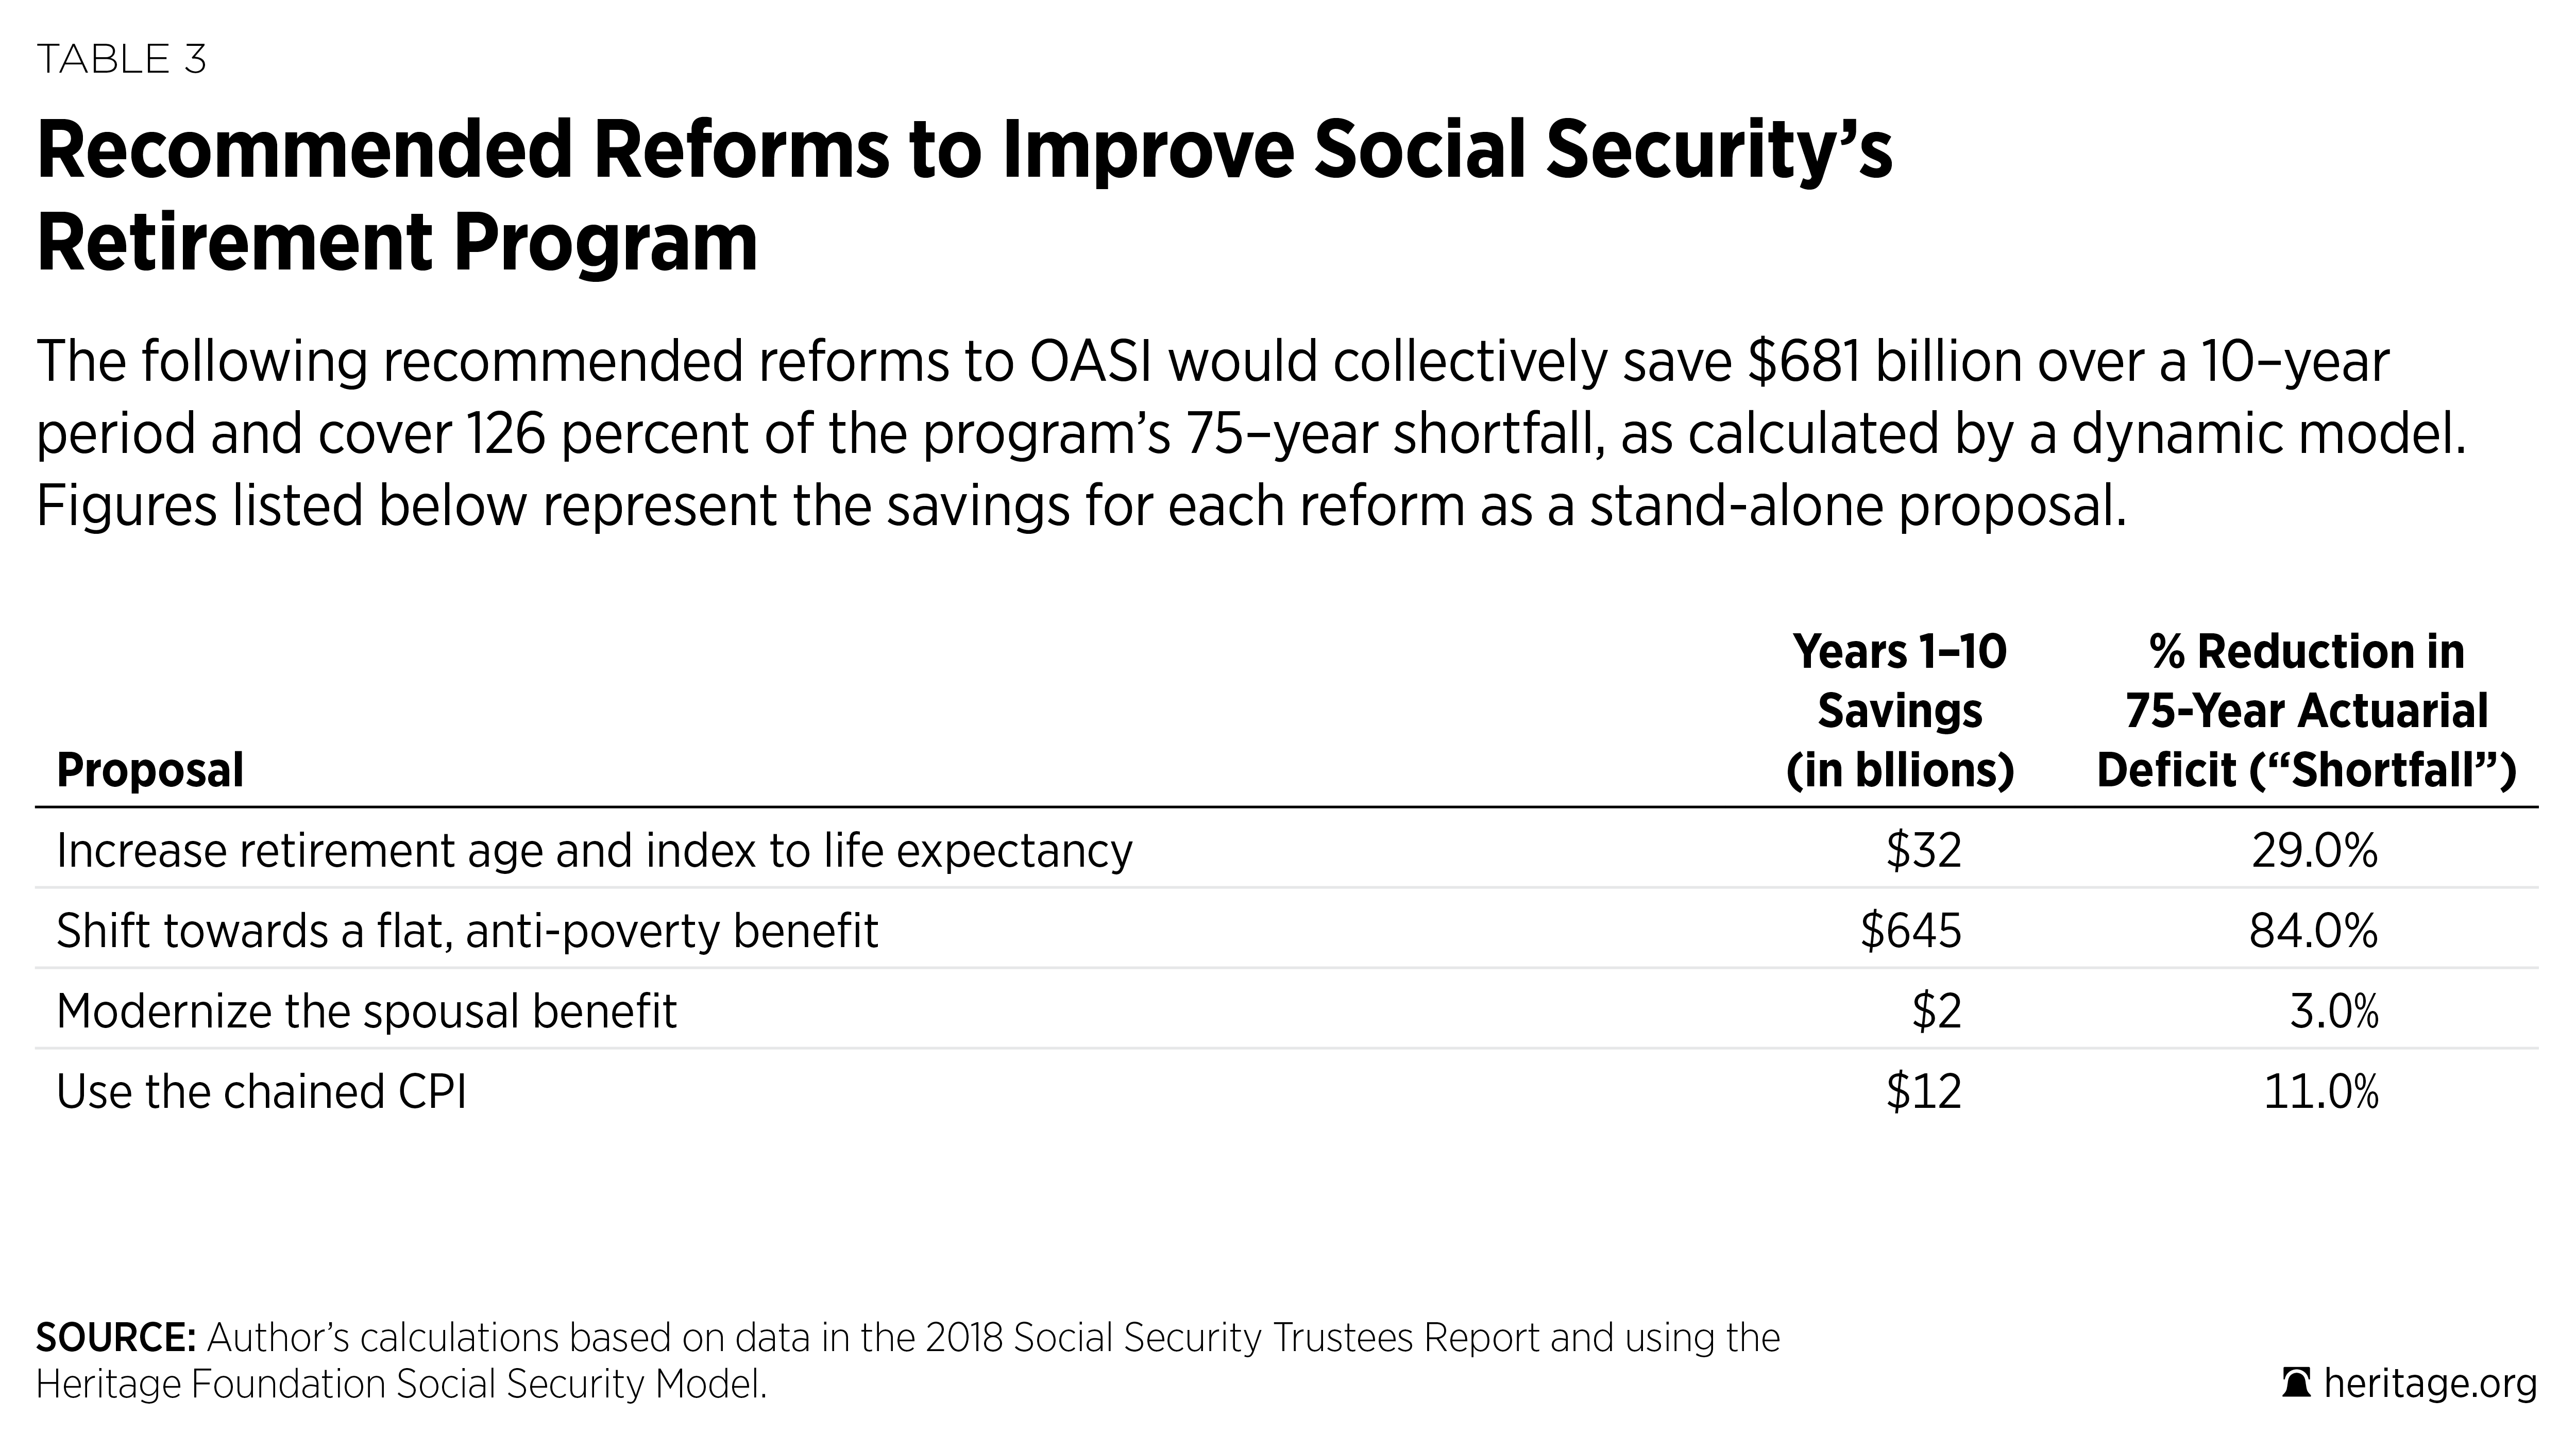
Proposed Social Security Reforms. Social Security’s deficits are enormous, but policymakers have many reasonable options available to them that, if adopted, would reduce its costs and burdens and improve its value. Those options, along with their associated savings as estimated by The Heritage Foundation’s Social Security Model, include the following:
- Increase Social Security’s retirement age and index it to life expectancy so that Social Security’s benefits would automatically adjust to reflect individuals’ longer life spans and additional work capacity.12 This would save $32 billion over 10 years and reduce Social Security’s 75-year shortfall by 29 percent.
- Shift toward a flat antipoverty benefit so that the program could better align its resources with individuals’ needs and help to prevent more elderly people from living in poverty.13 This would save $645 billion over 10 years and reduce Social Security’s 75-year shortfall by 84 percent.
- Modernize the program’s spousal benefit to account for the fact that most women earn Social Security benefits based on their own work history. This would save $2 billion over 10 years and reduce Social Security’s 75-year shortfall by 3 percent.
- Use the chained consumer price index (CPI) for Social Security’s benefit calculations to provide a better adjustment for inflation. This would save $12 billion over 10 years and reduce Social Security’s 75-year shortfall by 11 percent.
- Reduce the payroll tax to give workers more choice in deciding how to spend or save their earnings.
Savings. Collectively, these changes would reduce Social Security’s costs by $681 billion over the next 10 years and cover 126 percent of its 75-year financial shortfall.14 In the long run, these changes would make it possible for Social Security’s payroll tax rate to be reduced by 14.2 percent, from 10.6 percent to 9.1 percent.
Social Security Reform: Benefits for Workers and Retirees. These changes would not just solve Social Security’s financial shortfalls, however. They would also make workers and retirees better off. By targeting Social Security’s resources to those with the greatest need, the program would eventually require less of workers’ paychecks. This would enhance the ability of Americans to meet their financial needs throughout their lifetimes, accumulate significantly greater personal savings, and decide for themselves how best to use their own money.
While Social Security aims to provide workers with financial certainty in retirement—a guarantee that they will not outlive their savings—its projected insolvency in 2034 threatens this security. Social Security is not the only way to obtain a guaranteed lifetime stream of income in retirement. Private-sector annuities provide the same thing, except that workers own their annuities, and no one can take them away or reduce them as Congress can with Social Security.
A recent Heritage Foundation analysis showed that if workers’ payroll taxes were instead set aside in their own savings accounts, the average retiree would have twice as much income in retirement, and all younger workers—including even the lowest-income ones—could have more income during retirement.15 Moreover, the ability to leave bequests to heirs through private savings would be particularly advantageous for lower-income workers who tend to have shorter life expectancies and receive less in Social Security benefits. Bequests could provide an opportunity for an individual’s children or grandchildren to attend college, buy a home, or start a business.
Disability Insurance
Much like its retirement program, Social Security’s Disability Insurance (SSDI) program started out relatively small, providing benefits to just 1.3 percent of the working-age population in 1970.16 In June 2016, the Congressional Budget Office (CBO) reported that the percentage of working-age individuals receiving SSDI had more than tripled to 4.3 percent and that average inflation-adjusted benefits had increased from $5,100 in 1970 to $12,200 in 2015.17 Growth in the number of recipients coupled with higher benefits caused total, inflation-adjusted spending on the program to increase more than tenfold between 1970 and 2015.18 At an estimated $145 billion in 2019, the federal government spends about as much on SSDI benefits as it does on total compensation for all uniformed military personnel.19
While the SSDI tax rate has more than tripled from 0.5 percent at its inception to 1.8 percent today, it still does not generate enough revenue to cover the program’s costs. Keeping SSDI solvent for the next 75 years would require a 12 percent increase in the SSDI tax, from 1.8 percent to 2.01 percent.20
The SSDI program has served as a lifeline for certain individuals with disabilities, providing them with a modest but steady stream of income when they otherwise might have had to turn to family and friends, charitable organizations, or government welfare programs to make ends meet. Yet the program’s massive expansion in size and scope has not produced a similar increase in the well-being of individuals with disabilities. In many cases, because of its inefficiencies and inadequacies, SSDI has failed to meet workers’ basic needs on a timely basis, and its lax eligibility requirements and inadequate integrity checks allow and encourage individuals to receive benefits when they could otherwise perform meaningful work. In most cases, individuals who are capable of work are far better off—physically, mentally, and financially—than individuals who do not work and rely instead on the government to make ends meet.
Multiple factors have contributed to the SSDI program’s growth, including an increase in women’s labor force participation and thus the percentage of eligible SSDI beneficiaries, growth in the real value of SSDI benefits, loosened eligibility criteria, and the program’s unintended use as a substitute for a long-term unemployment and early-retirement program.
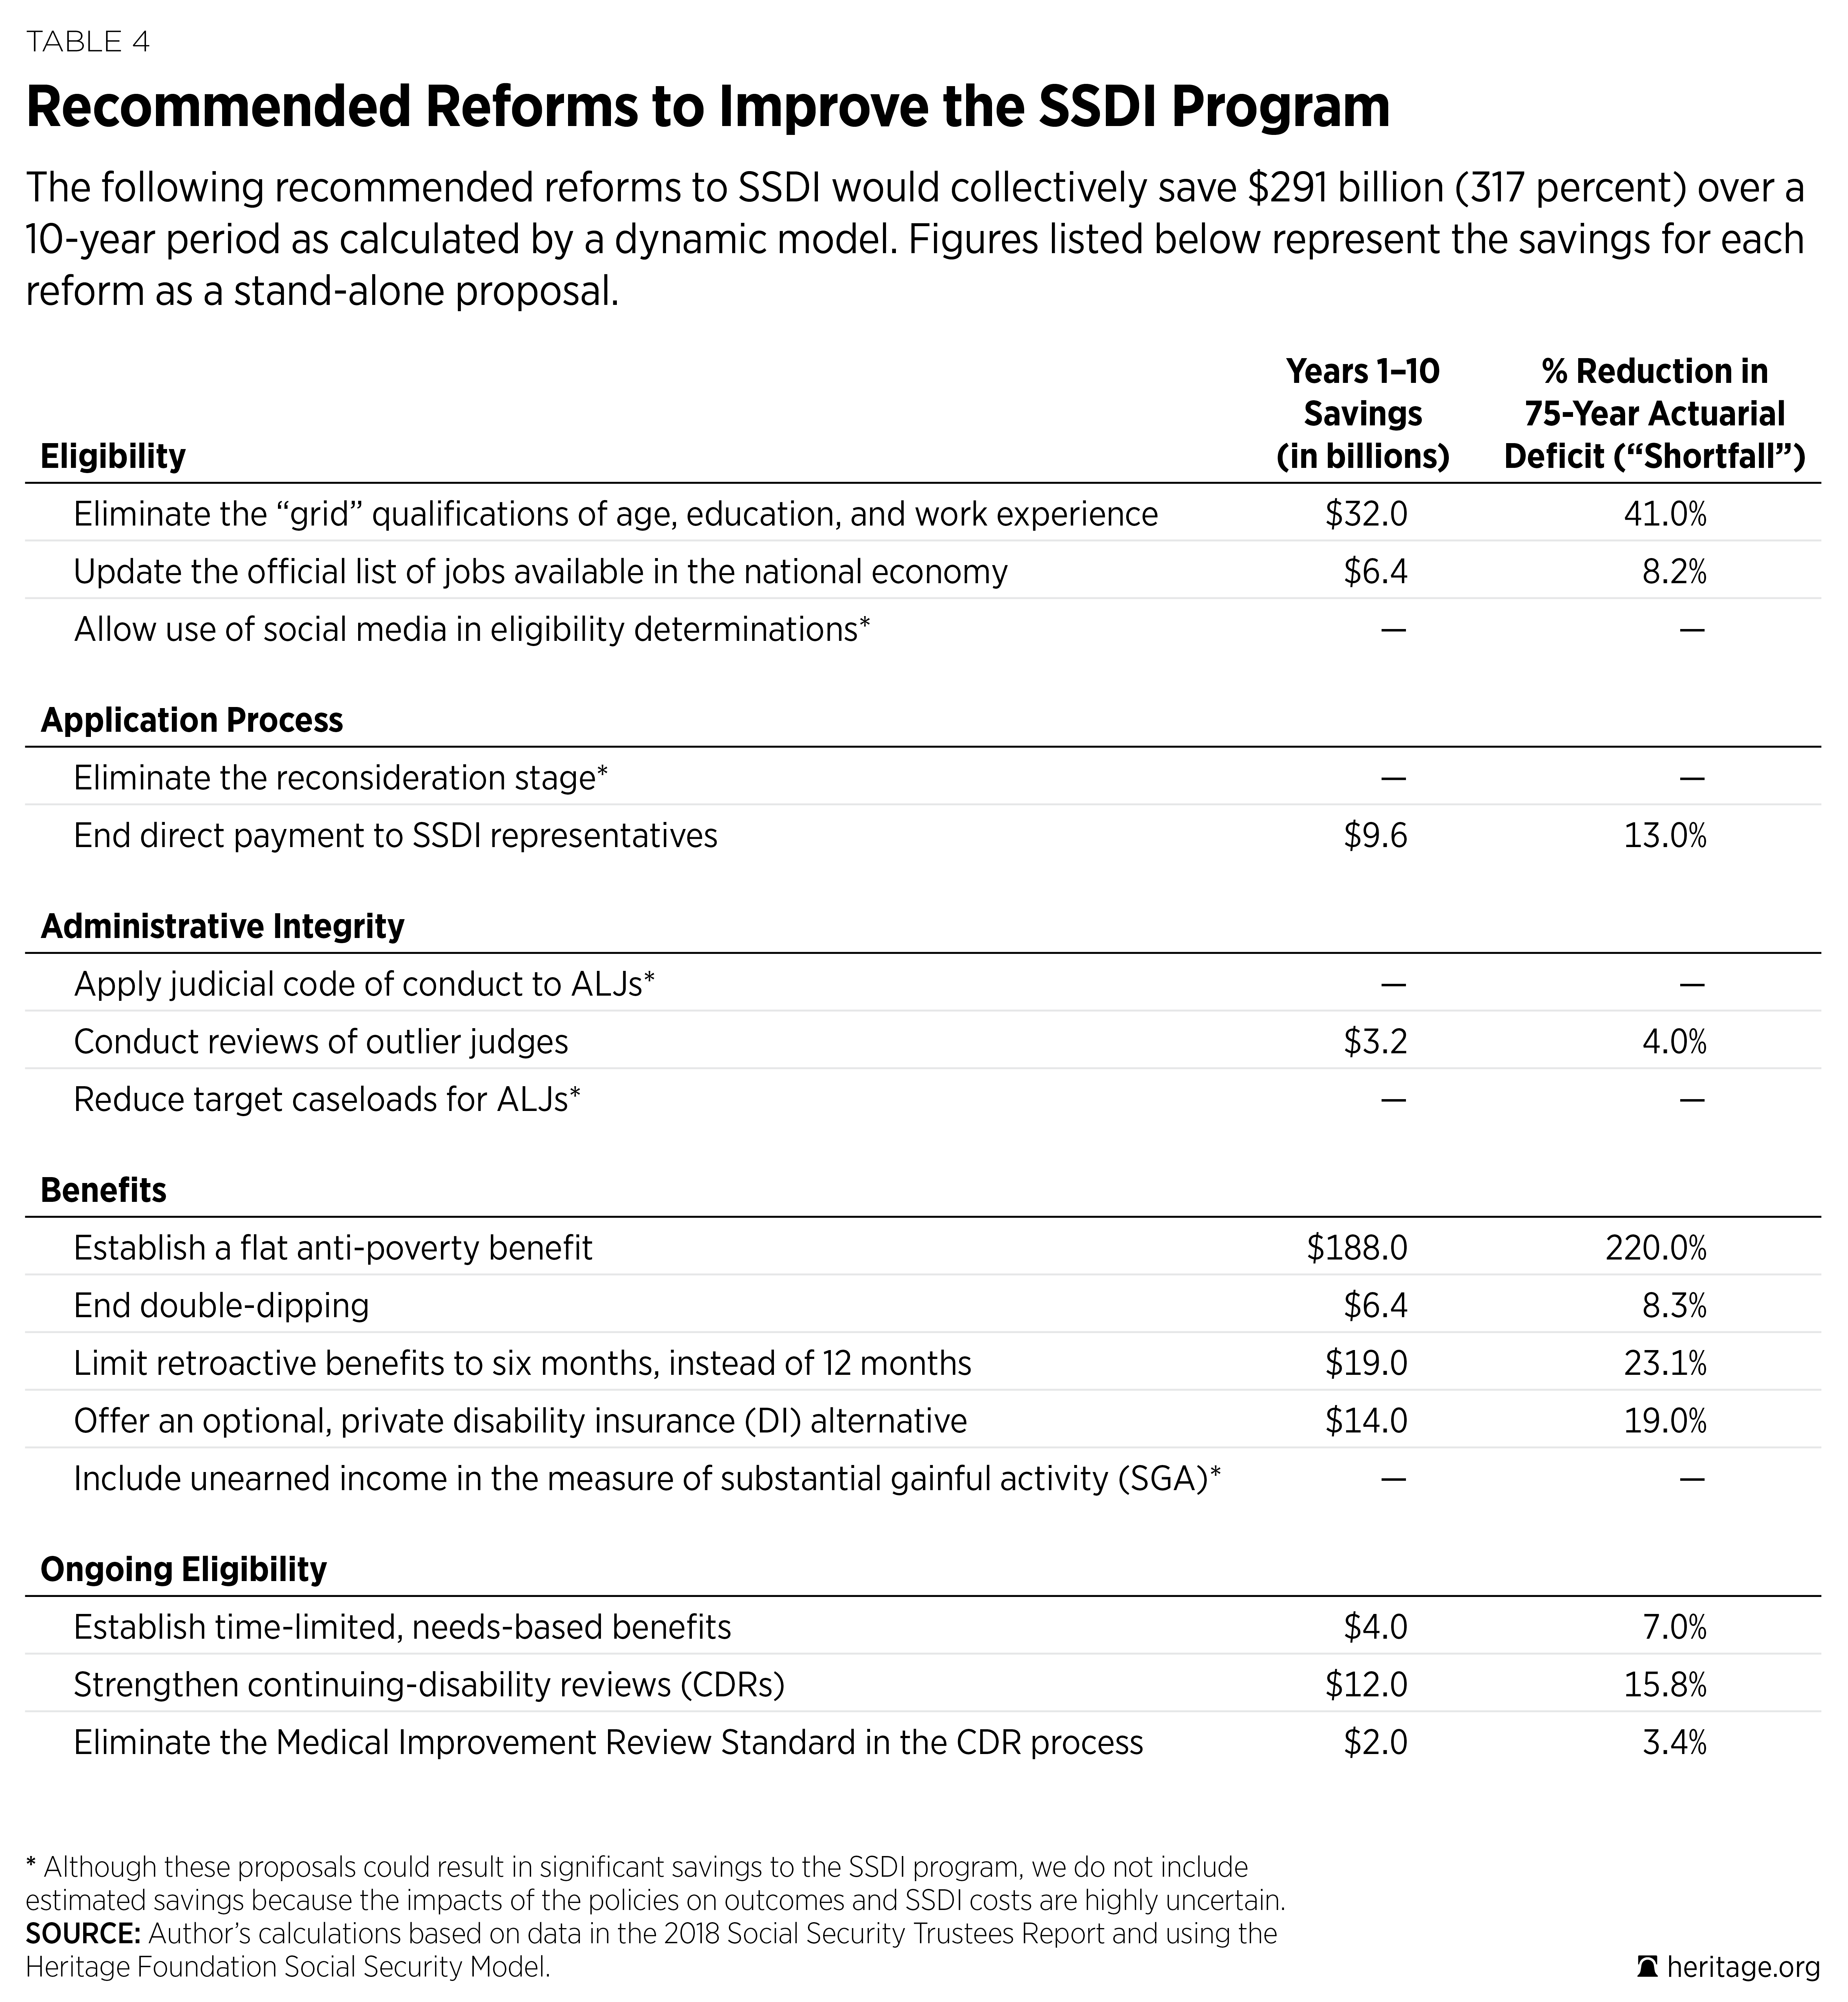
Proposed Disability Insurance Reforms. The fact that so many problems plague Social Security’s Disability Insurance program means there are plenty of ways to improve it, not only making it solvent for the long run, but also creating a program that better meets the needs of individuals with disabilities. Those constructive reforms, along with their associated savings as estimated by The Heritage Foundation’s Social Security Model, include the following:
- Implement a flat antipoverty benefit to achieve the program’s goals of preventing poverty and directing resources to those with the greatest need. This would save $188 billion over 10 years and reduce SSDI’s 75-year shortfall by 220 percent.
- Provide a need-based benefit period consistent with the program’s expectation that individuals should return to work if they recover. This would save $4 billion over 10 years and reduce SSDI’s 75-year shortfall by 7 percent.
- Eliminate the grid factors that improperly allow up to half of all individuals who receive disability insurance benefits to do so based on non-medical factors such as age, education, and work experience. This would save $32 billion over 10 years and reduce SSDI’s 75-year shortfall by 41 percent.
- Provide an optional private disability insurance component through a partial payroll tax credit as a way to provide workers with a more timely and efficient determination process as well as significantly greater employment support services. This would save $14 billion over 10 years and reduce SSDI’s 75-year shortfall by 19 percent.
- End direct payment of SSDI representatives so that individuals have control of their own money and representatives do not have an incentive to work against their clients’ interests by delaying decisions. This would save $9.6 billion over 10 years and reduce SSDI’s 75-year shortfall by 13 percent.
- Improve program integrity through such policies as strengthening continuing disability reviews (CDRs), including eliminating the Medical Improvement Review Standard (MIRS); applying the judicial code of conduct to administrative law judges (ALJs); reviewing outlier judges; and allowing social media as evidence in eligibility determinations. This would save $17.2 billion over 10 years and reduce SSDI’s 75-year shortfall by 22 percent.
- Improve program efficiency through such policies as eliminating the reconsideration stage, updating the official list of jobs available in the national economy, and reducing target caseloads for ALJs. This would save $6.4 billion over 10 years and reduce SSDI’s 75-year shortfall by 8 percent.
- Correct unintended benefit payments by ending double-dipping into both SSDI and unemployment insurance benefits, limiting retroactive benefits to six months, and including unearned income in the measure of substantial gainful activity. This would save $25.4 billion over 10 years and reduce SSDI’s 75-year shortfall by 33.5 percent.
Savings. The Heritage Foundation estimates that these reforms would reduce annual SSDI costs by $291 billion over 10 years.21 In the long run, these reforms would more than cover the program’s financial shortfalls and provide for a 44 percent reduction in the SSDI payroll tax rate, from 1.8 percentage points to 0.98 percentage points.
Disability Insurance Reforms: A Better System for Individuals with Disabilities. The current SSDI program is beyond broken. Individuals wait well over a year, on average, to learn whether or not they will qualify to receive SSDI benefits. During that time, many individuals have no reliable income, they receive no support to help them remain at work or get back to work, and their work potential and future employment opportunities deteriorate. If individuals with disabilities end up qualifying for SSDI benefits, they face a lifetime of inactivity and government dependence, with little incentive and no support to help them get back to work. Plus, nearly a third of SSDI beneficiaries receive lower than poverty-level benefits.
A rehabilitated and modernized SSDI system would help individuals with disabilities receive the assistance they need when they need it, and with less stigma and cynicism associated with receiving SSDI benefits. It would promote independence and physical and mental well-being over sedentary, less-fulfilling lives dependent on government programs. A more efficient and targeted program would also benefit workers of all ages and abilities by reducing the SSDI payroll tax burden and allowing workers to take home a greater portion of their earnings.
Medicare
When Medicare was enacted in 1965, roughly half of all persons over the age of 65 did not have health insurance. The program thus achieved its original intent by providing senior citizens with guaranteed health insurance coverage as well as a large measure of financial security. With the passage of time, however, Medicare’s spending increased far beyond its initial projections, creating crushing debt burdens and statutory and regulatory restrictions on beneficiaries’ coverage and care options. Among the consequences of current Medicare law are the creation of a centralized and complex fee-for-service structure that inhibits change and innovation in care delivery; excessive administrative burdens on doctors, hospitals, and other medical professionals; obstacles for seniors who want personalized medical care plans outside Medicare; and growing taxpayer costs.
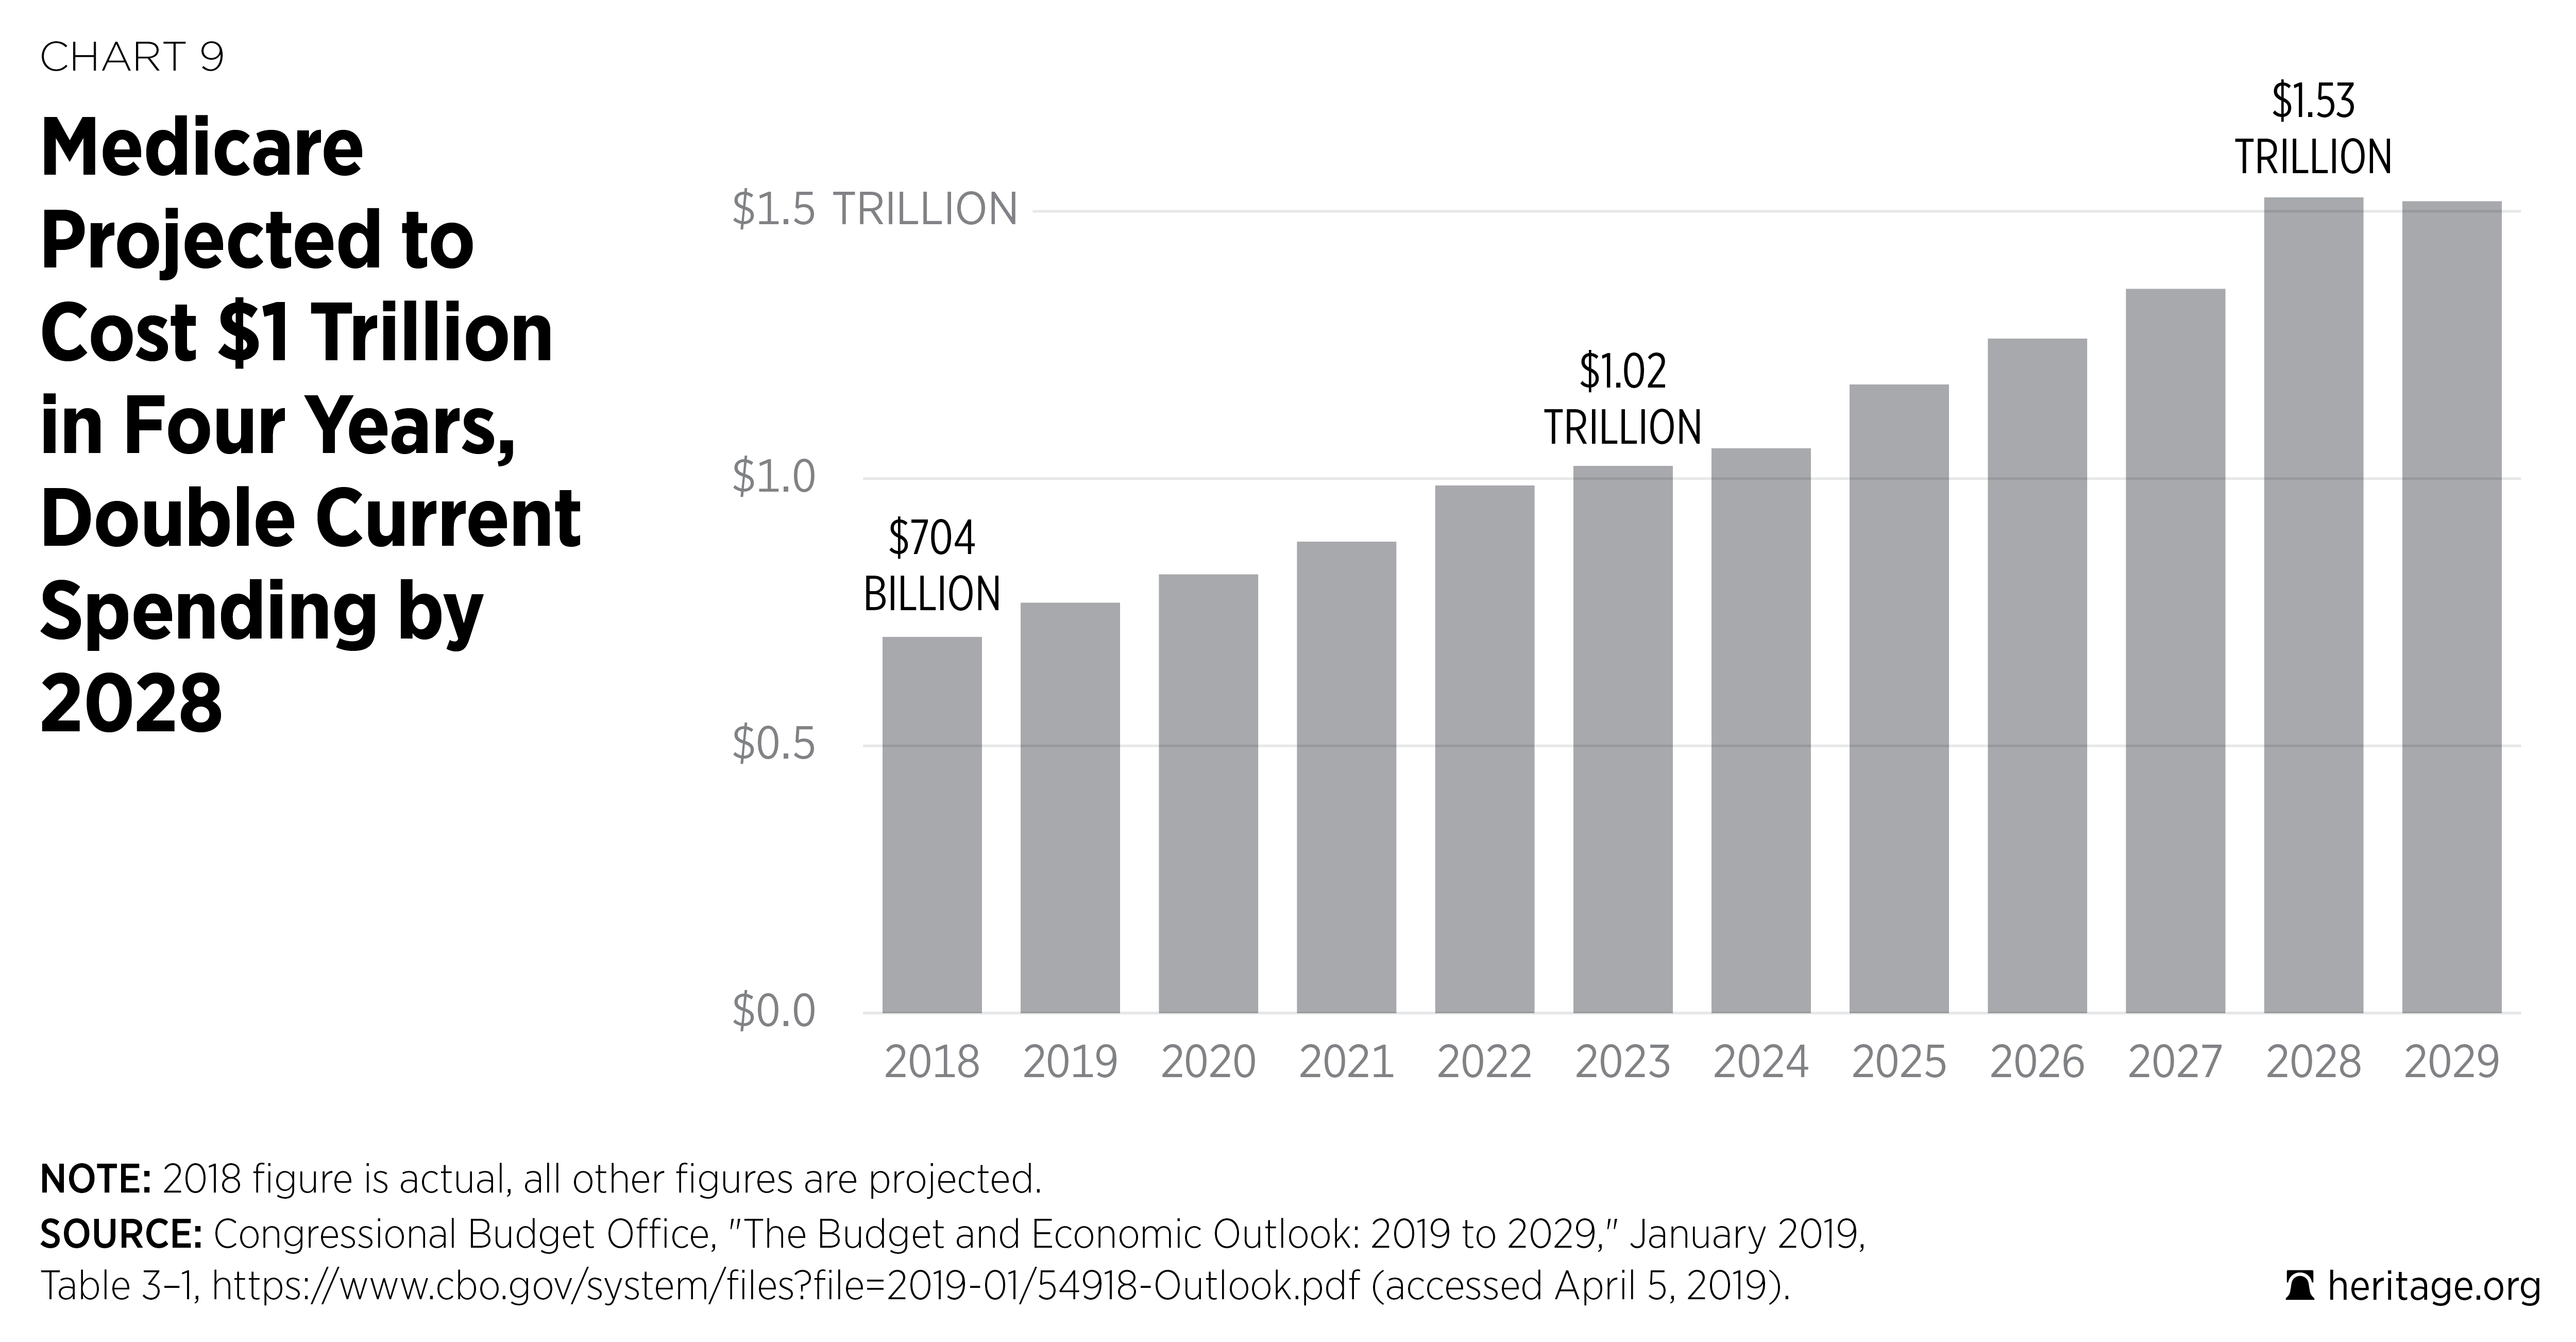
With the exception of Social Security, Medicare is the largest and fastest growing of all federal entitlements. With a projected 7 percent annual cost growth, total Medicare spending is projected to double over the next 10 years from $768 billion in 2019 to $1.526 trillion in 2028.22 Excluding Medicare premiums and interest payments that are not financed through taxes, the per-worker costs amount to $4,293 in 2019 and $8,238 by 2028, which means that some working Americans could pay as much for retirees’ health insurance each year as they pay for their own health insurance.23
Medicare’s current trajectory is simply unsustainable. The Centers for Medicare and Medicaid Services (CMS) Office of the Actuary has projected a 75-year unfunded obligation—long-term debt—for Medicare, based on a more realistic set of assumptions than current law, amounting to $47.3 trillion.24 For perspective, that amount is more than twice America’s current national debt, which already threatens the fiscal future of every man, woman, and child in America today. Americans cannot afford to neglect serious reform of the current Medicare program. The sooner lawmakers act to reform the program and make it sustainable for the long run, the better the program will perform while lowering costs for current and future generations.
Proposed Medicare Reforms. The Medicare trustees, CBO analysts, and a wide range of independent analysts and economists share a powerful consensus: The sooner policymakers address Medicare’s rapidly rising costs, the better the program will be for current and future generations of Medicare beneficiaries, as well as taxpayers.
There is no shortage of options. The Heritage reforms would not only ease the burden on current and future taxpayers, but also benefit seniors by securing their existing Medicare coverage, guaranteeing them solid catastrophic protection, and providing them with substantial benefits and savings from competition among health plans and providers. The effect would be to expand health plan choices and new care delivery options and thus intensify health plan and provider competition beyond what exists today in the Medicare Advantage and Medicare Part D programs. These reforms, along with their associated estimated savings, include the following:
- Simplify traditional Medicare to unify Medicare’s Hospital and Physician Programs and streamline cost sharing, and add a catastrophic benefit. For beneficiaries, this would make costs more predictable and the program less confusing, and the guarantee of catastrophic protection would give Millions of current and future seniors peace of mind. This reform would save an estimated $138.8 billion over the period 2020 to 2029.25
- Update Medicare’s premiums by gradually increasing them from 25 percent to 35 percent over 10 years. Today, beneficiaries pay only 25 percent of their premium costs, down from 50 percent when the Johnson Administration implemented Medicare in 1966. Gradually increasing the premiums to 35 percent over 10 years would allow all beneficiaries to benefit from Medicare’s enhanced solvency and improved financial condition. This reform would save an estimated $462.5 billion over the period 2020 to 2029.26 To further improve Medicare’s finances, Congress could also create a temporary Part A deductible to cover projected shortfalls in the Medicare Hospitalization program (Part A) and add a 10 percent cost-sharing requirement to the Medicare home health program.
- Reduce taxpayer subsidies for wealthy Medicare recipients to relieve cost pressure on taxpayers and slightly reduce the Part B and D premium costs for middle-income beneficiaries. Current law reduces taxpayers’ premium subsidies for high-income beneficiaries. Instead of reducing subsidies for only the top 6 percent, Congress should apply reduced subsidies to roughly the top 10 percent of Medicare beneficiaries. This reform would save an estimated $438.4 billion between 2020 and 2029.27
- Harmonize Medicare’s and Social Security’s ages of eligibility and then index the eligibility age for both programs to life expectancy. Social Security’s age of eligibility is 67, and Medicare’s is 65. Congress should raise Medicare’s eligibility age by three months per year over 10 years to bring it in line with Social Security’s and then index the eligibility age for both programs to life expectancy. This is a commonsense reform, given the significant increase in life expectancies and work capacity, and would reduce the negative impact of current government policies that encourage older Americans to end their productive careers earlier than they otherwise would. This reform would reduce Medicare outlays by $82.0 billion between 2020 and 2029.28
- Base Medicare Advantage (Part C) payment on straight market competition instead of the current cumbersome combination of competitive bidding and Medicare’s administrative pricing. Basing payments solely on straight market-based competitive bidding would allow seniors to secure lower costs, better care, and innovations in benefit design and care delivery through more intensified market competition. This reform would save an estimated $36 billion between 2020 and 2029.29
- Transform the entire Medicare program into a defined-contribution (premium-support) system to create competition between traditional Medicare and a wide range of private health plans, including employer-sponsored and health savings account plans. Most seniors are enrolled in a defined-contribution Medicare plan through which the government makes a standard contribution to the health plan of their choice, either for comprehensive coverage under Medicare Advantage (Part C) or for drug coverage (Part D). Applying this approach to all of Medicare would give seniors more choices, lower costs, and better care. This reform would save between $384.3 billion and $884.5 billion over the 2020–2029 period.30
Savings. The Heritage Foundation estimates that reforms in the current Medicare program would result in savings of at least $1.1 trillion over the next 10 years.31 As noted, it is estimated that a transition to premium support would save between $384 billion and $884 billion.
Medicare Reforms: Lower Costs and Better Health Care for Seniors. America’s continued progress in biomedical research and development, including new drug therapies and medical technologies, promises to deliver major 21st century advances in medical treatment. If more widely available at competitive prices, these goods and services can combat the onslaught of chronic and debilitating disease and improve the quality of life for Millions of senior citizens. At the same time, policymakers should improve the Medicare subsidy program and focus financial assistance on those who need the most help: the poorest and sickest.
Better government central planning will not secure high-quality health care. Rather, high-quality health care will flow from the intense, consumer-driven competition among health plans and providers where price and performance are transparent. Choice and competition will drive innovation in benefit design and care delivery, increase the productivity of the health care sector of the economy, and secure real value for health care dollars. A powerful injection of market forces will accomplish these objectives and improve the quality of life and health for Millions of Americans.
If Washington policymakers continue to reject reform, they will lock current and future generations of Medicare beneficiaries into a bureaucratic and inflexible status quo characterized by reams of red tape. If they refuse to take even modest steps to improve the fiscal condition of the program, they will condemn Millions of Americans to trillions of dollars of long-term debt. Sooner or later, the progressively higher costs of inaction will inevitably be borne by Medicare beneficiaries and taxpayers alike.
Medicaid
Medicaid was established to provide health care for certain lower-income populations, including low-income pregnant women, children, the aged, and the disabled. Unlike Medicare and Social Security, Medicaid is not exclusively a federal program; it is a joint federal and state arrangement. The federal government finances a portion of the program and sets conditions of operation, and the states finance a portion of the program and administer it within the latitude provided by the federal statute. The result is that no two Medicaid programs look alike.
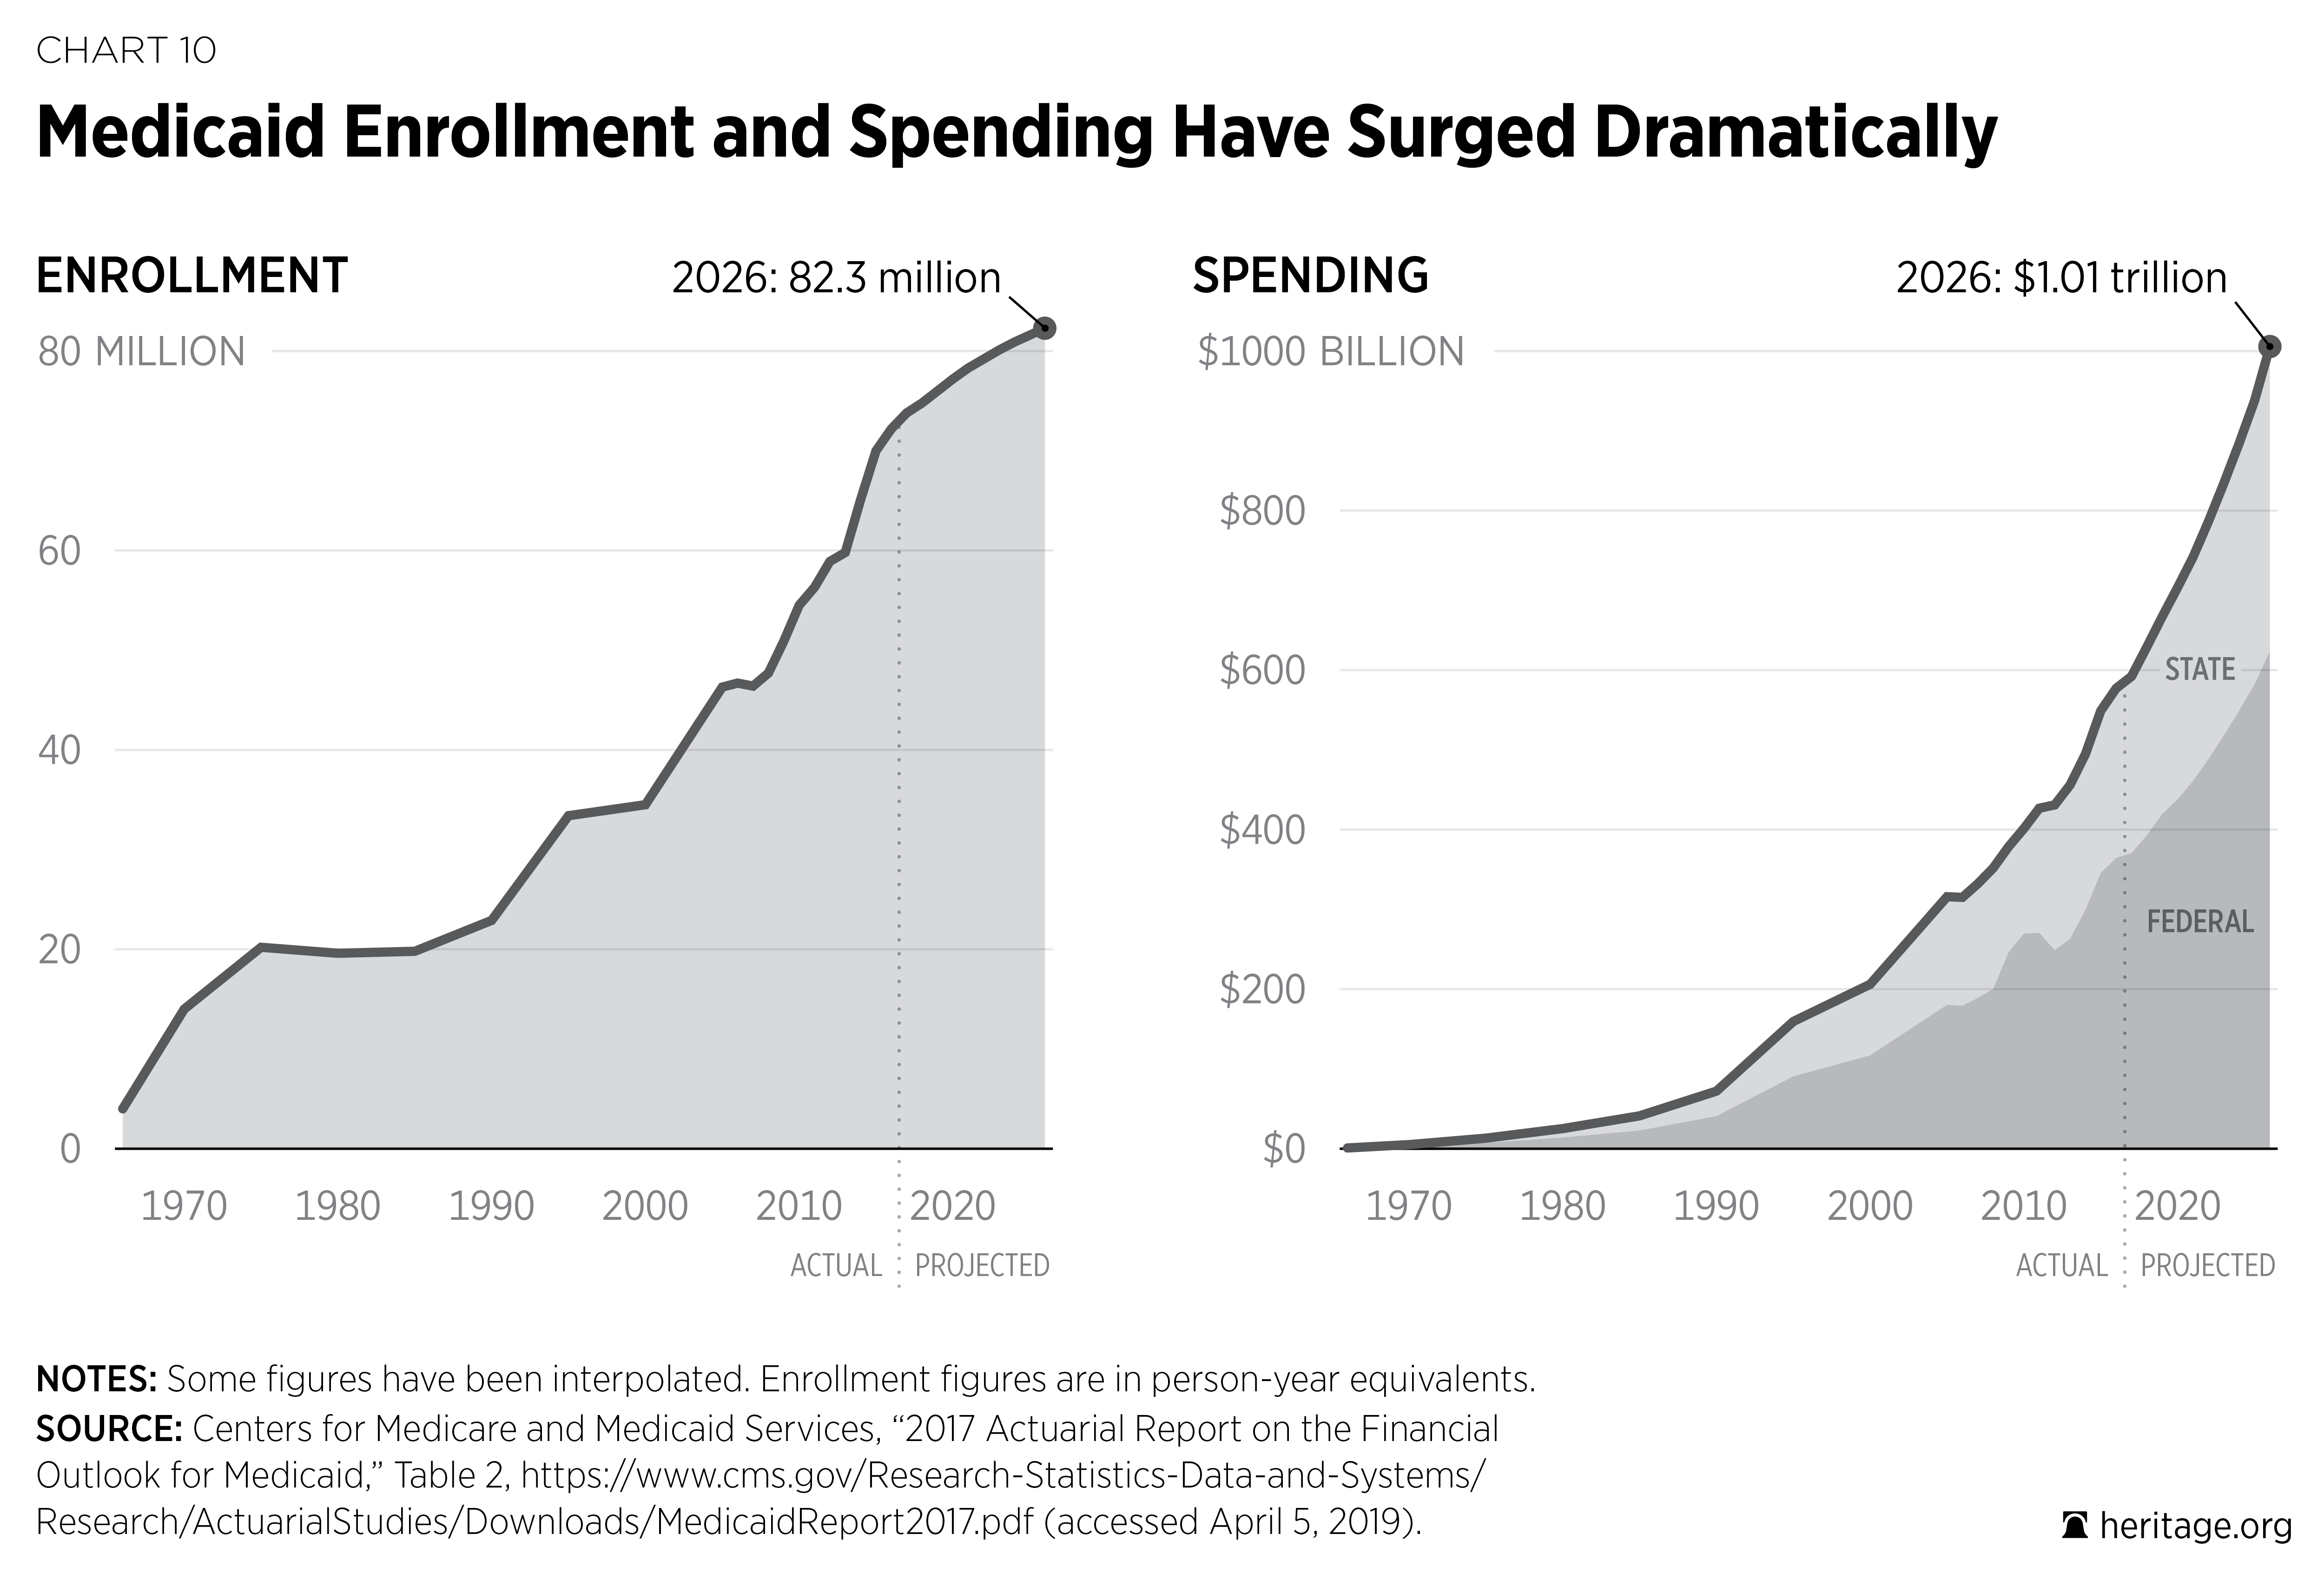
Enrollment has climbed steadily over the years, rising from 14 million people in 1970 to an estimated 74.8 million people in 2018.32 Costs for the Medicaid program also continue to skyrocket. Combined federal and state expenditures were $5.1 billion in 1970 (in inflation-adjusted dollars) and climbed to an estimated $629.3 billion in 2018.33 On a per-worker basis, that is a twentyfold increase in the cost of financing the program, from $178 per worker in 1970 to $3,698 per worker in 2018.
The Medicaid program is stretched too thin. Today, being enrolled in Medicaid does not guarantee that beneficiaries will receive the care that they need. In fact, Medicaid has a poor record with respect to quality and access in many states,34 and enrollees continue to have difficulty finding doctors who will accept Medicaid.35 Without reform, beneficiary access issues will likely grow more acute as the program expands and costs continue to grow.
Moreover, the Government Accountability Office (GAO) has listed Medicaid as one of the government’s “High-Risk” programs in need of stronger oversight,36 and the Department of Health and Human Services Office of Inspector General estimates that “improper payments” in the Medicaid program totaled $59 billion in 2017.37
Such trends in Medicaid are unsustainable for federal and state taxpayers. The CBO projects that Medicaid outlays will grow from 1.9 percent of GDP in 2018 to 2.3 percent of GDP by 2029,38 enrollment will reach 82.3 million by 2026, and expenditures will exceed $1 trillion by 2026.39 It is time for Congress to restore the Medicaid safety net and put in place a more predictable and transparent budget.
Proposed Medicaid Reforms. Changing these trends will require bold action. The current open-ended financing structure encourages states to maximize federal matching funds by expanding the size and scope of the program and shifting the cost to federal taxpayers whenever possible. Therefore, first and foremost, policymakers should:
- Put federal Medicaid on a more fiscally predictable budget by basing the financing of the program on eligibility groups, and allow additional administrative flexibility for the states. This reform would enable the program to meet the diverse needs of each group more effectively.40
Medicaid Reform: Better Targeting of Assistance to Those in Need. The challenges facing Medicaid threaten the future of the program for Millions of low-income Americans who are in need. Reform is needed to help ensure that Medicaid does not drift further from its core mission, remains committed to preserving a safety net for those in need, and protects taxpayers from runaway spending.
Reforming the financing of Medicaid is the first and most critical step. Restructuring the program’s open-ended federal financing so that financing is based on eligibility groups will help to stop the perverse incentives fueling expansion and spending and instead give states a predictable budget with the administrative flexibility and financial incentive to target resources more effectively to meet the unique needs of each eligibility group.
Medicaid reform should support independence, not dependence. Reform should assist those who are able to transition out of the program and into the private health insurance market where the vast majority of Americans obtain their coverage. Similarly, for the disabled and elderly, reform should make the program more accountable to the patient by giving these individuals greater choice and control of the care and services that fit their individual needs.
Obamacare
Enacted in 2010, Obamacare put in place two new entitlements, a massive federal regulatory infrastructure, and a series of taxes and payment cuts intended to offset the new costs of the program. The Congressional Budget Office estimates that Obamacare’s Medicaid expansion and new insurance subsidies will cost taxpayers roughly $1.6 trillion from 2019 to 2028.41
The Obamacare subsidy scheme extends cost sharing and premium payments to insurers offering coverage through the Obamacare exchanges for individuals up to 400 percent of the federal poverty level (FPL). In May 2018, the Congressional Budget Office estimated that 8 million people would be subsidized in the exchanges at a federal cost of $49 billion in 2018 and that 6 million people will be subsidized at a cost of $81 billion by 2028.42
Despite new federal spending, Millions of people continue to face higher premiums. Between 2013 and 2017, according to Administration estimates, premiums increased by 105 percent.43 For many middle-class persons not eligible for the subsidy, such high-cost coverage is practically inaccessible. Obamacare has left both the subsidized and the unsubsidized with fewer coverage options. In 2013, before Obamacare, the number of insurers selling coverage in the individual health insurance markets was 395. In 2018, the number of insurers selling coverage in the exchange was 181.44 In 2017, nearly one-third of counties in the United States (32.8 percent) had only one insurer offering exchange coverage. In 2018, more than half (51.3 percent) of all counties faced that situation.45
Obamacare’s Medicaid expansion added a new eligibility group to the program. To entice the states to expand coverage to childless adults up to 138 percent of the FPL, Obamacare enhanced the federal match rate to 90 percent;46 37 states have added this new eligibility group to their programs.47 The CMS Office of the Actuary estimated that the expansion added 11.2 million people to the program in 2016 and accounted for $66.5 billion of its total costs.48 The number of expansion enrollees is projected to rise to 13.3 million by 2026 and to add $119.9 billion to Medicaid’s total costs.49 Adding new groups is accelerating the demographic, structural, and fiscal challenges facing an already overstretched Medicaid program.
Obamacare has resulted in Millions of people being pushed onto an already vulnerable Medicaid program in which costs and access remain real threats, and Millions more people face higher premiums and fewer choices in a shrinking insurance market. A change of course is needed.
Proposed Obamacare Changes. After nearly 10 years, health care premiums are rising, choices are declining, and the Obamacare entitlements are making the federal budget worse, not better. The first step in reform should be to:
- Repeal the Obamacare federal entitlement financing structure and replace it with a block grant to the states with new flexibility for the states and consumers.50 The proposal would repeal the mandatory federal insurance subsidies and the Medicaid expansion and replace them with a discretionary block grant to the states. In addition, the proposal would extend new regulatory flexibility to the states and guarantee individuals the option to choose a private health care arrangement of their choice. Independent analysis found that these changes could reduce premiums in the individual market by 32 percent.51
- Repeal the Affordable Care Act’s enhanced federal funding for Medicaid expansion, ending both the inequitable treatment among populations and the incentive for states to divert limited taxpayer resources from their most vulnerable populations.
Savings. The Heritage Foundation estimates that reducing the match rate for enrollees made eligible under Obamacare would reduce the federal deficit by $401 billion between 2020 and 2029.52
Obamacare Reforms: Bringing More Choices, Better Access, and Lower Costs. Obamacare has damaged the individual and small-employer health insurance markets, leaving Millions of Americans with higher premiums, less access, and fewer choices while providing insurers with open-ended taxpayer subsidies. At the same time, Obamacare’s Medicaid expansion provides states with much higher reimbursement for enrolling Millions of able-bodied, childless adults than they receive for the program’s historic safety-net role of funding care for the disabled and for poor children and their parents. A course correction is desperately needed.
Under a new framework, Americans would have more choices, better access, and lower costs. Instead of being forced into a one-size-fits-all federal government model, Americans would have access to a broader and more affordable set of coverage options that are less costly and restrictive than today’s. States would have the ability to develop new approaches for targeting and prioritizing those who most need assistance in their states and in ways that protect those with pre-existing conditions. Finally, individuals and families who need assistance would have the final say as to where to get their health care.
Equally as important, this new framework would protect taxpayers from runaway costs by removing the incentives that distort the individual market and Medicaid program and by curtailing open-ended federal subsidies and instead shifting those resources in a fiscally responsible way to the states.
The Need to Act Now
Every year that policymakers fail to address rising entitlement program shortfalls, the more expensive it becomes to resolve their deficits. The costs of America’s entitlement programs expand every day. The longer Congress waits to enact changes, the more costly those changes will need to be. The sooner lawmakers adopt entitlement reforms, the lower the costs on each individual and family will be as unfunded liabilities are reduced for younger and yet unborn generations.
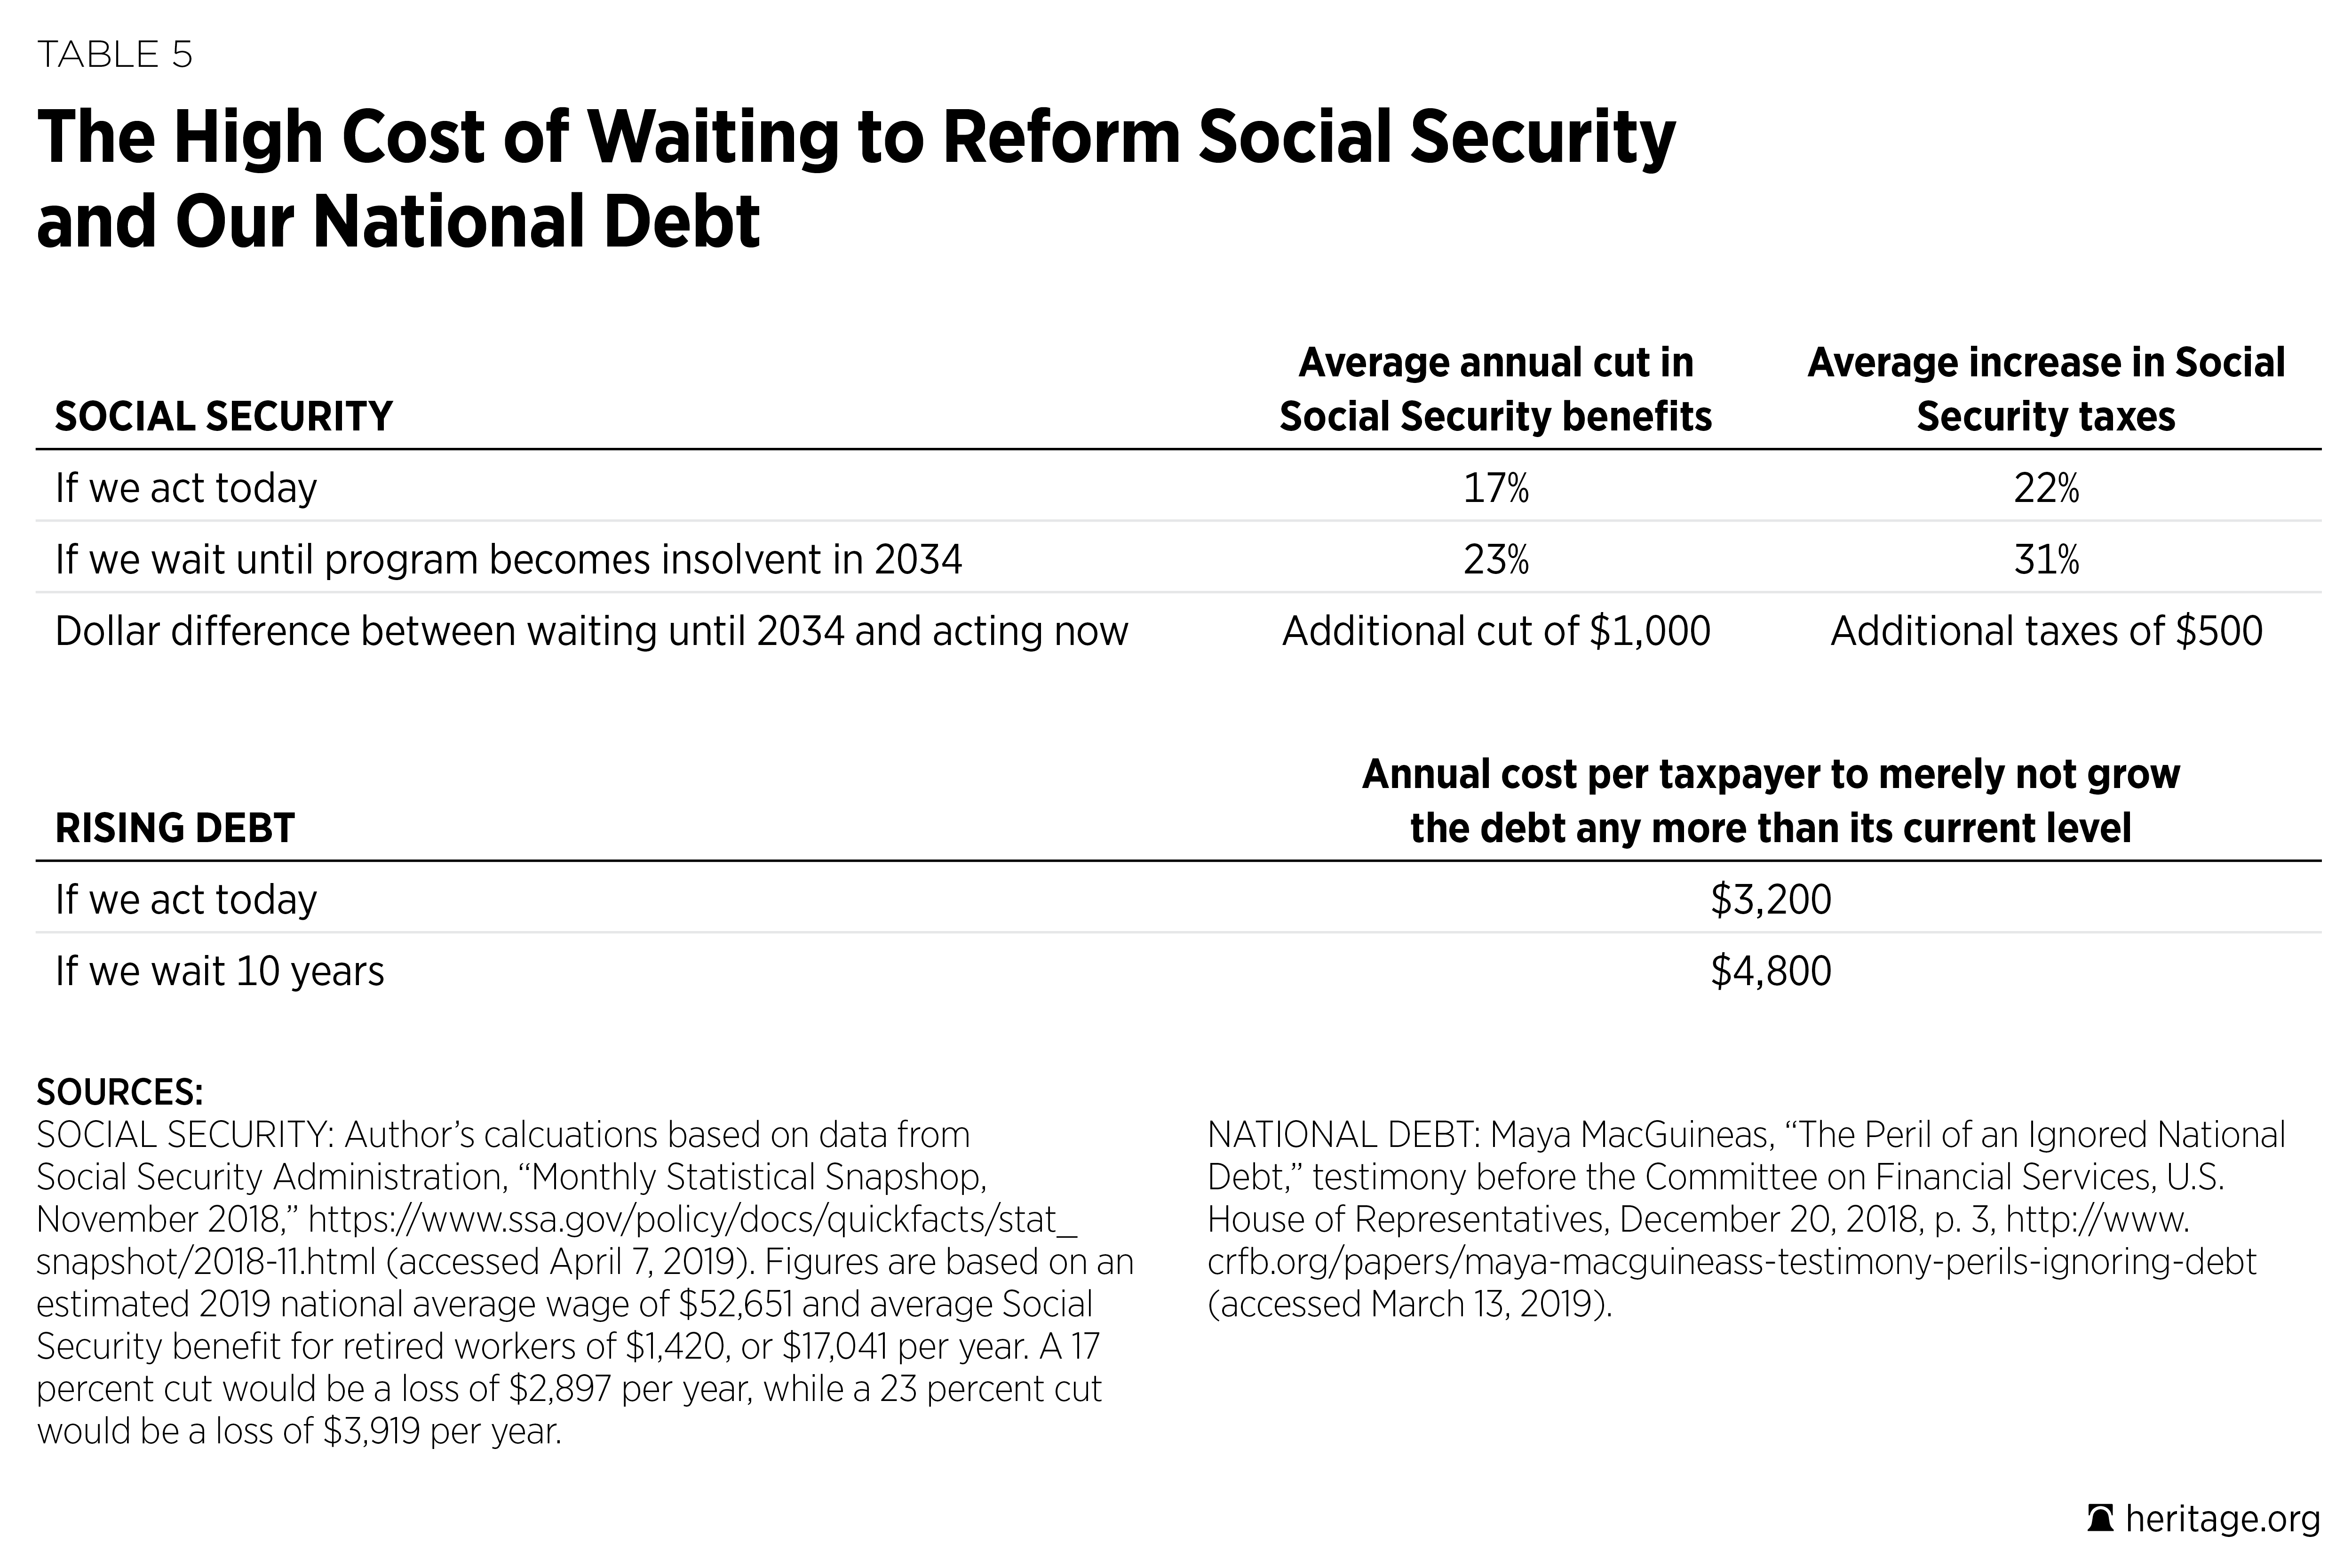
Take Social Security, for example. If lawmakers acted today, they could make the program solvent through either a 17 percent across-the-board benefit cut or a 22 percent across-the-board payroll tax increase. If lawmakers wait until 2034 when the program becomes insolvent, they will have to cut benefits by 23 percent or raise taxes by 31 percent. For the average retiree, waiting until 2034 would mean over $1,000 in additional benefit cuts each year, and for the average worker, waiting until 2034 would result in over $500 more per year in added tax increases (more than $20,000 over a 40-year career).53 And that is just Social Security, which represents just under 40 percent of all entitlement spending.54
When addressing policymakers about confronting our country’s unsustainable debt, Committee for a Responsible Federal Budget President Maya MacGuineas testified that if Congress waits just 10 years to change course, the size and cost of adjustments required will be 50 percent greater.55 For a seemingly modest goal of not increasing the nearly record-high U.S. debt level over the next 10 years, the annual cost per taxpayer would be $3,200 if policymakers enact reforms today and $4,800 per year if they wait 10 years to confront exploding government costs.
If Congress fails to put America’s entitlement programs on track to financial balance, it will increase the risk that Americans will face severe Greece-like austerity measures. If policymakers wait too long, they will not have the luxury of enacting thoughtful and common-sense reforms or choosing between tax increases and benefit cuts; instead, they will have to enact harsh, across-the-board tax increases and benefit cuts.
Summary
Out-of-control federal spending is one of the greatest threats to America, and excessive growth in entitlement spending is the leading cause of this threat. If we want our economy to grow and future generations to be as well off or better off than current and past ones, America simply cannot afford to spend half of the average worker’s paycheck on federal benefits for every retiree. Nor will taxpayers be able to cover the projected growth in federal health care spending without excessive tax burdens. Attempting to maintain current entitlement spending through tax increases will cripple economic growth, and tacking all of the excess costs to the nation’s mounting debt will quickly lead to a financial crisis and severe fiscal austerity.
The outlook for a young worker just graduating from college and entering the workforce will vary drastically, depending on how Congress confronts our nation’s growing entitlement crisis. Acting now to curb excessive entitlement spending would save the average American household thousands of dollars per year and hundreds of thousands of dollars over a lifetime.
America’s entitlement programs have value as social safety nets, but they have grown far beyond that purpose and provide excess benefits to individuals who are fully capable of providing for their own health care and retirement needs. This excess growth has caused retirees and lower-income and middle-income workers to become reliant on the federal government to meet their needs as the growth of entitlement costs accelerates.
Today’s entitlement programs leave workers without control while limiting their choices as federal programs tend to provide one-size-fits-all benefits that do not meet each worker’s and retiree’s needs. Congress should reduce the size and scope of federal entitlement programs, with an emphasis on protecting the most vulnerable, and give individuals greater control and ownership of their health care and financial well-being.
Endnotes
- Estimate based on Social Security and Medicare Trustees’ reported 75-year unfunded liabilities of $16.1 trillion for Social Security and $53.7 trillion for Medicare as well as the Bureau of Labor Statistics’ reported employment level of 156,945,000 workers for December 2018. See 2018 Annual Report of the Boards of Trustees of the Federal Hospital Insurance and Federal Supplementary Medical Insurance Trust Funds, Communication from the Boards of Trustees, Federal Hospital Insurance and Federal Supplementary Medical Insurance Trust Funds, Transmitting the 2018 Annual Report of the Boards of Trustees of the Federal Hospital Insurance and Federal Supplementary Medical Insurance Trust Funds, June 5, 2018, https://www.cms.gov/Research-Statistics-Data-and-Systems/Statistics-Trends-and-Reports/ReportsTrustFunds/Downloads/TR2018.pdf (accessed March 12, 2019), and Economic News Release, “Table A-1. Employment Status of the Civilian Population by Sex and Age,” U.S. Department of Labor, Bureau of Labor Statistics, last modified March 8, 2019, https://www.bls.gov/news.release/empsit.t01.htm (accessed March 12, 2019).
- These estimates are in present-value 2018 dollars and assume that workers’ payroll taxes earned a real interest rate of 2 percent per year. Eugene Steuerle and Caleb Quakenbush, “Social Security and Medicare Lifetime Benefits and Taxes: 2018 Update,” Urban Institute, October 2018, https://www.urban.org/sites/default/files/publication/99232/social_security_and_medicare_lifetime_benefits_and_taxes_2018_update.pdf (accessed March 12, 2019).
- USGovernmentSpending.com, “Government Spending Chart: Various Items, Fiscal Years, 1900 to 2020,” https://www.usgovernmentspending.com/spending_chart_1900_2020USp_20s2li011tcn_02f10t40t (accessed March 17, 2019) and The 2018 Annual Report of the Board of Trustees of the Federal Old-Age and Survivors Insurance and Federal Disability Insurance Trust Funds. Figures for today are based on 2019 projections.
- Adam Bee and Joshua Mitchell, “Do Older Americans Have More Income Than We Think?” U.S. Department of Commerce, U.S. Census Bureau, Social, Economics, and Housing Statistics Division Working Paper No. 2017-39, July 2017, https://www.census.gov/content/dam/Census/library/working-papers/2017/demo/SEHSD-WP2017-39.pdf (accessed March 25, 2019). Note that this study links CPS and IRS data to provide a more accurate data source than typical survey-based measures, which tend to show that individuals rely more on Social Security for retirement income than matched data that reveal their actual IRS tax filings.
- Table 11, “Monthly Payments for Males Born in Florida in 1995,” in Kevin Dayaratna, Rachel Greszler, and Patrick Tyrrell, “Is Social Security Worth Its Cost?” Heritage Foundation Backgrounder No. 3324, July 10, 2018, p. 15, https://www.heritage.org/sites/default/files/2018-07/BG3324_0.pdf. Social Security will provide an estimated $2,209 monthly payment (in current dollars), while private savings could provide a $6,185 annuity, or $47,712 more per year.
- Table 12, “Monthly Payments for Females Born in Florida in 1995,” in Dayaratna, Greszler, and Tyrell, “Is Social Security Worth Its Cost?” p. 15.
- Table II.D2, “Reasons for Change in the 75-Year Actuarial Balance, Based on Intermediate Assumptions [As a Percentage of Taxable Payroll],” in The 2018 Annual Report of the Board of Trustees of the Federal Old-Age and Survivors Insurance and Federal Disability Insurance Trust Funds, Communication from the Board of Trustees, Federal Old-Age and Survivors Insurance and Federal Disability Insurance Trust Funds, Transmitting the 2018 Annual Report of the Board of Trustees of the Federal Old-Age and Survivors Insurance and Federal Disability Insurance Trust Funds, June 5, 2018, p. 21, https://www.ssa.gov/oact/tr/2018/tr2018.pdf (accessed March 25, 2019). The actuarial deficit was 2.63 percent of payroll for the OASI program and 0.21 percent of payroll for the SSDI program.
- Table 10, “Period Life Expectancies at Selected Exact Ages, by Sex and Calendar Year,” in Felicitie C. Bell and Michael L. Miller, Life Tables for the United States Social Security Area: 1900–2100, Social Security Administration, Office of the Chief Actuary, Actuarial Study No. 120, August 2005, pp. 162–166, https://www.ssa.gov/oact/NOTES/pdf_studies/study120.pdf (accessed March 13, 2019).
- Ibid.
- The 2018 Annual Report of the Board of Trustees of the Federal Old-Age and Survivors Insurance and Federal Disability Insurance Trust Funds. Figures for today are based on 2019 projections.
- Projected spending for 2019 includes $894 billion for Social Security’s retirement program and $664 billion for defense. Table 3-1, “CBO’s Baseline Projections of Outlays,” and Table 3-2, “CBO’s Baseline Projections of Mandatory Outlays, Adjusted to Exclude the Effects of Timing Shifts,” in Congressional Budget Office, The Budget and Economic Outlook: 2019 to 2029, January 2019, pp. 62–63 and 68–69, https://www.cbo.gov/system/files?file=2019-01/54918-Outlook.pdf (accessed March 25, 2019).
- This proposal would not affect anyone age 57 or older. For others, it would increase the normal retirement age by two months per year until reaching age 70 and would then index the age based on changes in life expectancy.
- Our proposed shift to a flat, antipoverty benefit would not affect workers who are 60 years old or older in 2019. We suggest gradually reducing the replacement rates in Social Security’s AIME by 0.5 percentage points per year on the 32 percent and 15 percent replacement rates and increasing the lower 90 percent replacement rate by 1 percent per year until it reaches 112 percent. Full implementation would not be realized until 2058 when workers who are 28 in 2019 would reach Social Security’s current normal retirement age of 67.
- Estimated savings for individual proposals as well as the total, interactive savings come from The Heritage Foundation’s Social Security Model, based on the most recent data from The 2018 Annual Report of the Board of Trustees of the Federal Old-Age and Survivors Insurance and Federal Disability Insurance Trust Funds. Estimates depend on formulaic changes in benefit levels and eligibility for benefits.
- Dayaratna, Greszler, and Tyrrell, “Is Social Security Worth Its Cost?”
- Congressional Budget Office, Social Security Disability Insurance: Participation and Spending, June 2016, pp. 1 and 6, https://www.cbo.gov/sites/default/files/114th-congress-2015-2016/reports/51443-ssdiparticipationspending.pdf (accessed March 17, 2019).
- Ibid., pp. 1 and 9. Figures reported in 2015 dollars.
- Ibid., p. 1.
- According to CRS reports, there were 1,400,601 uniformed military personnel in 2018, and average compensation was $100,000–$110,000 per year, for a total of $147 billion. See Table 3, “Total Federal Employment,” in Julie Jennings and Jared C. Nagel, “Federal Workforce Statistics Sources,” Congressional Research Service Report for Members and Committees of Congress, January 12, 2018, p. 6, https://fas.org/sgp/crs/misc/R43590.pdf (accessed March 17, 2019), and Lawrence Kapp and Barbara Salazar Torreon, “Military Pay: Key Questions and Answers,” Congressional Research Service Report for Members and Committees of Congress, May 8, 2018, Summary, https://fas.org/sgp/crs/natsec/RL33446.pdf (accessed March 17, 2019). The CBO projects total SSDI spending of $145 billion in FY 2019. Table 3-2, “CBO’s Baseline Projections of Mandatory Outlays, Adjusted to Exclude the Effects of Timing Shifts,” in Congressional Budget Office, The Budget and Economic Outlook: 2019 to 2029, p. 68.
- The 2018 Annual Report of the Board of Trustees of the Federal Old-Age and Survivors Insurance and Federal Disability Insurance Trust Funds. The actuarial deficit for the SSDI program is 0.21 percent of payroll.
- Estimated savings for individual proposals as well as the total, interactive savings come from The Heritage Foundation’s Social Security Model, based on the most recent data from The 2018 Annual Report of the Board of Trustees of the Federal Old-Age and Survivors Insurance and Federal Disability Insurance Trust Funds. Estimated savings for most proposals depend on assumptions about changes in the number of individuals who would apply for and ultimately receive benefits from the SSDI program.
- Table 3-1, “CBO’s Baseline Projections of Outlays,” in Congressional Budget Office, The Budget and Economic Outlook: 2019 to 2029, p. 62.
- Authors’ estimates based on the January 2019 seasonally adjusted employment level of 156.949 million workers and the CBO’s projected monthly gains in employment through 2029 as reported in Table 2-3, “CBO’s Economic Projections for Calendar Years 2019 to 2029,” in Congressional Budget Office, The Budget and Economic Outlook: 2019 to 2029, p. 30. Medicare spending minus premiums and interest is $653 billion in 2019 and $1.297 billion in 2028 (85 percent of projected total spending levels). The average individual health insurance premium in 2019 was $6,896 according to Henry J. Kaiser Family Foundation, “Employer Health Benefits: 2018 Summary of Findings,” http://files.kff.org/attachment/Summary-of-Findings-Employer-Health-Benefits-2018 (accessed March 13, 2019).
- Susan Codespote, U.S. Department of Health and Human Services, Centers for Medicare and Medicaid Services, Office of the Actuary, “Memo on the Unfunded Obligations of the Medicare Program” provided to the staff of the Committee on the Budget, U.S. Senate, June 5, 2018, p. 1. For a more extensive discussion, see Robert E. Moffit, “Medicare: How Timely Reforms Can Prevent Painful Consequences,” Heritage Foundation Backgrounder No. 3336, August 1, 2018, p. 4, https://www.heritage.org/sites/default/files/2018-08/BG3336_0.pdf.
- The Heritage Foundation adjusted CBO-modeled savings estimates to extend the budgetary window by one year. See Congressional Budget Office, Options for Reducing the Deficit: 2019 to 2028, December 2018, p. 61, https://www.cbo.gov/system/files?file=2018-12/54667-budgetoptions.pdf (accessed March 13, 2019).
- Ibid., p. 65.
- Estimated savings are based on estimates from Heritage Foundation staff using the Heritage Center for Data Analysis Health Model.
- The Heritage Foundation adjusted CBO-modeled savings estimates to extend the budgetary window by one year. See Congressional Budget Office, Options for Reducing the Deficit: 2019 to 2028, p. 68.
- Estimated savings are based on estimates from Heritage Foundation staff using the Heritage Center for Data Analysis Health Model.
- The Heritage Foundation adjusted CBO-modeled savings estimates to shift the timing of policy implementation by two years. See Congressional Budget Office, A Premium Support System for Medicare: Updated Analysis of Illustrative Options, October 2017, p. 1, https://www.cbo.gov/system/files?file=115th-congress-2017-2018/reports/53077-premiumsupport.pdf (accessed March 13, 2019).
- Additional savings would be expected if changes are coupled with a transition to a Medicare premium-support system. The Heritage Foundation adjusted CBO-modeled savings estimates to shift the timing of policy implementation by two years, based on estimates from Heritage Foundation staff using the Heritage Center for Data Analysis Health Model and CBO-modeled savings estimates.
- U.S. Department of Health and Human Services, Centers for Medicare and Medicaid Services, Office of the Actuary, 2017 Actuarial Report on the Financial Outlook for Medicaid, p. 12, https://www.cms.gov/Research-Statistics-Data-and-Systems/Research/ActuarialStudies/Downloads/MedicaidReport2017.pdf (accessed March 13, 2019). It is estimated that in 2016, 11.2 million enrollments were a result of the ACA’s Medicaid expansion to childless adults. Ibid., p. 19.
- Ibid., p. 12.
- Kevin D. Dayaratna. “Studies Show: Medicaid Patients Have Worse Access and Outcomes than the Privately Insured,” Heritage Foundation Backgrounder No. 2740, November 7, 2012, http://static.heritage.org/2012/pdf/bg2740.pdf.
- Medicaid and CHIP Payment and Access Commission, Report to Congress on Medicaid and CHIP, March 2017, p. 134, https://www.macpac.gov/wp-content/uploads/2017/03/March-2017-Report-to-Congress-on-Medicaid-and-CHIP.pdf (accessed March 17, 2019).
- U.S. Government Accountability Office, High-Risk Series: Progress on Many High-Risk Areas, While Substantial Efforts Needed on Others, GAO 17-317, February 2017, https://www.gao.gov/assets/690/682765.pdf (accessed March 17, 2019).
- Brian P. Ritchie, Assistant Inspector General for Audit Services, Office of Inspector General, U.S. Department of Health and Human Services, “Medicaid Fraud and Overpayments: Problems and Solutions,” testimony before the Committee on Homeland Security and Governmental Affairs, U.S. Senate, June 27, 2018, p. 1, https://oig.hhs.gov/testimony/docs/2018/ritchie-testimony062018.pdf (accessed March 13, 2019).
- Congressional Budget Office, The Budget and Economic Outlook: 2019 to 2029, p. 63.
- Ibid. The federal share is expected to average 62 percent.
- For a discussion, see Edmund F. Haislmaier, Robert E. Moffit, Nina Owcharenko, and Alyene Senger, “A Fresh Start for Health Care Reform,” Heritage Foundation Backgrounder No. 2970, October 30, 2014, http://static.heritage.org/2014/pdf/BG2970.pdf.
- $842 billion in subsidies for Obamacare Medicaid expansion and $760 billion in subsidies for non-group market coverage. Congressional Budget Office, Federal Subsidies for Health Insurance Coverage for People Under Age 65: 2018 to 2028, May 2018, p. 16, https://www.cbo.gov/system/files/115th-congress-2017-2018/reports/53826-healthinsurancecoverage.pdf (accessed March 25, 2019). See also Table 2, “Net Federal Subsidies Associated with Health Insurance Coverage for People Under Age 65,” in ibid., p. 18.
- Table 1, “Health Insurance Coverage for People Under Age 65,” in ibid., p. 4.
- U.S. Department of Health and Human Services, Office of the Assistant Secretary for Planning and Evaluation, “Individual Market Premium Changes: 2013–2017,” ASPE Data Point, May 23, 2017, https://aspe.hhs.gov/system/files/pdf/256751/IndividualMarketPremiumChanges.pdf (accessed March 17, 2019).
- Edmund F. Haislmaier, “2018 Obamacare Health Insurance Exchanges: Competition and Choice Continue to Shrink,” Heritage Foundation Issue Brief No. 4813, January 25, 2018, https://www.heritage.org/sites/default/files/2018-01/IB4813_1.pdf.
- Ibid.
- Under the ACA, the federal government financed 100 percent of the costs of the expansion populations from 2014–2016. The federal contribution phases down to 90 percent by 2020.
- Henry J. Kaiser Family Foundation, “Status of State Medicaid Expansion Decisions: Interactive Map, Status of State Action on the Medicaid Expansion Decision,” February 13, 2019, https://www.kff.org/medicaid/issue-brief/status-of-state-medicaid-expansion-decisions-interactive-map/ (accessed March 17, 2019).
- U.S. Department of Health and Human Services, Centers for Medicare and Medicaid Services, Office of the Actuary, 2017 Actuarial Report on the Financial Outlook for Medicaid, p. 19.
- Ibid.
- For a discussion of this proposal, see Edmund F. Haislmaier, Robert E. Moffit, and Nina Owcharenko Schaefer, “The Health Care Choices Proposal: Charting a New Path to a Down Payment on Patient-Centered, Consumer-Driven Health Care Reform,” Heritage Foundation Backgrounder No. 3330, July 11, 2018, https://www.heritage.org/sites/default/files/2018-07/BG3330_0.pdf.
- Center for Health and the Economy, “The Health Care Choices Proposal,” October 3, 2018, https://healthandeconomy.org/the-health-care-choices-proposal/ (accessed March 24, 2019).
- The Heritage Foundation adjusted CBO-modeled savings estimates to extend the budgetary window by one year. See Congressional Budget Office, Options for Reducing the Deficit: 2019 to 2028, p. 55.
- In November 2018, the average Social Security benefit for retired workers was $1,420, or $17,041 per year. A 17 percent cut would amount to $2,897 per year, and a 23 percent cut would equal $3,919 per year. Social Security Administration, Research, Statistics & Policy Analysis, “Monthly Statistical Snapshot: November 2018,” https://www.ssa.gov/policy/docs/quickfacts/stat_snapshot/2018-11.html (accessed March 13, 2019). In 2017, the National Average Wage Index (NAWI) was $50,322. To arrive at a 2019 NAWI estimate of $52,651, the authors increased the 2017 figure by 4.6 percent (based on the Social Security’s change in bend point figures between 2017 and 2019).
- According to the CBO’s most recent budget projections, Social Security will account for $894 billion out of a total of $2.289 trillion in entitlement program spending (including Social Security, disability insurance, Medicare, Medicaid, and health insurance subsidies) in 2019. Table 3-2, “CBO’s Baseline Projections of Mandatory Outlays, Adjusted to Exclude the Effects of Timing Shifts,” in Congressional Budget Office, The Budget and Economic Outlook: 2019 to 2029, p. 68.
- Maya MacGuineas, “The Peril of an Ignored National Debt,” testimony before the Committee on Financial Services, U.S. House of Representatives, December 20, 2018, p. 3, http://www.crfb.org/papers/maya-macguineass-testimony-perils-ignoring-debt (accessed March 13, 2019).