Recently, there has been a seemingly endless stream of stories regarding the farm economyREF—a picture of how farms are doing financially.REF The stories usually paint a bleak picture and are often used to make the case for more taxpayer-funded handouts (including trade aid) to farmers.
The reality of the farm economy is much different than what is being portrayed. In general, the current farm economy stacks up well against historical measures. As with any year, this does not mean that all farmers are doing well.
This Issue Brief lays out important farm-economy data to help provide proper context and background on the actual condition of the farm economy. It is a snapshot of current conditions. As legislators make policy decisions regarding agriculture, they should at least have a clear and truthful picture to guide them.
Net Farm Income and Government Payments
One commonly used measure of the farm economy is net farm income. As defined by the U.S. Department of Agriculture (USDA), this measure “reflects income after expenses from production in the current year” and “is calculated by subtracting farm expenses from gross farm income.”REF
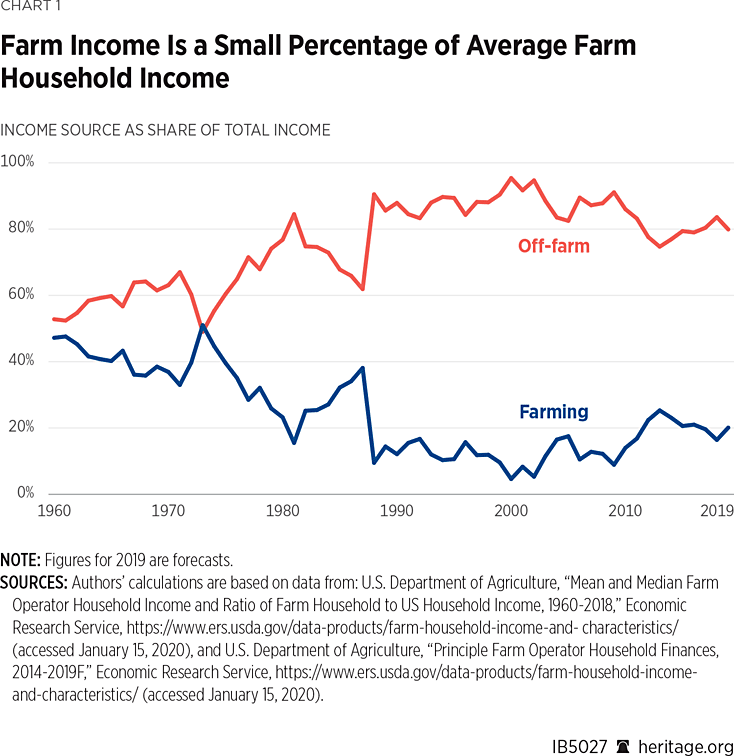
There are some important clarifications to make about net farm income. It does not refer to the net income of farmers; instead, it is a measure of net income from farming. This distinction may seem trivial, but it is critical because most farmers receive a small percentage of their household income from farming. In fact, over the past few years, on average, only about 20 percent of farm household income comes from farming, while 80 percent of farm household income comes from off-farm sources. (See Chart 1 for historical data showing how farm income has become a much smaller percentage of average farm household income.)REF
To provide further context, it is important to recognize that the USDA has a very generous definition of what it means to be a farm: A farm is “any place that produced and sold—or normally would have produced and sold—at least $1,000 of agricultural products during a given year.”REF Based on the latest Census of Agriculture (2017), 56 percent of farms in the United States had less than $10,000 in sales.REF In effect, about half of all farms are what most people would consider to be hobby farms. Further, 76 percent of U.S. farms had sales less than $50,000; these farms accounted for only 3 percent of agricultural product sales.REF
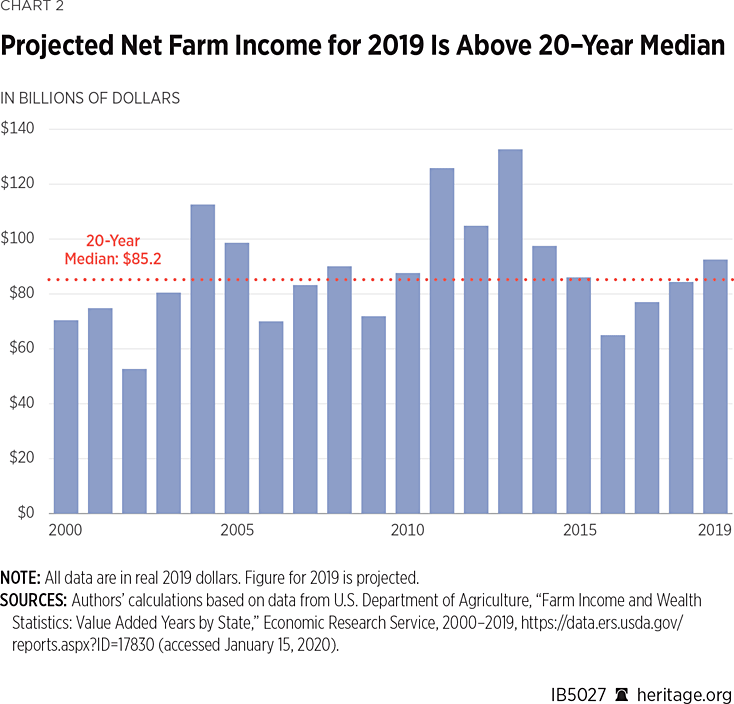
Net farm income is projected to be $92.5 billion for 2019.REF This total is above the 20-year median of $85.2 billion.REF As Chart 2 shows, 2013 was a particularly high year for net farm income. In fact, in nominal terms, it was a record yearREF and a near-record high in real terms (2019 dollars).REF There is frequent cherry-picking with net farm income data. For instance, frequent reports on net farm income make reference to how current net farm income compares unfavorably to this extremely high year—to make any new number sound low.REF
Federal Payments as a Percent of Net Farm Income
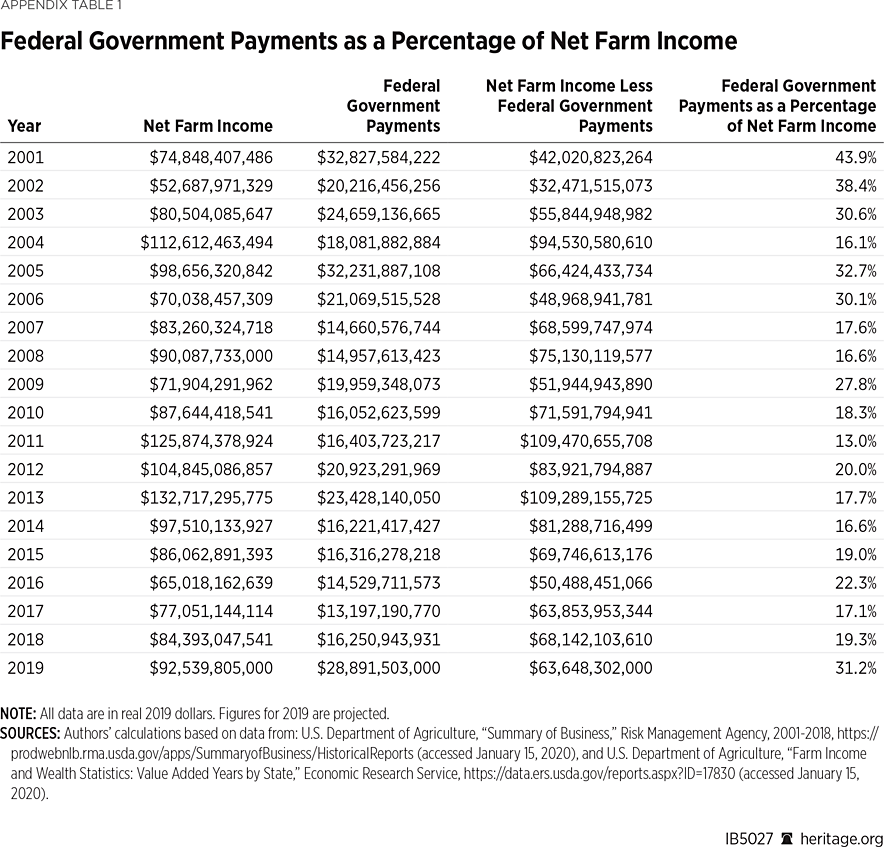
There has been a recent focus on the large percentage of projected net farm income in 2019 made up of federal government payments.REF This number can be used to demonstrate that net farm income is not as good as it seems. Ironically, a counter-narrative uses this number to show how out-of-hand farm subsidies have become for farmers.
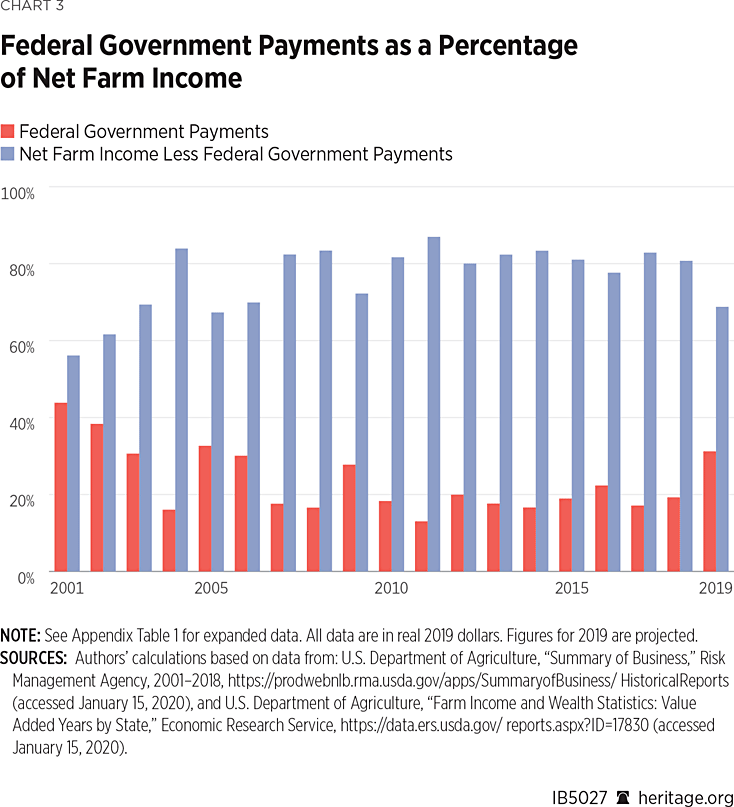
As shown in Chart 3, the projected data for 2019 does show a significant percentage (31 percent)REF of government payments accounting for part of net farm income (about $14 billion comes from trade aid).REF When looking at the past 19 years (the years for which data are available), it is one of the higher percentages, but it is not particularly unusual. In fact, in 2001, 2002, and 2005, federal payments accounted for a greater percentage of net farm income.REF
This fact does not mean that the scope of government payments in 2019 is appropriate. It is excessive, but so too is the amount of farm handouts in general. Agricultural producers are more than capable of managing agricultural risk without taxpayer assistance; this is especially true for handouts that insulate farmers from competing in the marketplace.
Farm Household Income and Wealth
The myth of the struggling farmer is a constant narrative that continues to this day. However, this is not the 1940s, when farm household income was on average half that of non-farmers.REF
Farm households have much greater income and wealth than non-farm households. In 2018, median farm household income was 15 percent greater than median non-farm household income, and median farm household wealth was a staggering 8.7 times greater than median non-farm household wealth.REF
Financial Ratios
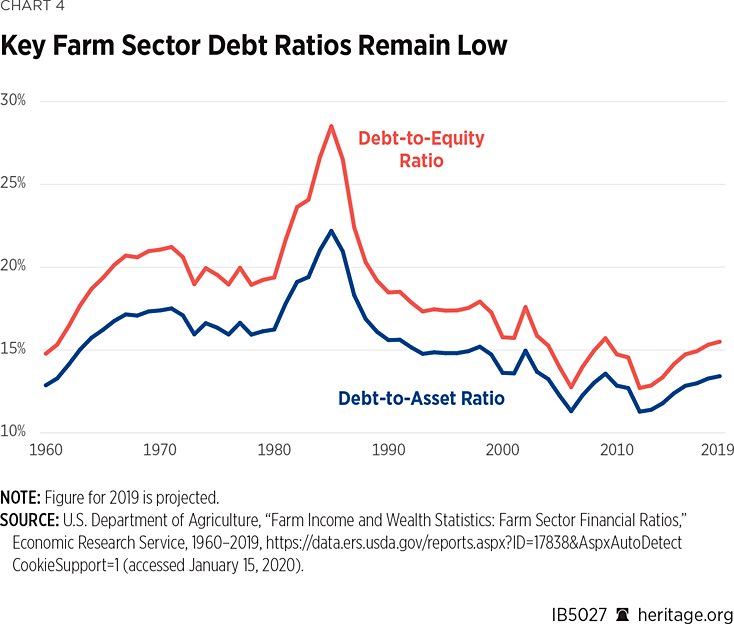
Two extremely important measures of the financial health of farms are the debt-to-asset and debt-to-equity ratios (comparisons of debt to assets and equity).REF These measures help to indicate the solvency of the farms; the higher the ratios, the greater the financial vulnerability. As shown in Chart 4, the ratios remain extremely low and are projected for 2019 to be 13.4 percent and 15.5 percent respectively.REF
The University of Minnesota’s Center for Farm Financial Management has helpful information to evaluate financial ratios in agriculture. A strong debt-to-asset ratio is less than 30 percent, and a strong debt-to-equity ratio is less than 43 percent.REF As Chart 4 shows, the ratios have not come close to exceeding these levels over the entire 60 years examined.
Farm Bankruptcy Rates
To capture the bankruptcy rates of farms, the USDA utilizes the number of Chapter 12 filings per year.REF Chapter 12 is a special chapter of the Bankruptcy Code just for farmers, although they can use other chapters.
Farm bankruptcies are receiving media attention, yet, as explained by Robert Johansson, the USDA’s Chief Economist, “[n]ationally the rate of bankruptcy per 10,000 farms remains low—sitting at approximately 2.35 bankruptcies per 10,000 farms [in 2018], lower than the 3 bankruptcies we saw in [the] 2010–2012 period.”REF As a percentage, the 2018 bankruptcy rate is just two one-hundredths of a percent.REF
Commodity Prices
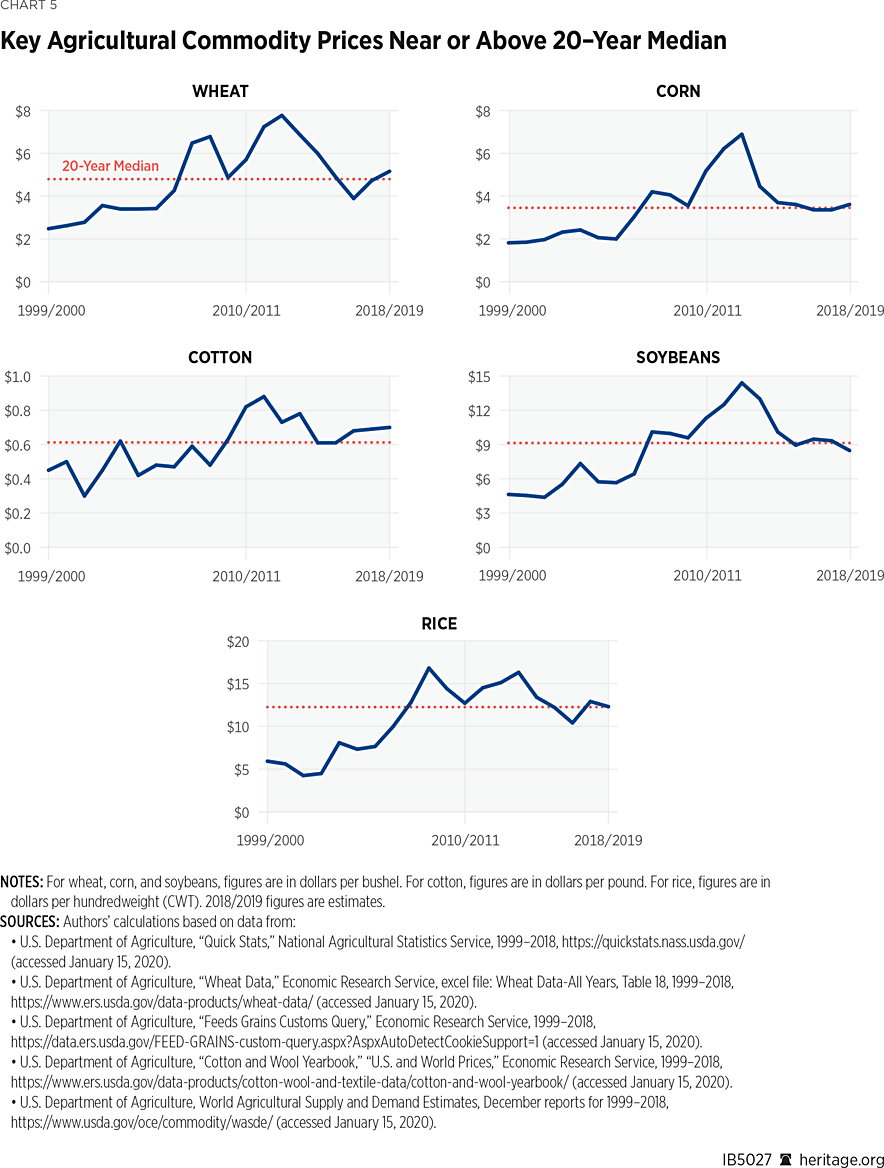
Another frequent concern expressed about the farm economy is low commodity prices. Chart 5 shows prices for five major commodities (corn, cotton, rice, soybeans, and wheat)REF over the past 20 years and compares those prices to the 20-year median price.REF As shown, the prices are not unusually low, and, in fact, they are all above the median price, except for soybean prices, which are slightly below the median.
Trade
There is arguably no issue in agriculture getting more attention than agricultural trade. Recent trade disputes, including the current trade fight with China, have rightfully garnered significant attention.
Yet the total agricultural export data currently does not show the level of harm that might be expected from the trade dispute with China. Total agricultural exports (based on fiscal year data) were $135.6 billion in 2019.REF While agricultural exports in 2019 were lower than the immediate years prior to the recent trade disputes—in both 2017 and 2018, exports were valued at around $144 billion—the value is comparable to 2016, when exports were $135.5 billion.REF
Still, total exports would almost certainly be higher if there was no trade dispute with China. This trade dispute has also clearly impacted the number of U.S. agricultural exports to China. These exports took a nosedive from $22.4 billion in 2017 to $16.3 billion in 2018, a 27 percentREF decline in just one year. From 2017 to 2019, agricultural exports to China have declined by almost 55 percent, from $22.4 billion to $10.1 billion, respectively.REF These drops have resulted in China falling from the largest agricultural export market for the United States in 2017 to the fourth-largest in 2019 (based on fiscal year data).REF Further, these numbers do not reflect the long-term damage that might be caused as a result of the dispute.
This negative impact on agricultural exports to China could be alleviated due to a recently announced agreement with China. On January 15, 2020, the United States and China signed a Phase One agreement,REF which included commitments from China to increase purchases of agricultural products.REF However, it is still unclear whether and to what extent there will be increased purchases.
Recommendations
When policymakers examine farm economy data, they should take a step back and recognize that federal government intervention is unjustified regardless of the state of the farm economy (i.e., the financial health of farms)—and certainly not when the farm economy is on par with historical measures, as it is now. Taxpayers should not be expected to simply help agricultural producers who are just not doing as well financially as they would prefer. After all, what other sectors of the economy expect regular taxpayer handouts when they are not making as much money as they would like?
The federal government does not need to insulate farmers from competing in the marketplace. For those farms that receive federal assistance to help when prices drop or that fail to meet revenue targets, they are as capable of competing as any other business without such assistance. While farm subsidies are not necessary in general, at most, federal intervention should be limited to situations when there are significant crop losses connected to disasters.
Also, as policymakers examine farm economy data, they should be mindful of the scare tactics and cherry picking that are often used to justify government intervention. For that matter, regardless of who is providing the data (those who want more or less government intervention), policymakers should ensure that the data they are being provided are presented with proper context so that an accurate picture of the health of farms can be ascertained.
Conclusion
Congress has a long history of providing handouts to agricultural producers when they clamor for assistance, even if the assistance is duplicative or there is little or no economic justification. Recently, there seems to be no limit to the federal handouts provided to agricultural producers (for example, multiple subsidy programs, disaster assistance, and trade aid). These decisions to provide this money to producers are often a function of legislators responding to claims made regarding the farm economy. Legislators who, unfortunately, think it is appropriate to provide money to farmers in response to the farm economy,REF should at least ensure that they have an accurate assessment of existing conditions. Taxpayers, consumers, and farmers deserve nothing less.
Daren Bakst is Senior Research Fellow in Agricultural Policy in the Thomas A. Roe Institute for Economic Policy Studies, of the Institute for Economic Freedom, at The Heritage Foundation. Gabriella Beaumont-Smith is Policy Analyst for Macroeconomics in the Center for Data Analysis, of the Institute for Economic Freedom.
