Abstract: The Bipartisan Tax Fairness and Simplification Act of 2010 would simplify the convoluted tax code and lower tax brackets for most Americans. Sponsored in the Senate by Democrat Ron Wyden of Oregon and Republican Judd Gregg of New Hampshire, this tax reform proposal would free productive resources to be reinvested and spur the economy, create 2.3 million more jobs per year, and significantly reduce public debt. A lower corporate tax rate would serve as an incentive both to keep domestic businesses in the U.S. and to attract foreign businesses to America. Higher taxes, as planned under current law, merely serve as an anti-competitive force and a drain on the economy. A financially sound business sector, on the other hand, contributes to the stability of household wealth and the economy overall—benefiting all Americans.
The Bipartisan Tax Fairness and Simplification Act of 2010, introduced by Senators Ron Wyden (D–OR) and Judd Gregg (R–NH), offers simpler rules and lower tax rates than are found in the current system. Most taxpayers would see significantly lower tax rates under the Wyden–Gregg bill than under current law, particularly starting in 2011 when many taxpayers are currently scheduled for a large tax hike.
The combination of simplification and lower rates also decreases the deadweight cost[1] of taxation, freeing productive resources to be reinvested and expand the economic pie. A dynamic economic analysis accounts for changes in decisions based on the new incentives for labor and capital and the ways those decisions indirectly affect other parts of the economy over time. A dynamic analysis of the Wyden–Gregg proposal conducted by the Center for Data Analysis at The Heritage Foundation shows that:[2]
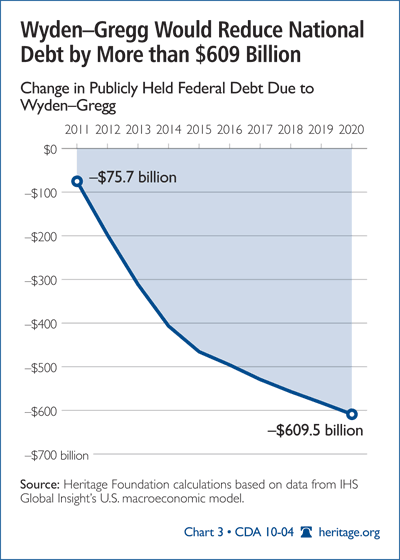
- The federal deficit would be an average of $61 billion (nominal) lower per year;
- The nation’s debt-to-GDP ratio would be 3.9 percentage points lower by the end of 2020, indicating a significant reduction in publicly held debt;
- An average family of four would have about $4,095 more disposable income every year;
- Foreign investment in the U.S. would be an average $292 billion (nominal) higher each year, and U.S. multinational corporations would repatriate and invest an average $19 billion (nominal) more in the U.S. per year;
- 2.3 million more jobs would be created on average each year;
- The aggregate net wealth (assets minus liabilities) of U.S. households would be $643 billion higher by the end of 2020; and
- Real GDP would be an average $298 billion higher per year.
Static Effects on Demographics: Microeconomics
Current law mandates that starting in 2011, there will be five tax rates for individual tax filers, and the top marginal rate will rise to 39.6 percent. The Wyden–Gregg bill keeps the top rate (affecting taxable annual income above $140,000) at 35 percent and has only two other rates for individual tax filers: 25 percent for taxable income between $75,000 and $140,000 and 15 percent for taxable income up to $75,000. Combined with a nearly threefold increase in the standard deduction and the elimination of the alternative minimum tax (AMT), the Wyden–Gregg bill would result in lower marginal rates for regular (non-capital gains) income for the majority of taxpayers.
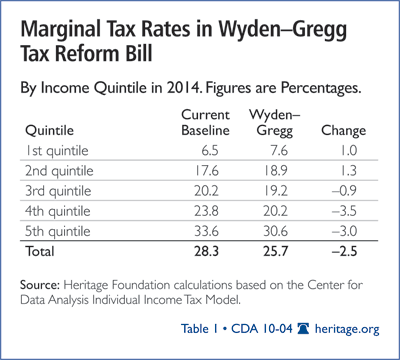
The Wyden–Gregg bill would also eliminate the upper-income phaseout of itemized deductions, providing additional relief to upper-income filers who itemize. The bill would retain most of the more popular deductions and credits. Although this would further reduce the tax payments of low- and middle-income filers, it would also leave some of the tax code’s complexity intact and reduce economic efficiency.
The Wyden–Gregg bill also would change the handling of capital gains and dividend income. The bill applies a 35 percent exclusion to long-term capital gains and dividends. The remaining 65 percent is taxed at the top marginal income tax rate. This would result in lower long-term capital gains taxes for taxpayers who are not subject to the top marginal rates, but high-income taxpayers and taxpayers whose income is mostly or entirely from long-term capital gains may face a capital gains tax increase . Taxpayers will also see lower short-term capital gains tax rates. Under current law, short-term capital gains are already subject to regular income tax rates (starting in 2011, the top rate will be 39.6 percent under current law), but without the 35 percent exclusion.
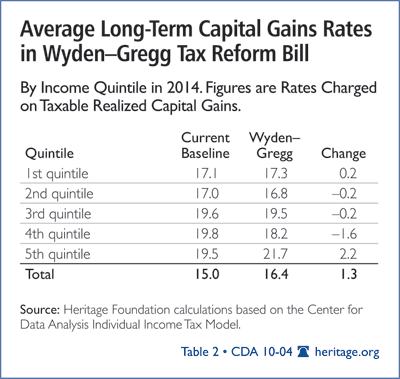
In a static projection, according to analysis by The Heritage Foundation’s Center for Data Analysis, the individual income tax portion of the Wyden–Gregg bill would reduce revenue by about $180 billion per year starting in 2011. The revenue loss would increase from about $160 billion in 2011 to over $200 billion in 2014, but the dynamic analysis shows actual revenue loss would likely be significantly less, given the economic growth effects of the policy. In addition to simplifying the tax code somewhat, the bill would reduce the tax burden on a majority of tax filers.
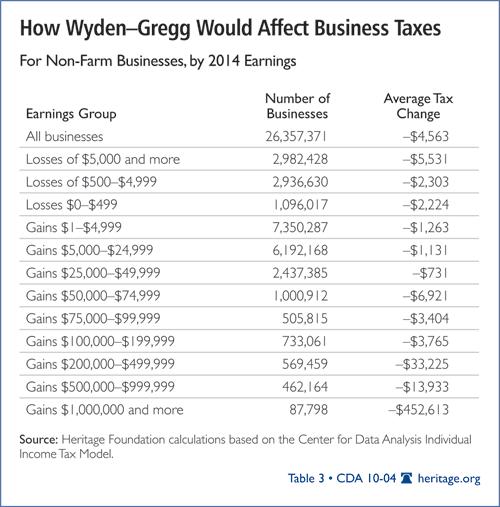
Small-business tax filers would fare especially well under the Wyden–Gregg tax proposal compared to current law. Under current law, small businesses filing through the individual income tax code face an average effective tax increase in 2011 of more than 3 percent (from 20 percent to 23.5 percent), or about $6,000 per year. Under Wyden– Gregg, average tax rates for small businesses would stay at about 20 percent, resulting in a liability of about $5,000 less. Although highly successful small businesses would see the greatest tax reduction compared to current law, small businesses of all income levels would be better off.
Dynamic Efects of Tax Reform: Macroeconomic Impact
The income tax system is highly complex, which raises the cost of compliance and, in turn, the cost of enforcing the law. Additional administrative costs are not the only source of the excess burden, or what economists call the deadweight cost of taxation. In addition to this cost, welfare losses arise from the hindrances that the income tax system places on the productive resources of the economy. The goods and services not created due to underused productive resources are an economic cost that adds to the taxpayer’s burden. Taxing the very things that generate capital gains and dividend profits—labor, capital, and entrepreneurial success—causes fewer productive resources to be employed in the economy.
Thus, it is estimated that for every $1 of tax revenue collected, the taxpayer actually pays between $1.11 and $1.15. The additional 11 percent to 15 percent is the excess burden of the tax on the taxpayer that comes from the lost opportunities for higher living standards when resources are allocated because of an imposed tax rather than allocated to their best economic use.[3] Tax reforms that simplify the code and lower taxes on productive resources can reduce the excess burden significantly. This frees resources that can be used to produce other current goods and services or invested to create future growth.
In a dynamic economy, lowering the deadweight cost of taxation can have compounding effects. More use of productive resources increases the availability of investment funds. Higher levels of investment allow the economy to grow at a higher rate, thus creating a cycle that produces more income, leading to more savings and investment that further expand the economy and build the wealth of individual households. Combined with government-spending constraint, higher economic growth eases the burden on future taxpayers and strengthens the fiscal health of the government.
A greater number of financially stable households helps to strengthen the U.S. economy as a whole. A stronger economy attracts global investors, entrepreneurial immigrants, and global corporations that put their resources to use in the U.S., thus providing even more employment and consumer opportunities for American citizens.[4]
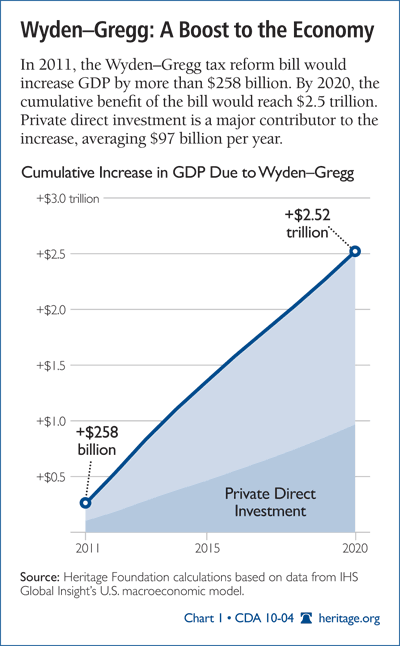
These effects can be seen in the dynamic macroeconomic results. Over a 10-year horizon, an estimated additional $2.5 trillion worth of goods and services is produced under Wyden–Gregg. The increased output gives some measure of the savings, which stem largely from the reduction in deadweight costs generated by the tax reform policy. Wyden–Gregg would reduce the excess burden of taxation in two ways.
First, it would lower the tax on the income generated by investing and using resources (labor, capital, entrepreneurial activity), thus encouraging more use of these resources to create income. This intensive effect shrinks the deadweight cost by the amount of additional GDP created by the greater use of these productive resources.
Second, the effect is extensive. By expanding the tax base both directly (as seen in the micro results) and indirectly (by encouraging higher income growth, as seen in the macro results), the lower deadweight cost is spread over a greater number of tax dollars collected.
Using the additional GDP produced as a measure in the reduction of deadweight costs and the additional revenue collected, one can calculate approximately how much of the excess burden on taxpayers is reduced by the Wyden–Gregg proposal. This calculation shows that the reduction in the deadweight cost of taxation is $0.09 per $1 of tax collected.[5]
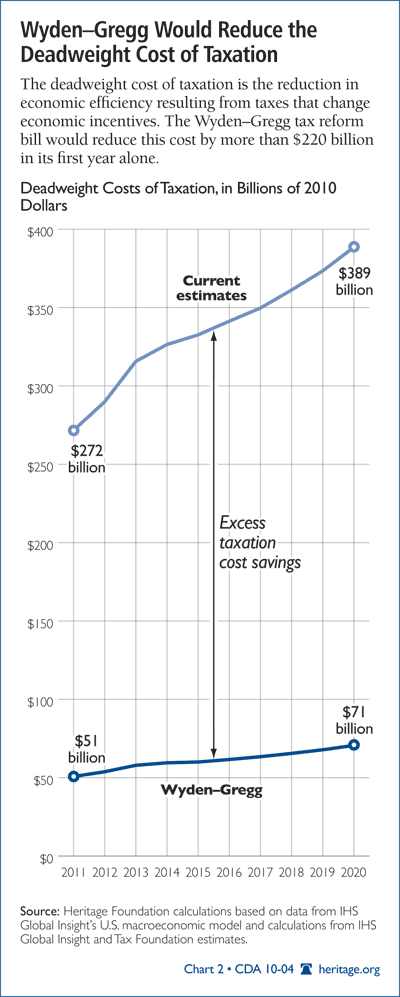
Under Wyden–Gregg, for example, instead of paying $1.11 for every $1 collected, as is the case under the current system, the taxpayer would pay approximately $1.02 for each $1 collected. This means that if a taxpayer owes the government $10,000 in taxes, that taxpayer really pays—in time spent, accounting fees, lower wages due to lower productivity, etc.—$11,100. Under the Wyden– Gregg reform, a taxpayer who owes $10,000 in tax will instead pay a total of $10,200 ($10,000 in actual tax and $200 in excess burden).[6]
The bipartisan Wyden–Gregg proposal lowers the corporate income tax rate. The proposal calls for a statutory 24 percent corporate rate instead of the current 35 percent rate. Changes in some deductions and other provisions cause the average effective rate to be roughly 3 percentage points below the statutory rate: approximately 21 percent instead of an average baseline effective corporate rate of 24 percent.
The 11 percentage point reduction in the corporate income tax rate has the effect of making the U.S. more attractive as a place to operate a business. Increased business investment in the U.S. provides more job and income opportunities for Americans. Businesses invest in new technology and capital, both physical and human. Often, these investments have spillover effects, such as creating an economy of scale or workers learning a transferable skill that can be used in other parts of the business, and the value added is therefore greater than the sum of the additional assets. This unmeasured residual, total factor productivity (TFP), can be a major driver of economic growth.
Theory and measurement are still developing to understand and explain TFP, but it is widely believed to stem largely from entrepreneurial investments in new, value-creating endeavors.[7] High tax rates can cause many of these entrepreneurial activities to go untried. A recent study has estimated, for instance, that an increase of 10 percentage points in the corporate effective tax rate reduces the average rate of business entry by 1.4 percentage points.[8]
That same study finds that the average rate of foreign direct investment (FDI, or foreign assets in the U.S.) in the U.S. would be approximately 2.3 percentage points lower and that the rate of domestic investment would be 2.2 percentage points lower if corporate effective rates increased by 10 percentage points. Arguably, then, a 3 percentage point (11 percent) reduction in corporate effective rates should increase the rate of FDI and domestic investment. In our CDA analysis, FDI is an average of 0.7 percent higher each year between 2011 and 2020. Similarly private domestic investment averages 3 percentage points higher than the baseline for each year of the analysis.9 In other words, there is less outsourcing and more insourcing.
The positive incentives of a lower tax rate increase investment in the U.S., both by domestic corporations and by foreign corporations. This further increases economic growth, leading to higher equity valuations and thus lowering the cost of equity. In addition, the proposal moves toward limiting the preference for debt versus equity financing by disallowing the deduction of the part of interest that is due to inflation. All else equal, this reduces a subsidy on debt financing, thereby raising the cost of debt and lowering the supply of corporate bonds. This dynamic puts downward pressure on corporate bond yields, in addition to which, combined with the higher supply of savings due to the incentive of lower taxes on savings capital, triple-A corporate bond rates are 0.1 percentage point lower on average.[9]
The combined effect of lower costs of equity and higher costs of debt[10] helps to decrease the gap between debt and equity-financing costs. While debt leverage can magnify gains, it can also magnify losses that have far-reaching economic consequences. To the extent that cost of debt financing reflects the true costs versus an artificially lower cost from a tax subsidy, the risk of overleveraged companies can be minimized. This can contribute to the greater financial strength and stability of the business sector.
A financially sound business sector contributes to the stability of household wealth. Greater saving and investment and higher returns on those savings grow the assets of households. The total stock of household real net wealth grows at a higher average annual rate than the baseline. The power of compounding growth on a higher growth rate allows households to reach such financial goals as college education and retirement much more quickly.
Higher wages and salaries, higher profits, and higher capital earnings expand the corporate and personal tax base. From 2011 to 2020, $84 billion (nominal) more in tax revenue is collected. Additionally, lower interest rates and a stronger economy[11] lower the cost of running the government. This combination of lower payments and higher revenues decreases the federal deficit by an average of $61 billion per year. This helps to shrink the national debt so that by the end of the decade, the debt-to-GDP ratio is 3.9 percentage points lower than it would be under the baseline forecast.
The combined effects of tax reductions on capital, labor, and successful entrepreneurship increase the growth potential of the economy and create an average of 2.3 million more job opportunities per year, almost all of which are in the private sector.
—Karen A. Campbell, Ph.D., is Policy Analyst in Macroeconomics in the Center for Data Analysis, and Guinevere Nell is Research Programmer in the Center for Data Analysis, at The Heritage Foundation.
Appendix A
Microeconomic Methodology
The portions of the Bipartisan Tax Fairness and Simplification Act of 2010 that affect the individual income tax code were simulated using the Center for Data Analysis Individual Income Tax Model in order to estimate the effect of the bill on tax revenue and the distribution of the resulting tax burden and compare these effects to current-law estimates.
The CDA tax model simulates the effect of tax-law changes on a representative sample of taxpayers, based on IRS Statistics of Income (SOI) taxpayer microdata. Data for these taxpayers are extrapolated or “aged” to reflect detailed taxpayer characteristics through 2016. The data are aged for consistency with the Congressional Budget Office baseline forecast in order to produce effective and marginal tax rate estimates with which to forecast dynamic effects of the changes in tax burden.
The personal income tax provisions of the Wyden–Gregg bill that were simulated are:
- The new three tax brackets (with 15 percent, 25 percent, and 35 percent rates);
- Repeal of the alternative minimum tax (AMT);
- The increased standard deduction;
- The treatment of capital gains as regular income, with a 35 percent exclusion;
- Elimination of the phaseout of deductions and exemptions; and
- Elimination of miscellaneous itemized deductions.
These policy changes were run together as a single simulation to allow for interactions between them. This simulation was then compared with a simulation of current law. The simulation of current law included recent tax changes such as:
- The new Making Work Pay credit;
- Scheduled “patches” and changes in the AMT and education credits (Hope, Lifetime Learning, and the American Opportunity tax credit); and
- Tax increases that accompany the recently passed health care bill. The Medicare Hospital Insurance tax is increased by 0.9 percentage point and applied to capital gains income for those with incomes over $250,000 (joint filers) or $200,000 (all others), and itemized deductions for out-of-pocket medical expenses are limited to expenses above 10 percent of adjusted gross income (AGI); the current threshold is 7.5 percent.
For each simulation, marginal tax rates for non– capital gains income tax were averaged for income groups divided into U.S. Census income quintiles. Effective long-term capital gains rates were determined based on reported long-term capital gains or losses and total taxes paid at the tax rate applied under the given policy after any deductions that were taken. For the effect on small businesses, non-farm businesses were defined as those reporting income using a Schedule C form or reporting income as a partnership or S-Corporation; these were divided into income groups based on how much they reported in total business income loss or gain.
Appendix B
Macroeconomic Methodology
Analysts from the Center for Data Analysis used the IHS Global Insight March 2010 short-term model of the U.S. economy to estimate the overall net economic effects of the Wyden–Gregg tax reform proposal.[12] The baseline represents the most likely path of the U.S. economy over the next 10 years. The relationships in the model are calibrated by historical U.S. data and mainstream economic theory. The model is a tool that gives insight into likely magnitudes and the direction of economic variables due to policy changes. A dynamic analysis is important because in an ever-changing and market-based economy, the indirect and feedback effects need to be taken into account to get a true estimate of the likely overall economic impact.
Direct effects happen, for example, when many individuals make small changes in their labor and leisure trade-off decisions. These changes, in turn, change capital-labor trade-offs made by businesses. The macroeconomic model estimates these changes in relative prices dynamically such that these changes affect investment and output levels. Tax rate changes also affect disposable income and demand variables. These have further feedback effects with supply variables as well as interaction with the fiscal revenues and spending variables. The feedback effects further increase or decrease the longer-term impact of the policy, providing a quantitative picture of whether the economy would tend to be stronger or weaker if the proposal were implemented versus the baseline.
In the macroeconomic model, overall average marginal tax rates were changed by the amount simulated by the micro tax simulation model for individual filers (see methodology above).
The average effective personal tax rate was changed by estimating the implied average effective rate in the macro model baseline as the total personal tax receipts divided by the total personal income. Total tax receipts were then reduced by 10 percent annually. This is the amount that the static microsimulation estimated to be the amount of lost revenue (that is, with no changes in income or individual behavior; e.g., no changes in labor supply decisions). The static, policy-induced, implied average effective tax rate was then calculated by dividing the total tax receipts by the total income.[13]
The implied average effective baseline rate is different from the baseline value of the average effective rate variable in the IHS Global Insight model. The difference between the two was used to adjust the average effective rate induced by the static simulation of the policy. The average effective personal tax rate is a stochastic variable in the model. In order to allow other changes induced by the policy to affect the average rate, the variable’s add factors were adjusted down by the amount implied by the static micro simulation model.
Taxes on labor affect labor market incentives. Aggregate labor elasticity is a measure of the response of aggregate hours to changes in the after-tax wage rate. These are larger than estimated micro-labor elasticities because they involve not only the intensive margin (more or fewer hours), but also, and even more so, the extensive margin (expanding the labor force).[14] The change in total man-hours was estimated using a macro labor elasticity of 1.8, which is on the lower end of empirically estimated ranges. Man-hours is also a stochastic variable in the model. The fundamental tax reform proposal could further alter aggregate man-hours due to labor demand and supply interactions (due to changes in optimal capital and labor ratios, for example). In order to allow these effects to occur, the add factor of total man-hours was adjusted by the direct elasticity effect so that the variable could still be affected by other indirect effects.
The statutory corporate tax rate in the IHS Global Insight model was changed from 35 percent to 24 percent as per the proposed Wyden–Gregg legislation. As with the individual side, corporations have many deductions and exclusions such that the overall average effective rate is lower than the actual statutory rate. The proposal eliminates some of these deductions and thus alters the difference between the statutory rate and the average effective rate. The Congressional Research Service (CRS) estimated that between FY 2010 and FY 2019, the net effect of reducing the corporate rate and eliminating some deductions would be between $540 billion and $707 billion of lost tax revenue (depending on whether the baseline is current policy or the President’s budget fully enacted, respectively).[15]
The baseline used for the CDA analysis assumes a future of current policy and the President’s budget. For example, it assumes that some of the Bush tax cuts will be extended over the forecast horizon, though they will expire for those in the higher-income tax brackets; thus, overall average tax rates are forecasted to rise over the next 10 years under the baseline. The average of the CRS-estimated tax revenues lost was used in order to calculate an average effective rate for corporations.
This calculation was done by taking the sum of the tax revenues in the baseline for FY 2010 to FY 2019 and subtracting the CRS-estimated lost revenue. The new sum of the corporate tax liability was then distributed to each year by the same proportion as the baseline yearly collections. The average effective rate was then calculated by dividing the annual federal corporate tax receipt by the annual pre-tax corporate profit. The average effective tax rate was then subtracted from the new statutory corporate tax rate of 24 percent. The difference was used to change the variable “difference between the statutory and effective corporate tax rate.”
In a study of the Organisation for Economic Co-operation and Development’s member countries, a 5 percentage point reduction in corporate tax rates has been found to increase total factor productivity (TFP) by 0.4 percentage point over 10 years.[16] To simulate this effect, the TFP trend variable was increased by 0.036 percentage point per year, which was between 1.2 percent and 1.3 percent above baseline. (This is in line with another study that finds that a 10 percentage point decrease in corporate rates can increase annual growth rates by 1 to 2 percentage points.)[17] The assumption of a rate on the lower end of the range was done in order to be conservative because, as mentioned, there are other changes for corporations that affect their average effective corporate rate, and the statutory reduction therefore may not affect their tax liability as greatly.[18]
Wyden–Gregg proposes to close deficit gaps by eliminating some corporate and business-related subsidies by an average of $23 billion per year.[19] In the macro model, there are three business subsidy variables. Each was adjusted down slightly so that the overall decrease in federal government business subsidies was between $19 billion and $21 billion less per year. This is on the low end of estimated savings due to the many political constraints on eliminating government spending programs.
Finally, the statistical discrepancy (SD) variable between the income and product accounts in the National Income and Product Accounts (NIPA) was adjusted. This is an exogenous, constant variable in the model. Empirically, this variable fluctuates positive and negative and is rarely the same from year to year.[20] A fundamental tax reform that affects the productive capacity of the economy as well as the shares of income to different factors would very likely change this variable. Furthermore, this variable affects the estimations of income, profits, and unemployment rates that then affect many of the other variables.[21]
There is no theory for how this variable would be affected by the policy. In order to minimize bias from the SD, the variable was set at zero. To check whether this produces a reasonable relationship between the income and product accounts (and therefore does not bias the results unduly), the relationship between gross national product (GNP) and national income in the baseline was calculated without the SD.[22] Thus, the baseline was re-forecast with the SD variable set to zero. The difference between net national income (YN) and GNP was then calculated as the baseline difference between the variables. The policy simulation was then run with no statistical discrepancy. The difference between the policy and new baseline is the new implied SD.[23] The implied SD averaged $26 billion over the 10 years (versus the exogenous setting of $253 billion). Because the implied discrepancy was small (relative to the original setting), the SD variable was left at zero.
Target Checks
Empirical and theoretical studies were used to evaluate whether the simulation results provide a reasonable estimate of the effects of the Bipartisan Tax Fairness and Simplification Act of 2010. This was done by comparing the effect on variables in the model that were not directly changed to relevant empirical studies in order to determine whether the simulation produced results in the range of those observed in the real world. Where empirical estimates were not available, variables were checked to determine whether their change was consistent with accepted economic theory found in the literature.
A recent study found that a 10 percentage point increase in the average effective corporate tax rate reduces the aggregate rate of investment to GDP by about 2 percentage points.[24] Thus, a decrease in the effective corporate tax rate should raise the investment-to-GDP ratio. The Wyden–Gregg tax reform effectively cuts the average corporate tax rate by an average of 3 percentage points.[25] The simulation produced an average increase in the investment-to-GDP growth rate of 0.2 percentage point above the baseline. This is somewhat lower than what the literature found; however, the average effective corporate rate reductions in the first half of the decade (2011 to 2015) were only about 1 and 2 percentage points lower than the baseline, and the investment-to-GDP ratio on average is therefore very similar to empirical findings.
Currently, the interest on debt financing can be expensed, which reduces corporate tax liability, thus making debt relatively cheaper than equity financing. One of the goals of the Wyden–Gregg proposal is to provide a more level playing field between the choice of debt or equity financing. In order to check whether the method used to simulate the corporate changes correctly accounted for the microeconomic relative price impacts of the tax changes, the difference between the cost of debt and the cost of equity was used as a goal post. The simulation produced a reduction in the differential between debt and equity costs, which provided a check that the capital-financing impact results are qualitatively correct.
The reduction in the corporate tax rate increases the competitiveness of the United States as a location for multinational corporations. This increased competitiveness not only keeps some U.S. firms from moving overseas, but also is an incentive for some firms from higher-tax countries to relocate to the U.S. This increased competitiveness with foreign tax rates should thus increase foreign assets in the U.S. ceteris paribus. The simulation showed that it does so by an average of $292 billion per year (not adjusted for inflation). The policy also eliminates deferral for corporate profits held overseas. This legislative change eliminates some of the benefit of keeping profits overseas rather than repatriating them immediately. All else equal, one would expect fewer corporate profits to be held overseas. The simulation predicts that overseas profits will be about $19 billion less per year (not adjusted for inflation). The dynamic effects of the corporate tax changes increase the corporate tax base and reduce the amount of lost revenue that one would expect from a static analysis. The CDA’s dynamic analysis shows revenue losses from the corporate sector of only $238 billion over 10 years versus the CRS static analysis of between $505 billion and $707 billion.
Appendix C
Deadweight Cost of Taxation Calculation
The total amount of additional (above the baseline) real GDP produced between 2011 and 2020 is $2.5 trillion (in 2010 dollars).[26] At the end of 2020, a total of $34 trillion (nominal) dollars of tax revenue is estimated to be collected under the Wyden–Gregg proposal.
Deflating the 2020 tax dollars to 2010 dollars, assuming 2 percent inflation per year ($34 trillion divided by 1.22), and dividing this inflation-adjusted amount into the total real GDP savings ($2.5 divided by “34 divided by 1.22”) yields a savings of $0.09 per every $1 of tax collected.


